


A House Of Cards On Borrowed Times


THE WEEK THAT IT WAS...
The week of the 2024 spring solstice was all about central banks meetings with the BOJ and FOMC among 20 other central banks meeting over the past 5 days.
As widely anticipated, the Bank of Japan ended the most aggressive monetary tightening in modern history by raising its policy rate to 0.1%. Additionally, the BoJ discontinued its yield curve control program while committing to continue purchasing long-term government bonds as necessary. Furthermore, it ceased the purchase of Japan Equity ETFs and Real Estate Investment Trusts (REITs). In terms of forward guidance, the Bank of Japan isn't providing much clarity. It simply states that it will continue to monitor developments in financial and foreign exchange markets, as well as their impact on Japan's economic activity and prices.
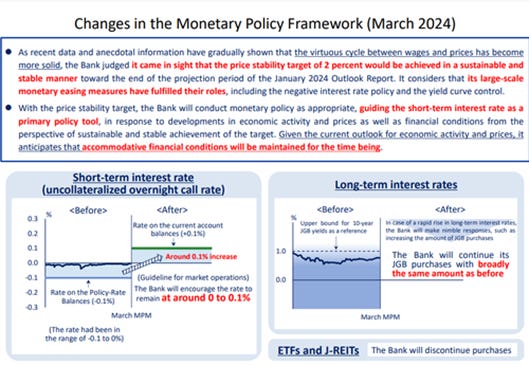
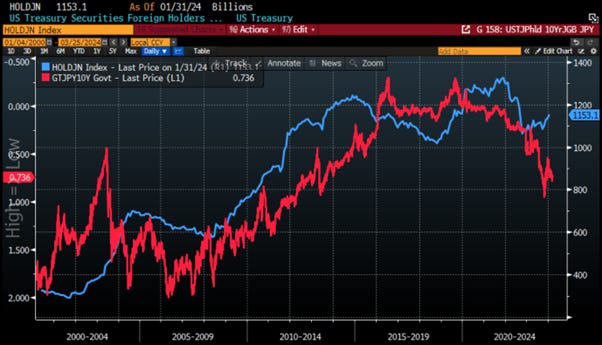
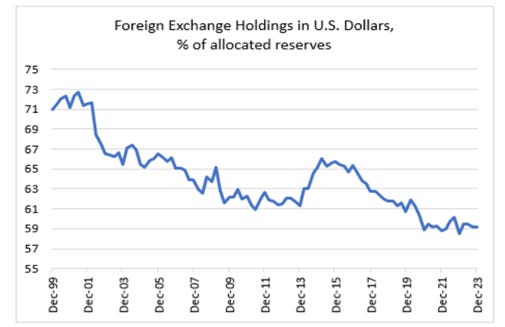
The BoJ had started buying risk assets like ETFs in 2010, ultimately becoming the largest holder of Japanese stocks. The BoJ’s decision to tighten further its monetary policy in the future would remove a significant source of liquidity for international markets and encourage Japanese investors to focus on their domestic bond market. As a result, the Japanese 10-year yield is expected to rise. This implies that US Treasury Yields will need to be significantly higher to attract Miss Watanabe, to hold US Treasuries.
Holding of US treasuries by Japan (blue line); 10-Year JGB Yield (axis inverted) (red line)
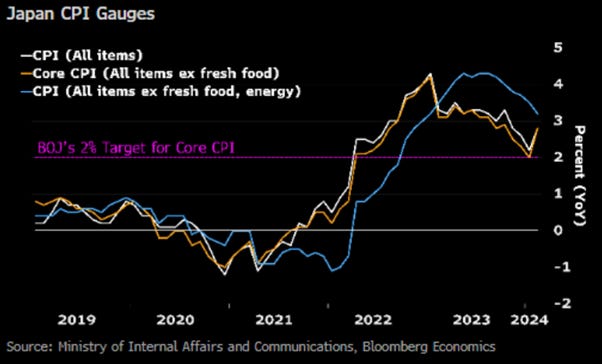
Japan CPI surged from 2.0% YoY in January to 2.8% YoY in February, primarily due to a low base from the previous year when subsidies restrained utility prices. Excluding fresh food and energy, the CPI decelerated to 3.2% from 3.5%, slightly below Bloomberg's consensus of 3.3%.
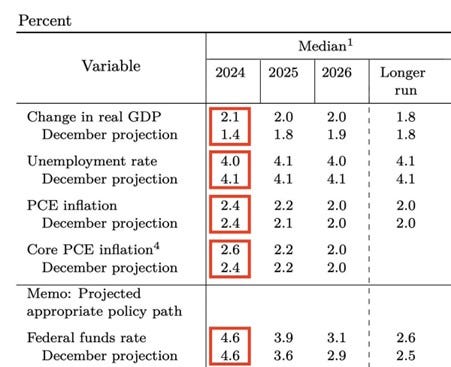
The key takeaways from the FED's SEP are that it raised expected real GDP growth to +2.1%, lowered expected unemployment rate to 4.0%, kept expected PCE inflation at 2.4%, and raised expected core PCE inflation to 2.6%.
The FOMC, while indicating higher dots, was overshadowed by a politically dovish Powell, adding forward confusion regarding what the FED will actually be able to do in 2024 as the US moves into the inflationary bust phase of the business cycle.
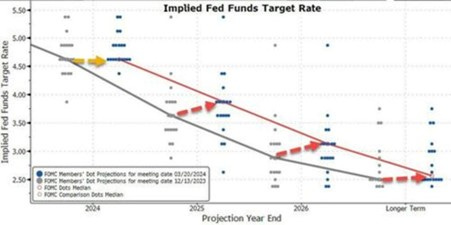
While the consensus still expects three rate cuts for the year, starting in June, as inflation reaccelerates by the summer, the politically correct FED will, at best, be able to keep interest rates unchanged for the year as stagflation emerges by the summer. Would it not be politically driven, it should raise interest rates to combat the incoming Bidenomics-driven stagflation.
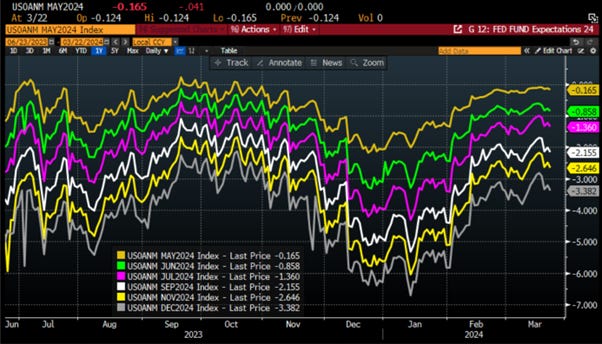
In the meantime, the consensus is still chasing the infamous pivot even Wall Street has been wrong for almost 2 years on that matter.
The S&P Flash PMI for March dropped to 52.2 from 52.5, showing a divergence between services and manufacturing sectors and signalling renewed inflationary pressures. Manufacturing saw a surprise rise to 52.5, while services fell more than expected to 51.7. However, concerns were raised about inflation, as input costs increased at the quickest pace in six months and selling prices rose to the highest level since April last year. This suggests potential upward pressure on consumer prices in the coming months.

Following several lacklustre coupon auctions the previous week, the US Treasury successfully sold $13 billion at a yield of 4.542%, slightly below last month's 4.595%. Impressively, it stopped through the When Issued 4.562% by 2 bps, marking the largest stop through since January 2023. The bid-to-cover ratio surged from 2.39 in February to 2.79, one of the highest on record and well above the six-auction average of 2.56. Additionally, the allocation to Indirects surged to 73.5%, nearing the record high, while Directs received 17.2%, slightly below last month's 19.7%. Dealers were left with only 9.3%, one of the lowest Dealer awards on record.

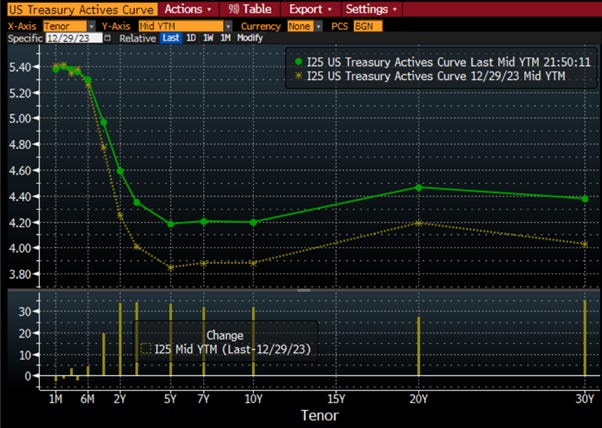
The auction's surprising success wasn't sufficient to appease the bear steepener, which emerged from hibernation at the beginning of the year.
Nearly a year ago, the Congressional Budget Office (CBO) reported a $422B Federal budget deficit for Q1 2023. Fast forward to January 2024, the CBO announces a $509B deficit for Q1 2024. Revenue increased by 8%, but expenses rose by 12%, indicating a concerning trend. The US is now facing an evident debt spiral, with a deficit to GDP ratio nearing 8%, reminiscent of crises like the 2008 GFC and the 2020 pandemic. Some argue deficits don't matter, citing Japan's situation, but the US differs with twin deficits and a negative Net International Investment Position, making its debt outlook more precarious.

Unless the US drastically reduces entitlement and defense spending by 40%, which is improbable in an election year and amid widespread military tensions, such austerity measures are as unlikely as finding honesty in Congress. Without these essential cuts and transparent budgeting, policymakers will likely ignore another year of multi-trillion-dollar deficits, burdening current and future generations while resorting to inflation to mitigate debt by injecting more devalued currency into circulation.

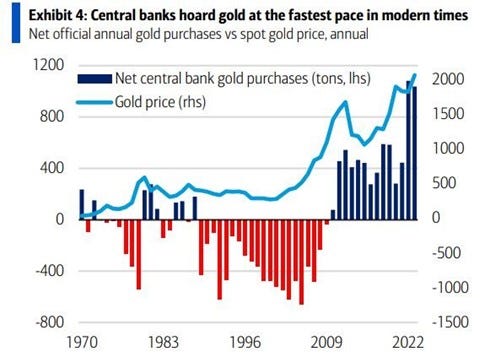
While Developed Markets struggle with Fiscal Dominance, Emerging Markets debt presents winners in the form of government bonds offering high real yields supported by robust fiscal policies. As a result, central banks in EM are not only buying gold but also investing in EM local currency government bonds to utilize the earnings in EM currencies from intra-EM trade, which is gradually shifting away from the dollar. Most EM countries boast low debt, independent central banks offering high real rates, and sound economic structures. Additionally, EM countries do not impose sanctions on each other's savings, rendering their bonds relatively safe. Recognizing these appealing attributes of EM bonds, other central banks are also allocating EM local currency bonds to their balance sheets, similar to their gold holdings.
Simultaneously, as the USD has been weaponized amid the conflict between Ukraine and Russia, central banks around the world, particularly in Emerging Markets, have been accumulating gold at the fastest pace in modern history.
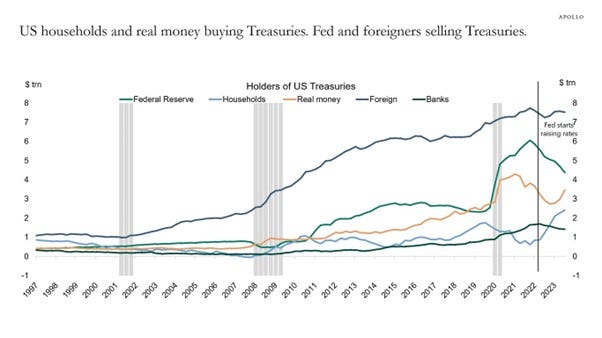
With the shift in US Treasury buyers from yield-insensitive entities like sovereign wealth funds and central banks to yield-sensitive buyers such as US households, pensions, and insurance companies, the Treasury may struggle to attract buyers for its bonds. Hypothetical rate cuts could lead to reduced demand from yield-sensitive buyers, potentially resulting in a steeper yield curve.
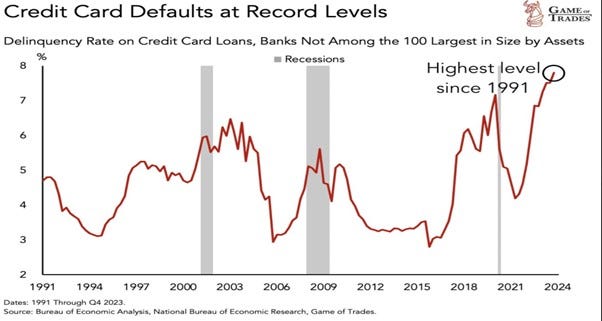
Despite the US unemployment rate nearing historic lows and interest rates remaining higher for longer than expected, consumer spending remains excessive, and credit card delinquencies are on the rise. This trend signals impending trouble and suggests that the precarious foundation of the US consumer economy may be on the verge of collapse.
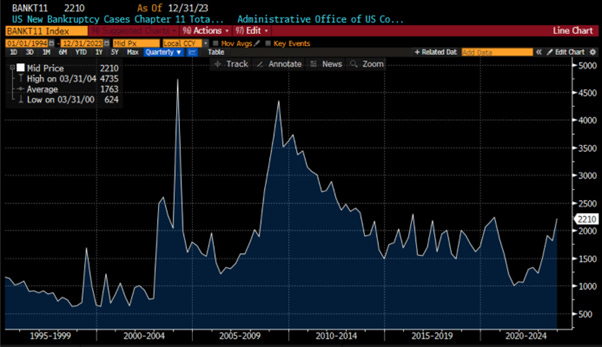
Consumers are not the only ones defaulting on their debts; corporate bond defaults surged massively in 2023, especially for high-risk junk bonds, and the trend is continuing at a pace not seen since the 2008 GFC in 2024. Debts that were financed in a low-interest rate environment are due to mature in the next few years, amounting to over $1.8 trillion by 2028, according to the FED. When those payments come due, more companies will succumb to the default wave. If the junk bond market plunges, it could burst the broader $13.7 trillion corporate bond bubble and drag down the rest of the economy with it.
In that context, investors will have soon to reassess their investments through the lens of counterparty risk. John Exter's Inverted Pyramid of Risk, introduced in the 1970s, offers insight into America's vulnerabilities, particularly amidst an impending credit crisis centred around the USD. The pyramid organizes assets from highest to lowest risk, highlighting the interconnectedness where the removal of lower-risk assets can lead to a collapse of higher-risk ones, akin to a Jenga tower.
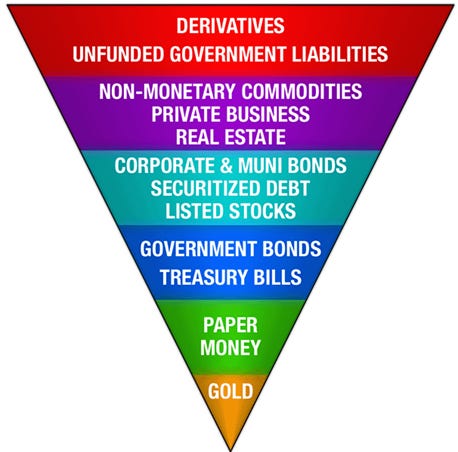
This risk hierarchy starts at the top with derivatives and unfunded government liabilities, which any form of financial turbulence can not only wipe out a participant’s initial investment but also entail additional losses. Warren Buffett notably dubbed them ‘financial weapons of mass destruction.’ Private Business Equity, Real Estate, and Non-Monetary Commodities include genuinely productive assets and commodities for economic growth but given their relation to the credit markets they prove highly sensitive during a deflationary recession, as exemplified by the 2008 financial crisis. Blue Chip Stocks, Corporate Bonds, and Sovereign Government Bonds are more conservative assets, appealing to long-term investors seeking yield beyond money market accounts and T-Bills. However, these assets are not immune to interest rate risks associated with FED policy and are still susceptible to substantial losses during recession/depression. Federal Reserve Notes & Treasury Bills sought for stability, are technically the first layer of what many call “risk-free” assets found in Federal Reserve notes and Treasuries. Even if one accepts this “risk-free” title (we do not), the solvency of the institutions holding these assets becomes a concern. At the foundational base of the pyramid, physical gold stands as the only asset devoid of counterparty risks or credit risks. Aligned with the foundational principles of what money should be, gold’s immutability and resistance to defaults, bankruptcy, devaluation, or a plunge to zero make it unique as the last stand in financial collapse.
This model also unveils the flow of capital during economic phases.
During credit expansions, capital moves up the inverted pyramid toward higher-risk, lower-liquidity assets, reflecting investors' willingness to take on greater risks for higher returns. As the pyramid broadens, capital is reused as collateral multiple times, amplifying theoretical contracted capital on higher layers, such as the derivative layer. In a crisis, capital is moving down the pyramid towards lower-risk assets like bonds, cash, and gold, illustrating a return to stability. The insight from John Exter's pyramid underscores the unseen layers of risk in financial flows, urging a broader consideration beyond balance sheets in investment decisions. Amidst flaws in the financial system, gold offers liberation from credit and government risks and currency devaluation. As sovereign debt defaults loom and liquidity expansion slows, markets will face short-term risks to liquidity-sensitive assets in 2024.

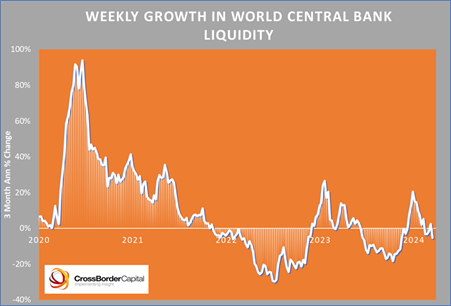
Market performance remains heavily influenced by liquidity, and although the nominal size of the Global Liquidity pool may continue to grow, markets are concerned about margins, with first differences often being more impactful. Asset markets have faced setbacks during previous liquidity decelerations, but a resumption of Global Liquidity expansion is anticipated. Nonetheless, short-term risks to liquidity-sensitive asset classes in Q2, 2024 cannot be overlooked due to this deceleration.
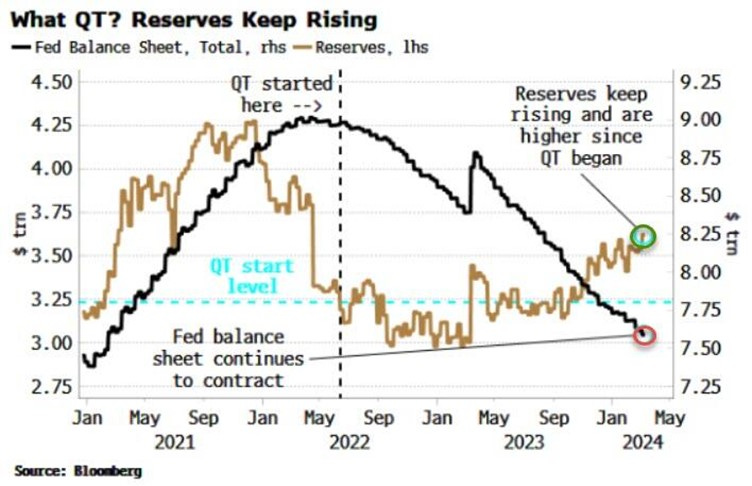
Investors rely on central bank balance sheets for insights into policy, liquidity, and signaling. Despite ongoing Quantitative Tightening and the FED's balance sheet contraction, reserves in the system keep growing. This supports favorable liquidity conditions, bolstering asset prices, which has been a boon for risk assets. However, turbulence may arise in the coming months. The reverse repo facility (RRP) is declining, and as tax receipts increase, the Treasury's account at the Fed (TGA) will grow, depleting reserves.
Indeed, financial markets have been on liquidity life support since the COVID pandemic, likely explaining why they have been able to overlook the inflation issue until now. In the past 12 months, while US CPI has been declining overall, much of this drop is due to cyclical factors, while structural CPI has remained elevated. Although cyclical CPI may continue to decrease, it is currently at unusually low levels, and its rate of decline appears to be slowing. There is a growing risk that it may begin to rise again, reinforcing the persistently high levels of structural CPI and leading to an increase in headline CPI.
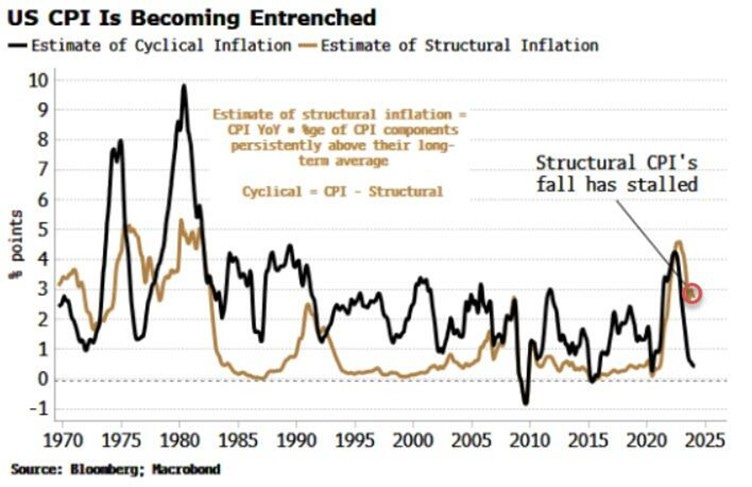
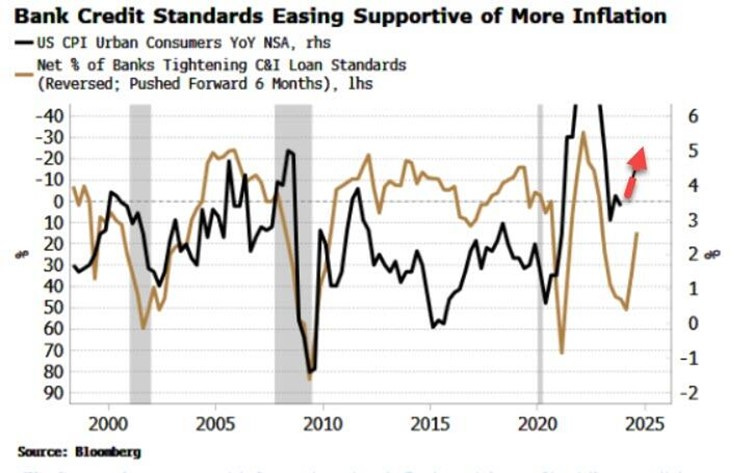
Banks re-easing credit standards faster than anticipated, particularly after SVB's self-immolation, also suggests a potential turnaround in CPI in the coming months.
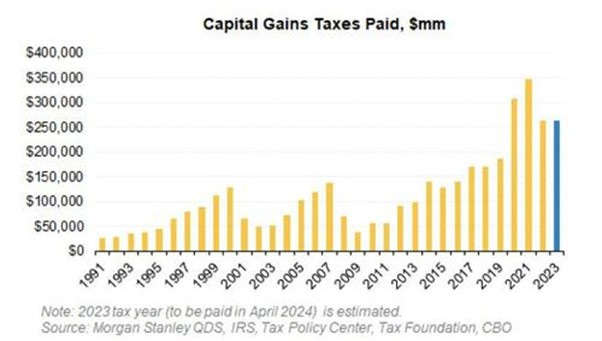
Not only is the US government living on borrowed time, but the recent equity rally also appears to be doing the same. As the US April 15th tax day approaches, US retail investors are facing a significant capital gains tax bill, estimated at $265 billion based on estimates. Although this figure is lower than the peak seen in 2022, it still ranks as the third-highest on record.
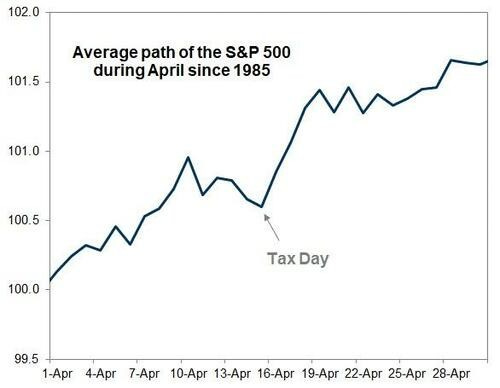
Tax selling, particularly when significant in size, ahead of April 15th, holds significance. Such payments historically affect equity flows, with retail cash equity demand, based on public data, typically 20 to 40% below the prior year average in the weeks preceding Tax Day. This decline is even more pronounced compared to the elevated run-rate in January and February. This reduction in demand could result in a 1 to 2% drag on the S&P 500.

Seasonality has historically been unfavorable for the S&P 500 leading up to the US Tax Day, and this year is not expected to be an exception.
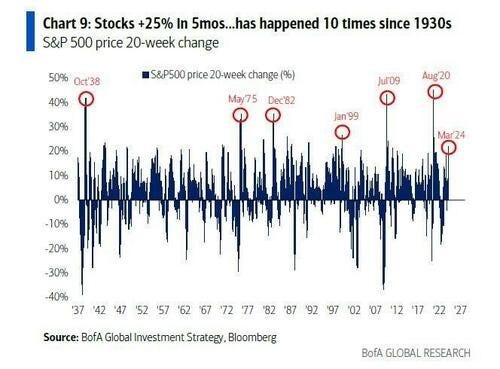
This trend coincides with a significant increase in household equity allocations, driven by a "Fear Of Missing Out" (FOMO) mentality, which is fueling a near panic to chase markets higher. The stock market has surged by a remarkable +25% in just 5 months, a phenomenon that has occurred only 10 times since the 1930s. Typically, such surges are observed from recession lows, but notably, there was no recession in 2023, according to the Biden administration. Additionally, these surges often mark the beginning of bubbles.
Every bubble consists of two elements: an underlying trend rooted in reality and a misconception related to that trend. When positive feedback develops between the trend and the misconception, a boom-bust process begins. This process may face tests from negative feedback, but if it survives, both the trend and the misconception are reinforced. Eventually, when market expectations diverge significantly from reality, doubts arise, and faith diminishes, but the prevailing trend persists due to inertia. In simple terms, bubbles continue to inflate until an unexpected event triggers a reversal in psychology from "exuberance" to "fear." The current rally in the market is accompanied by near-record levels of household equity ownership, a sign historically associated with significant market cycle peaks.

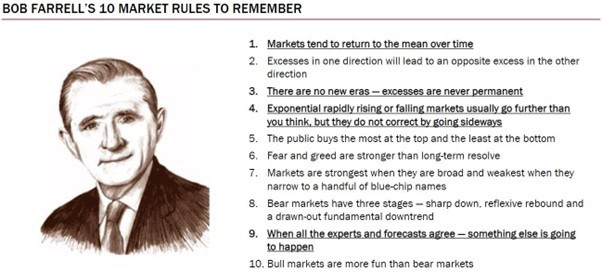
As Bob Farrell's investment rule number 5 emphasizes, the public tends to buy the most at market tops and the least at market bottoms.
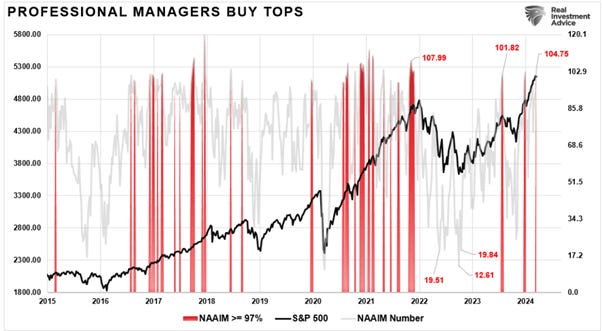
Not only do retail investors have a track record of buying at market tops, but professional managers also have a notorious tendency to do so. Instances where professional manager allocations exceed 97% are highlighted in red, indicating a pattern of buying at market peaks.
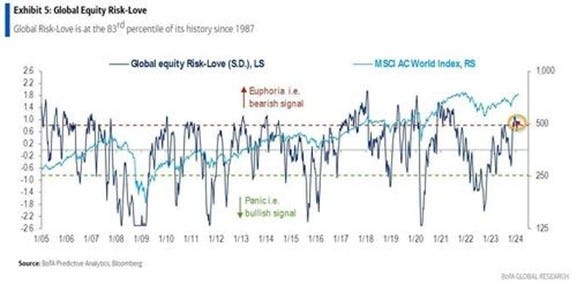
Indeed, there is widespread optimism in the market currently. Bank of America's risk positioning across equities suggests that "risk love" is currently at the 83rd percentile, reaching levels that have historically preceded short-term corrective actions.
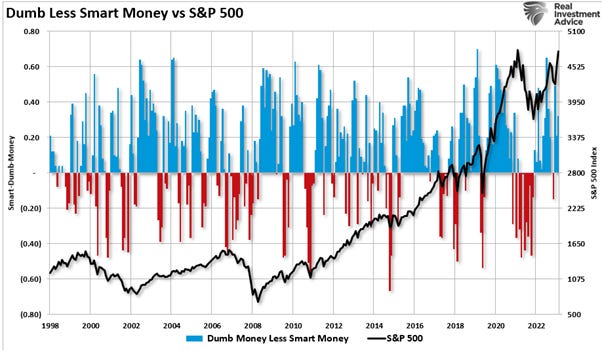
Looking at the difference between smart and dumb money investors, more often than not, the dumb money invests near market tops ad sells near market bottoms. That enthusiasm has increased sharply since last November as stocks surged in hopes that the Federal Reserve would cut interest rates.
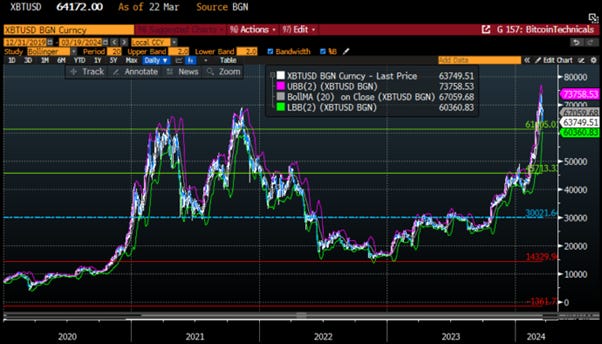
Like a stretched rubber band, stock prices anchored to their moving averages must relax in order to be stretched again. This phenomenon, known as the slingshot effect, applies to trends that become overextended in one direction or another and eventually revert to their long-term averages. Even in strong uptrends or downtrends, prices often return to their long-term moving averages. The concept of stretching the rubber band can be measured using standard deviation, such as with "Bollinger Bands."

Taking Bitcoin, a highly speculative asset class, as an example, the panic-driven Fear Of Missing Out following the introduction of US-based ETFs has propelled its price well beyond 2 standard deviations above its post Covid mean. This illustrates the frenzy to buy assets as liquidity remains readily available for investors.
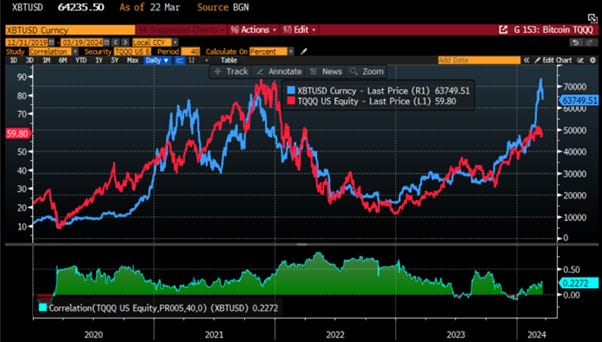
For those who haven't realized yet, Bitcoin doesn't behave like an "antifragile asset." In reality, it behaves more like a leveraged version of the Nasdaq, closely correlated with the performance of TQQQ (Triple leveraged Nasdaq performance).
This underscores Physical Gold as the sole hedge against the looming sovereign debt crisis. Despite this reality, many investors, both institutional and retail, have yet to grasp the importance of this hedge. As inflation continues to erode purchasing power, they may soon realize the need to protect their investments and only the barbaric relic will provide an alternative to blue chip equtiies as government counterpary risks rise.
WHAT’S ON THE AGENDA NEXT WEEK?
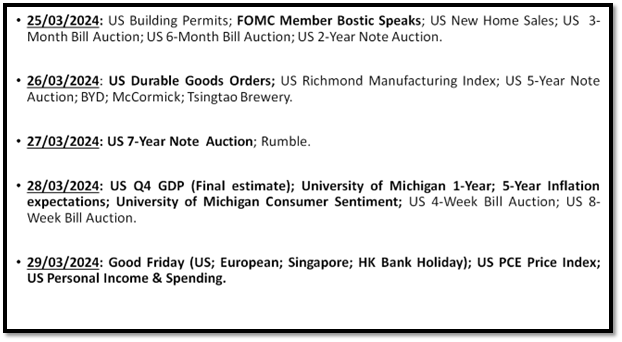
The final week of the first quarter will be shortened due to Good Friday, with European, US, Singapore, and Hong Kong markets closed. It will be a relatively quiet week, with attention on the University of Michigan inflation expectations on Thursday and the US PCE price index on Friday.
KEY TAKEWAYS.
As the first quarter of the year unfolds, here are the key takeaways:
The BOJ's historic exit from its Negative Interest Rate Policy will adversely affect Japanese equities, as Japanese banks will join their counterparts in developed markets in experiencing negative returns on their government bond holdings.
A dovish Powell contrasts with hawkish DOTs as the FED navigates 'Forward Confusion' ahead of the looming inflationary bust.
The recent increase in prices within the flash PMI data suggests unwelcome upward pressure on consumer prices in the months ahead.
The latest 20-year bond auction was surprisingly stellar but was not enough to calm the return of the bear steepener.
The shadow liquidity backdrop going forward is expected to be less favorable than it has been over the past 9 months.
As there is absolutely no question that the western world is heading into a very serious sovereign debt default, the government bond house of cards is living on borrowed time. Western governments have been engaging in a Ponzi debt scheme until they can no longer sell new debt to redeem the old ones. Int that context, wars will provide a way for western governments to default on their debts.
Wars are historically inflationary and have a track record of generating positive returns for equities not for bonds.
In an inflationary bust (i.e. stagflation), the best way for investors to protect their wealth is to own the equity barbell portfolio made of Tech and Energy and Physical Gold.
As stagflation rather than recession materializes in the next few months, investors should prepare their portfolios for HIGHER volatility.
In this context, investors should also remain prepared for dull inflation-adjusted returns in the foreseeable future.
HOW TO TRADE IT?
As we close the first quarter of the year, central banks grapple with "forward confusion" amidst mounting signs that the inflation boomerang will strike harder and sooner in the coming months. In this context, it is not surprising that US equity indices reached another all-time high, with Nasdaq outpacing the S&P 500 and the Dow Jones in the past week. However, technical indicators suggest a persistent divergence since December, hinting at the potential for higher volatility to affect markets in the weeks ahead.

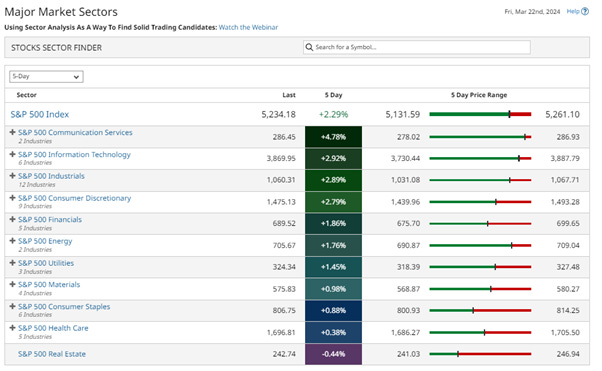
Given the current environment, it's unsurprising to see growth sectors such as Communication Services and IT outperforming, while Healthcare and Real Estate lag behind.
As volatility is expected to rise, investors are cautioned to remain vigilant in their asset allocation. It's advisable to avoid long-term government bonds and maintain some cash ‘’dry powder’’. Consider adding quality names like those in the Dow Jones and Berkshire Hathaway to the portfolio during periods of market fear rather than greed in the coming months.
At The Macro Butler, our mission is to leverage our macro views to provide actionable and investable recommendations to all types of investors. In this regard, we offer two types of portfolios to our paid clients.
The Macro Butler Long/Short Portfolio is a dynamic and trading portfolio designed to invest in individual securities, aligning with our strategic and tactical investment recommendations.
The Macro Butler Strategic Portfolio consists of 20 ETFs (long only) and serves as the foundation for a multi-asset portfolio that reflects our long-term macro views.
Investors interested in obtaining more information about the Macro Butler Long/Short and Strategic portfolios can contact us at info@themacrobutler.com.
Unlock Your Financial Success with the Macro Butler!

Disclaimer
The content provided in this newsletter is for general information purposes only. No information, materials, services, and other content provided in this post constitute solicitation, recommendation, endorsement or any financial, investment, or other advice.
Seek independent professional consultation in the form of legal, financial, and fiscal advice before making any investment decisions.
Always perform your own due diligence.
This is the fundamental problem:
SEE PAGE 59 - THE PERFECTSTORM : The economy is a surplus energy equation, not a monetary one, and growth in output (and in the global population) since the Industrial Revolution has resulted from the harnessing of ever-greater quantities of energy. Butt he critical relationship between energy production and the energy cost of extraction is now deteriorating so rapidly that the economy as we have known it for more than two centuries is beginning to unravel https://ftalphaville-cdn.ft.com/wp-content/uploads/2013/01/Perfect-Storm-LR.pdf
Conventional Oil Sources peaked in 2008 and the Shale binge has now spoiled US reserves, top investor warns Financial Times.
Preface. Conventional crude oil production may have already peaked in 2008 at 69.5million barrels per day (mb/d) according to Europe’s International Energy Agency (IEA 2018 p45). The U.S. Energy Information Agency shows global peak crude oil production at a later date in 2018 at 82.9mb/d (EIA 2020) because they included tight oil, oil sands, and deep-sea oil. Though it will take several years of lower oil production to be sure the peak occurred. Regardless, world production has been on a plateau since 2005.
What’s saved the world from oil decline was unconventional tight “fracked” oil, which accounted for 63% of total U.S. crude oil production in 2019 and 83% of global oil growth from 2009 to 2019. So it’s a big deal if we’ve reached the peak of fracked oil, because that is also the peak of both conventional and unconventional oil and the decline of all oil in the future.
Some key points from this Financial Times article: https://energyskeptic.com/2021/the-end-of-fracked-shale-oil/
And here is their solution to this problem https://www.headsupster.com/forumthread?shortId=220