


Aligning Stars of the Stellar Energy Wave


THE WEEK THAT IT WAS...
The last week of the second month of the year highlighted the Euro zone and Japan CPI, various US bond auctions, the US ISM Manufacturing PMI and inflation expectations from the University of Michigan
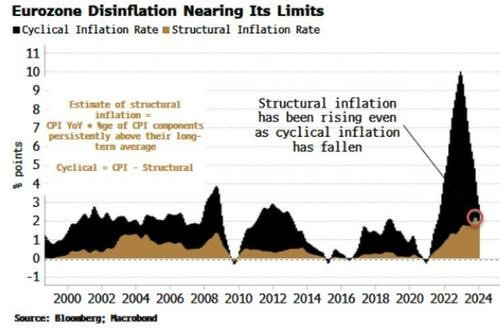
Preliminary Euro-zone inflation figures indicate that, similar to the US, the era of immaculate disinflation in the euro zone has concluded, with the headline CPI rising 2.6% year-on-year, surpassing the median estimate of +2.5%. Core inflation, excluding food and energy, also moderated less than anticipated to 3.1%.

In this cycle, while the majority of fluctuations in headline inflation are usually attributed to the cyclical component, it's notable that structural inflation has been steadily increasing, contributing significantly to the overall trend.
The January Japanese CPI confirms the trend seen in the US and elsewhere, indicating that the so-called immaculate disinflation observed in 2023 has come to an end. Core inflation (excluding fresh food) slowed to 2.0% YoY from 2.3% in December, surpassing the consensus of 1.9%. Headline CPI eased to 2.2% YoY from 2.6% in December, also exceeding the consensus forecast of 1.9%. Another gauge, excluding fresh food and energy, slowed to 3.5% YoY from 3.7% in December, above the forecast of 3.3%.

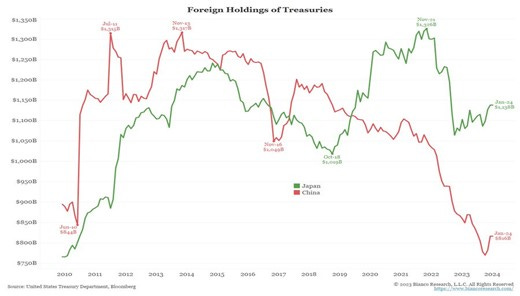
Monitoring the Japanese CPI is as important for investors as the US CPI itself, given that Japanese investors are the largest foreign buyers of US treasuries globally, surpassing even Chinese investors.
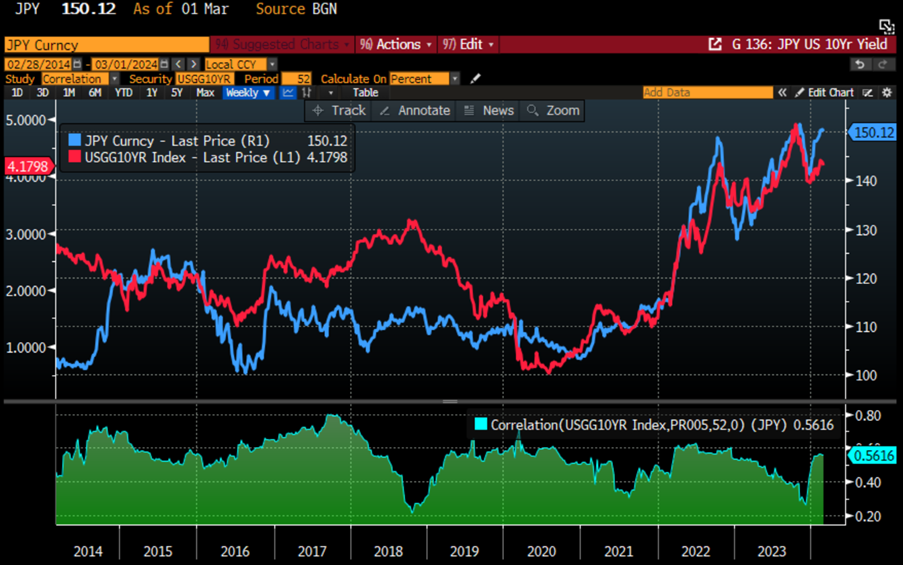
In that context, the evolution of the US 10-year yield and the return of the bear steepener will continue to partly depend on the evolution of the Yen exchange rate.
Japanese Yen USD (blue line); US 10-Year Yield (red line) & correlation.
Another factor to get the bear steepener out of its Halloween hibernation will be how the US bond auctions are digested by yield hungry investors. Last week 2-Year and 5-Year coupons, the largest in history for these tenors, were subpar at best.

After underwhelming 2-year and 5-year auctions, the 7-year auction appeared to be more successful. Unlike the 2 and 5-year auctions, which experienced tails, the 7-year auction stopped through 0.2 bps when issued. This marked the first stop through since November and followed 3 consecutive tails for that tenor.
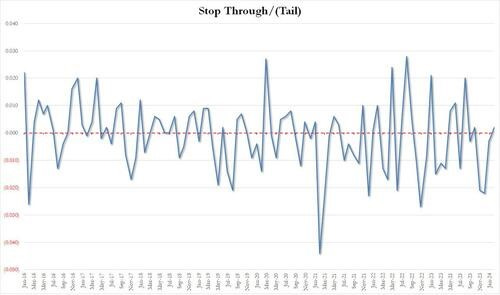
However, this was not enough to halt the awakening of the bear steepener from its "Halloween hibernation’’.
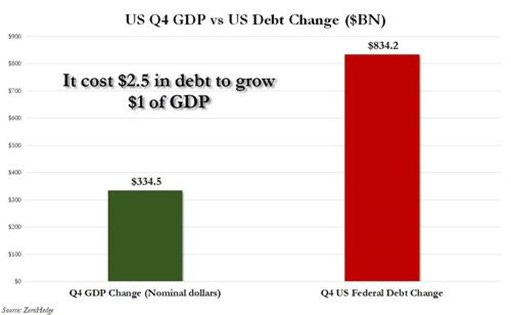
An analysis of Q4 2023 US GDP reveals that the economy expanded by approximately $334.5 million in nominal dollar terms, but this growth came at a cost of $834.2 million in additional debt for the US government, equating to $2.5 in debt for every dollar of GDP "growth". This highlights not only the US's reliance on borrowed funds but also suggests that stagflation may be imminent, rather than a recession, soon.
The US manufacturing PMI showed some improvement, accelerating from 50.7 in January to a preliminary 51.5 in February and a final 52.2. However, the ISM Manufacturing index declined from 49.1 to 47.8, below the expected 49.5. While S&P Global reported robust growth in new orders, ISM indicated contraction. Both sources agreed that selling prices increased at the fastest pace since April 2023.

January headline PCE inflation increased by 0.3%, while core inflation rose by 0.4% monthly in January, aligning with estimates that were revised upward post the hotter than expected January CPI. Year-on-year, headline PCE inflation fell to 2.4%, and core to 2.8%. FED Chair Powell's preferred "supercore" inflation gauge surged sharply to 0.6% month-on-month. The bad news is that services saw a significant increase on a month-on-month basis, and durable goods flipped from deflation. Services inflation, excluding shelter, rose to 3.45% YoY due to a large 0.6% MoM increase, the largest since December 2021. It's noteworthy that every sub-element of the SuperCore rose month-on-month.

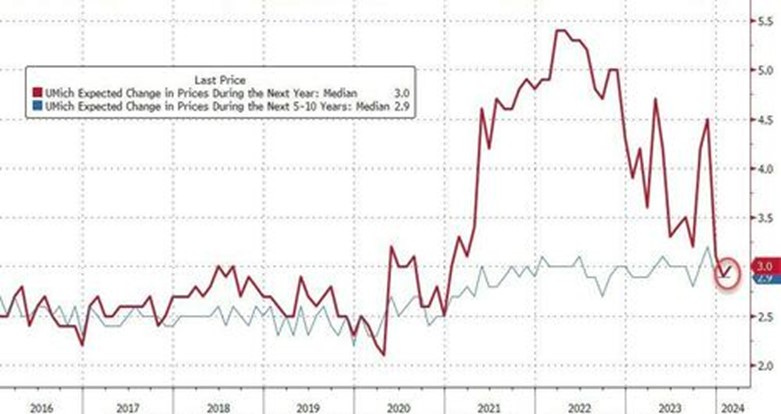
US consumer sentiment dipped in February, marking the first decline in three months, attributed to deteriorating views on both current and expected economic conditions. The sentiment index fell to 76.9 from January's 79, coming in below all estimates. The current conditions gauge dropped to 79.4, while the expectations measure declined to 75.2 compared to January. Perhaps their confidence was shattered at the onset of a loss of faith that the FED has reached ‘’Mission Accomplished’’ in fighting inflation, indicated by short-term inflation expectations ticking up to 3.0%.
In this context, expectations for rate cuts indicate that March and May are unlikely to see the FED pivot. The consensus still leans towards a 25 basis points cut in June, although it remains highly hypothetical. There are risks that the FED may revise its DOTs at the March meeting to include less than 3 cuts or none at all.
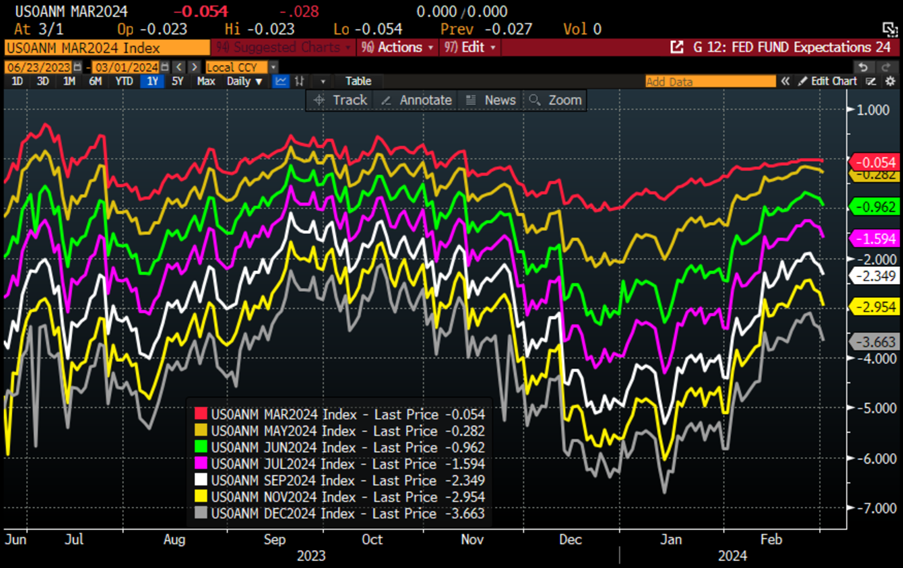
Certainly, what the consensus overlooks is that March is a "DOTs meeting", where the FED could be compelled to revise its DOTs from three cuts to one or none for 2024, or even consider a hike. This is considering that the inflation rebound has more room before the June meeting.
FED Fund Rates – US CPI YoY Change (blue line); US 10-Year Yield (red line) & Correlation.

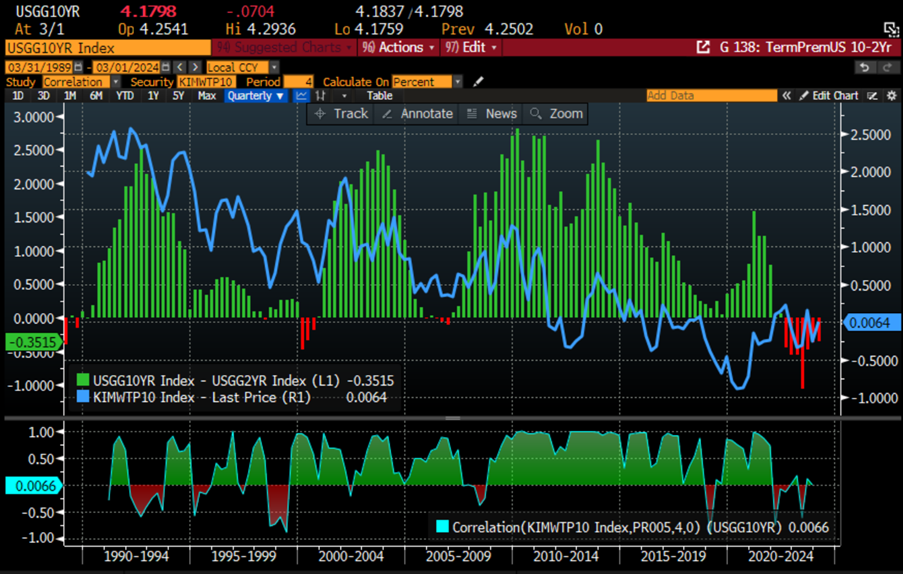
Many pundits still rely on government bond markets as reliable benchmarks, but they are increasingly biased by Central Banks and finance ministries. Economists often rewrite history to fit their theories, suggesting we "wait longer" for the impact of an inverted curve or switch allegiance from the traditional 10-2-year curve to other maturity spreads. However, the inverted 10-2-year US Treasury Yield curve, a widely flagged recession predictor, has a questionable long-term track record. The issue can be observed through depressed bond term premia.
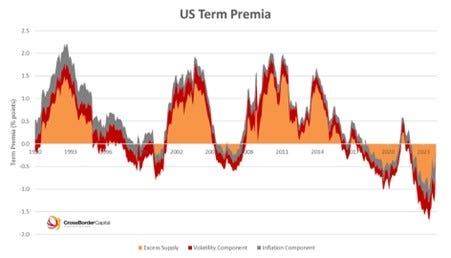
Without doubt the US yield market still faces temporary coupon shortages, suppressing yields. The overall US term premium, currently nil, includes excess supply accounting for about 110 basis points of the gap. Typically, term premia should be positive to cover duration risk. The current shortfall highlights increased fixed-income risk, with bonds vulnerable to increased supply. The prevailing US 10-year Treasury yield appears too low given prospective supply and the advancing investment cycle. Some interpret the latest inversion as predicting deflation and recession, but it could be better explained by latent yield curve control (YCC) aimed at suppressing yields.
US Term premium on 10 Year Zero Coupon (blue line); US 10-2 Year Yield (Histogram) & Correlation.
Looking at a risk-free 10-year treasury using the agency mortgage curve backed by the GSEs (Fannie Mae and Freddie Mac), the current bond market distortion resulting from the large-scale bill issuance to finance the US budget deficit suggests that 10-Year US Treasury Yields are at least 100 basis points too low. This also helps justify why bond term premia are depressed and why the yield curve is inverted, and probably why it has lately been such a poor predictor of the US economy.

On that matter, the speech delivered by Waller on Friday announcing a potential new QE ‘Reverse Twist’ for its balance sheet by buying the additional bills issued by the Treasury looks appropriate and will act as a tool to re-steepen the yield curve from the short end.
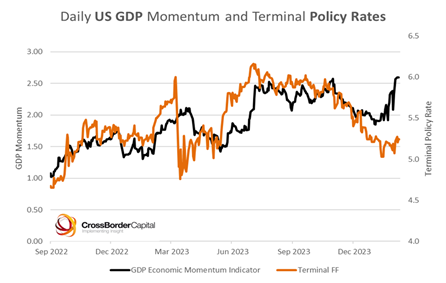
As the US economy picks up pace in its latest trampoline landing rebound and government funding shifts to its normal mix, tensions will continue to mount for US Treasuries. The agency mortgage market indicates a 10-year Treasury yield around 5%. Even without considering depressed term premia risks, accelerating business activity suggests higher terminal policy rates. A sub-5% FED funds rate would require a US recession. In a nutshell, this implies HIGHER, not LOWER, policy rates ahead.
The dual pressures on Treasury yields, higher term premia, and fewer potential cuts in policy rates, are highlighted as both of which seem to be increasing and pushing 10-year yields toward a 5.0+% target for the second half of the year. In essence, US Treasury notes and bonds may not be the ‘safe’ haven assets that textbooks claim

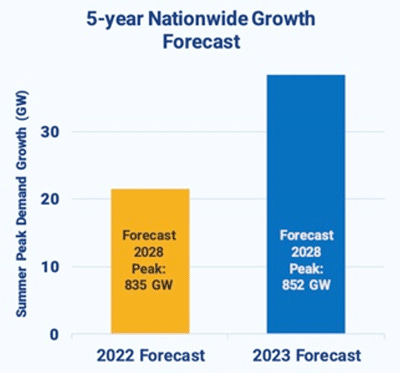
Since the start of the year, investors have been homing in on another round of the AI revolution, particularly focusing on the 'picks and shovels' of the sector, which are widely regarded as the winners of this new industrial revolution. However, an overlooked point by investors is the imminent surge in energy demand with the emergence of AI and later robotics. Within a year, the five-year growth forecast for US electricity demand has escalated from 2.6% to 4.7%, largely driven by the increased demand from artificial intelligence applications.
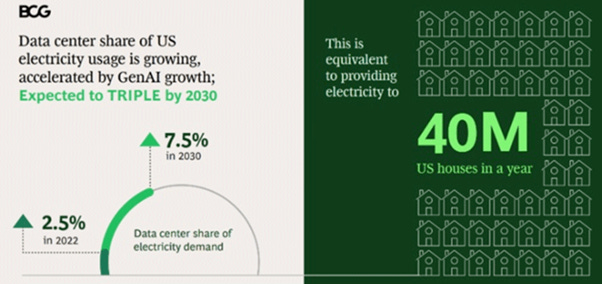
While AI is expected to enhance productivity in the long term, AI-driven technologies require substantial energy and energy infrastructure to support them. Schneider Electric, for example, projects that AI-driven power use will grow by 25%–33% annually through 2028. Much of this power consumption will occur at new data centers sprouting up around the world. The US data center construction market is anticipated to expand from $20.21 billion in 2022 to $28.56 billion by 2028. In the US, data centers’ share of electricity use is expected to triple to 7.5% by 2030, primarily due to the expansion of AI.
America's industrial and manufacturing revival, fuelled by over $900 billion in government incentives and investments, including the CHIPS Act and the Infrastructure Investment and Jobs Act, is another major driver of increased energy demand. To support this modernization, significant investment in grid infrastructure is necessary, with the IEA estimating around $680 billion per year needed by 2030 and over a trillion by 2040.

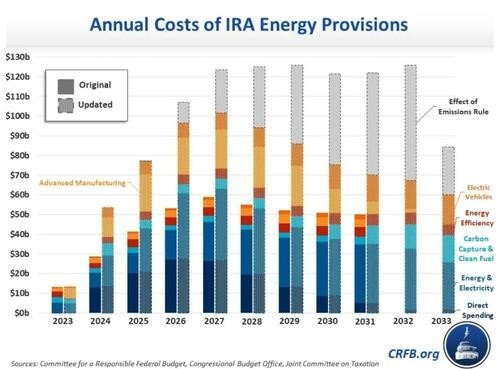
AI-driven energy and reshoring demand are not the only factor; additional regulations will also hike energy prices. Last April, the EPA proposed stricter vehicle emissions standards starting in 2027. If finalized, this rule would increase federal deficits by boosting electric vehicle tax credits and reducing gas tax revenue. The IRA's energy and climate spending and tax breaks were initially estimated at $400 billion through FY 2031 but are now projected to cost about $870 billion through 2031 due to various factors, including the emission rule, looser regulations, higher demand for green technologies, and economic changes.
Over the past 2 decades, the US shale oil industry has been the driving force behind America's economic success, transitioning the country from a net oil importer to a net exporter.
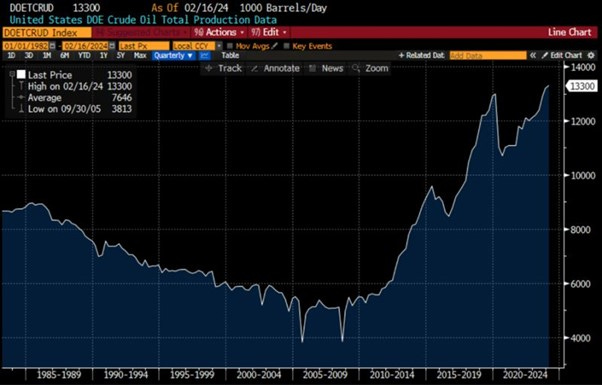
In its annual newsletter, Warren Buffet highlighted that not long ago, the US was heavily dependent on foreign oil. Pessimism prevailed for a considerable period until the US shale revolution had a transformational impact on the US economy.
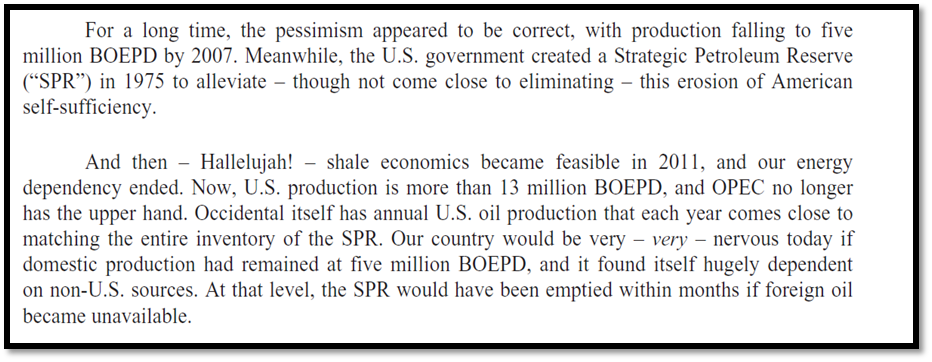
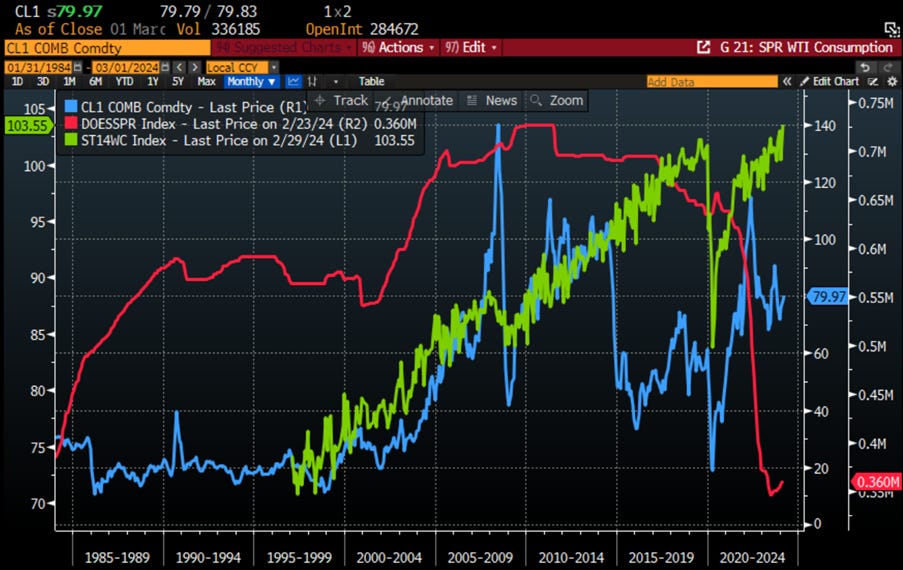
The US Shale industry has enabled the US to reduce its Strategic Petroleum Reserve as an additional supply source over the last decade, even as demand continued to rise amid a more challenging macroeconomic landscape.
WTI price (blue line); US Strategic Petroleum Reserve (red line); Global Oil Demand (green line).
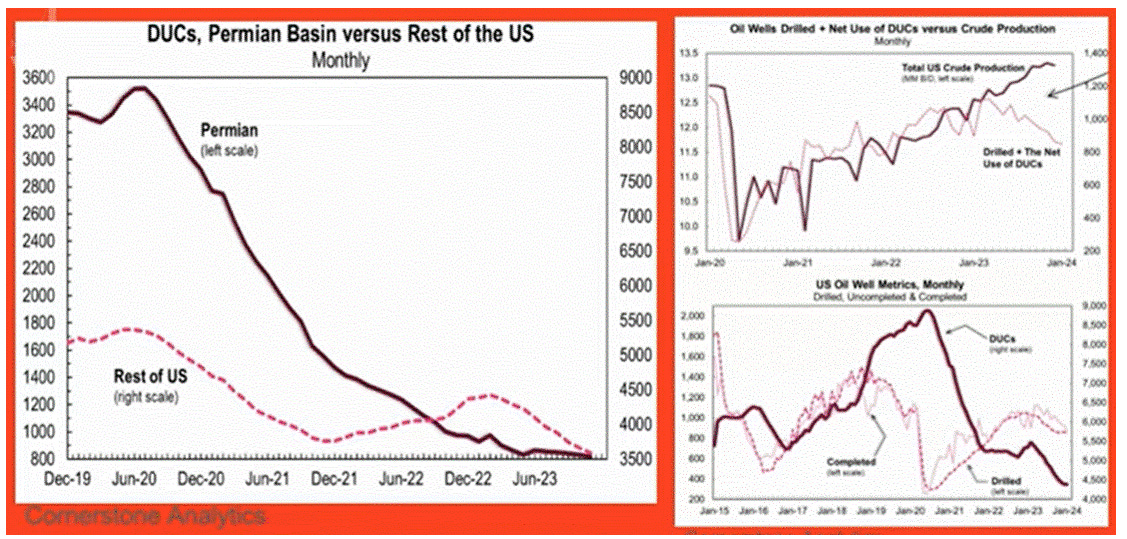
However, shale producers are encountering hurdles in expanding their operations after reducing drilling rigs last year. Oil production growth from the lower 48 states is projected to rise by 270,000 bpd this year and 330,000 bpd next year. Therefore, offsetting base declines becomes more challenging as production levels increase, requiring more production to merely maintain flat levels. This outlook coincides with shale explorers exercising greater restraint in spending.

Examining Drilled but Uncompleted Wells (DUCs), it appears evident that the outlook for shale oil supply in the coming quarters is expected to be constrained.
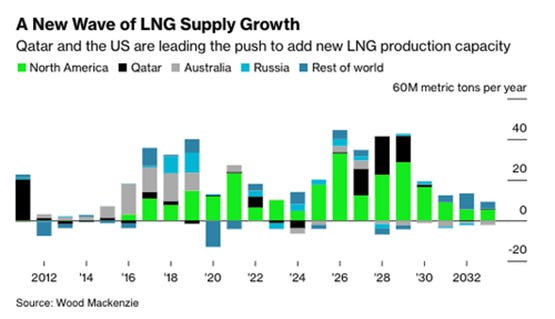
Despite the decision from the White House to halt new LNG export licenses in Texas, the third-largest LNG exporter globally, the LNG market is poised for significant growth in the coming decade.
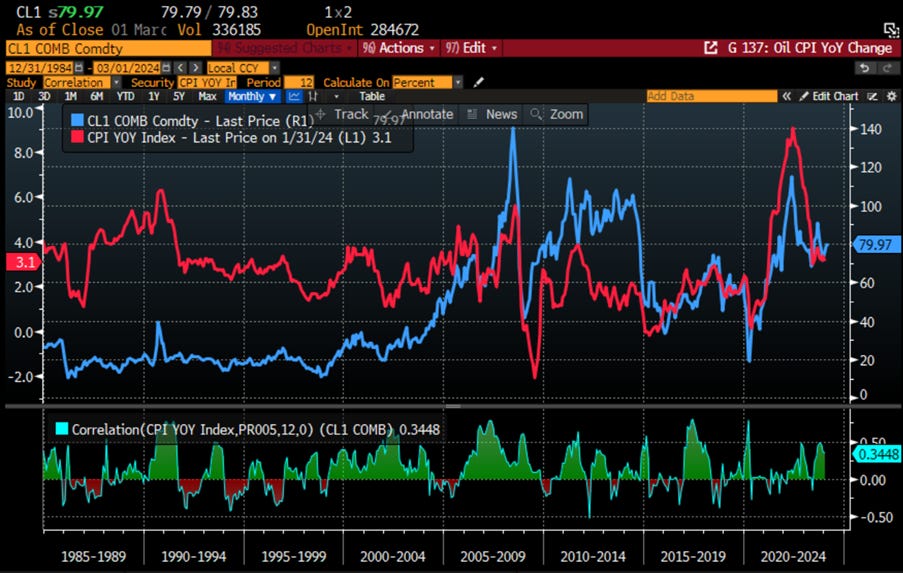
For macro investors, instead of delving into complex theories about what drives inflation and the US 10-year yield, a simple way to understand it is by observing the correlation between the oil price the US CPI YoY change.
WTI oil price (blue line); US CPI YoY change (red line) & Correlation.
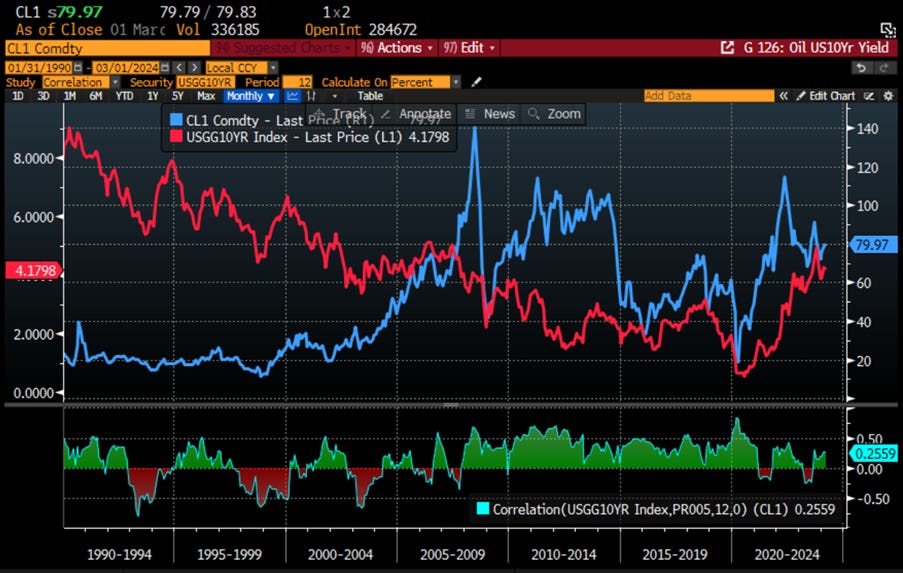
The movement of oil prices in the coming months will also significantly influence the rise of the US 10-year yield and contribute to the return of the Bear Steepener.
WTI oil price (blue line); US 10-Year Yield (red line) & Correlation.
Ultimately, readers will remember that what really matters is the relative performance of the oil price to the S&P 500 index, as the outperformance of the oil price to the S&P 500 index has been one of the best indicators of an incoming recession and rising inflation pressures. This has also been a trigger in the past for the FED to raise rates. With the recent bottoming of the WTI to S&P 500 ratio, investors should be even more convinced that not only will the FED not be able to cut rates in 2024, but the next move is more likely to be a raise than a cut.
Relative performance of WTI oil price to S&P 500 index (blue line); US Stagflation Index (red line); FED Fund Rates (green line) & Correlations.

A positive outperformance of oil against the S&P 500 has also acted as a catalyst for a restepening of the yield curve (US 10-Year Yield – US 2-Year Yield), indicating that a US recession is imminent.
Relative performance of WTI oil price to S&P 500 index (blue line); US 10-Year – US 2-Year Yield (Histogram) & US Recessions.

In a stock market dominated by the performance of the 4 Musketeers since the start of the year, the energy sector has remained unloved by investors. After a burst of outperformance in 2022 followed by a lackluster 2023, it's now off most investors' radar in 2024, despite showing signs of life. Today's main theme is instead AI; that's where everyone wants to invest, and mostly for good reason. Several large-cap energy stocks like Exxon Mobil have record-high short interest, indicating negative sentiment, though insufficient to cause a mechanical short squeeze.

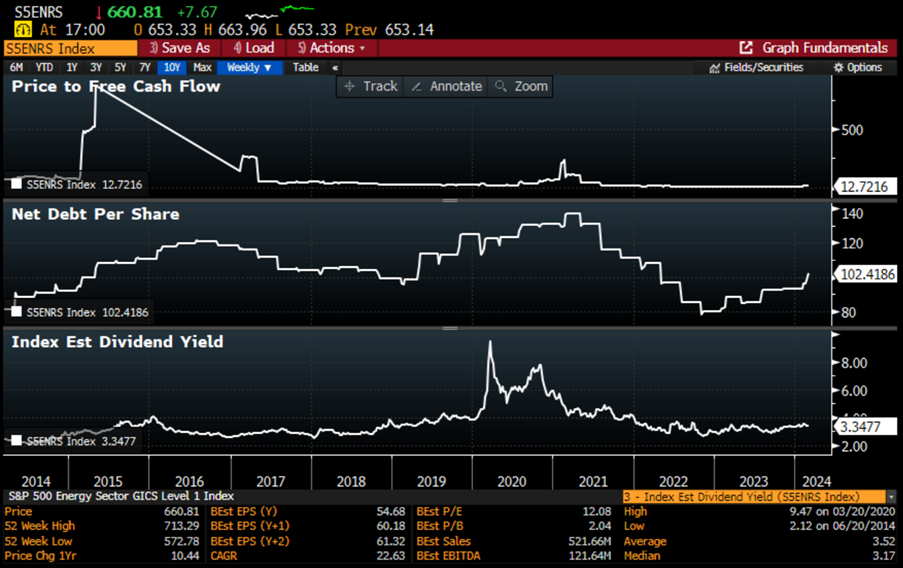
Rather than focusing on technical, which can be volatile, investors like Warren Buffett look at fundamentals, and in that regard, the energy sector appears to be in great shape. Large-cap energy producers with long-lived reserves are generally in excellent fundamental condition. Major companies such as Exxon Mobil and Chevron boast very high AA- credit ratings, indicating some of the strongest balance sheets around. They have secured low interest rates on long-duration corporate bonds and hold significant cash-equivalents with interest rates that adjust upward with FED rate hikes, positioning them opposite to the duration mismatch of a typical bank. The top-tier American energy majors can be purchased for under 13x their Free Cash Flow. They offer above-average dividend yields, safe payout ratios, and decades of consecutive annual dividend growth.
In addition to stable fundamentals, the energy sector serves as a hedge against right tail risks. While the traditional 60/40 portfolio suits many investors during periods of disinflation and growth, it performs poorly during inflationary periods. In such times, energy and commodities tend to outperform, as they mitigate right-tail risks associated with economic overheating, higher input costs, and interest rates.
When considering stock market risks, two main scenarios emerge:
1. In the left tail scenario, where the economy weakens due to Fed policies and commercial real estate issues, holding cash or dollar exposures can offer protection.
2. In the right tail scenario, ongoing fiscal deficits could fuel inflation and geopolitical tensions may disrupt supplies. Holding energy producers can hedge against these risks. Energy majors offer value and dividends while potentially benefiting from rising energy prices.
Relative performance of S&P500 Energy index relative to the S&P 500 Tech index (blue); Stagflation index (red line) and correlation.

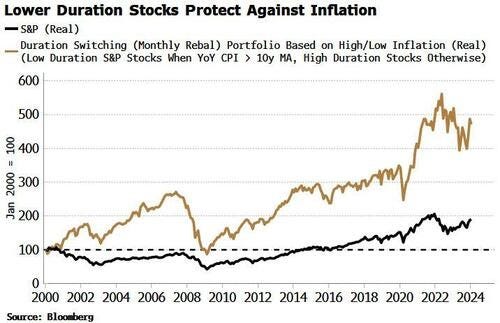
Energy stocks not only provide a hedge against the increasingly likely stagflation in the coming months but also serve as short-duration stocks, making them ideal inflation hedges. Unlike tech companies with high duration, which are vulnerable to a resurgence in price growth, energy stocks are less exposed to higher real rates due to their shorter duration. A strategy that favours low-duration stocks when US CPI is above its 10-year moving average illustrates the benefits of avoiding high-duration stocks during periods of elevated inflation.
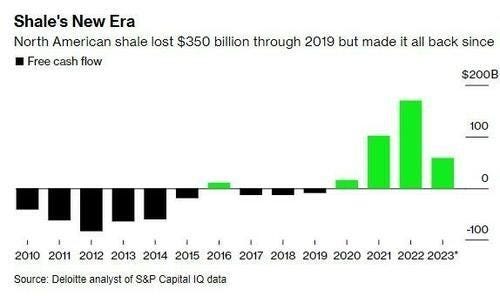
Shareholders of US energy companies will also find reassurance in the sector's transition towards generating free cash flow (FCF). Amid ongoing industry consolidation, this emphasis on FCF generation is anticipated to remain a key priority for the sector.
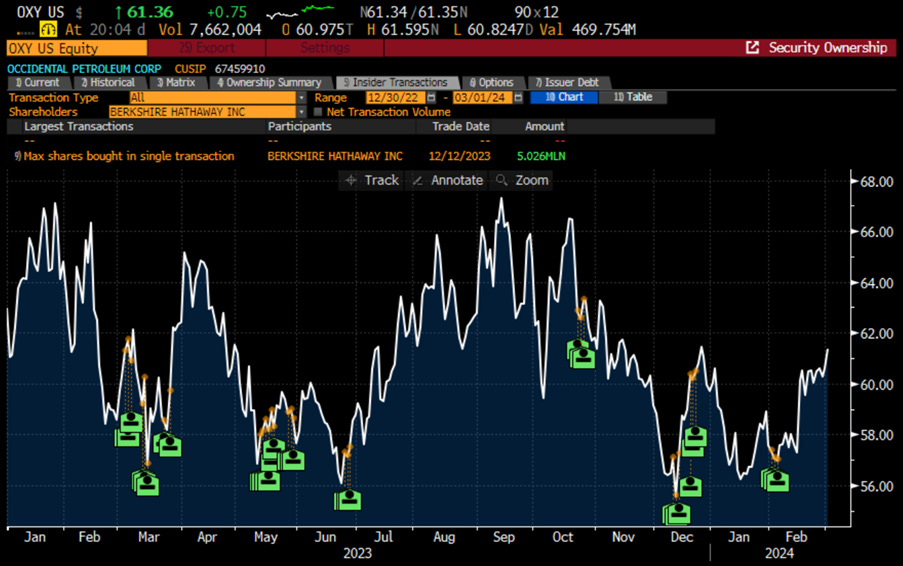
That's likely why in his latest annual newsletter, the Oracle of Omaha, renowned for his focus on cash flow generation, highlighted that Berkshire Hathaway owned 27.8% of Occidental Petroleum's common shares at the end of 2023. Additionally, Berkshire Hathaway holds warrants that grant it the option to significantly increase its ownership at a fixed price for more than five years.
Outside of the energy sector, it is feasible to construct a portfolio of stocks resilient to inflation that isn't solely reliant on duration. This portfolio would include stocks expected to perform well if inflation re-accelerates, but it wouldn't be solely dependent on that scenario. Companies with robust pricing power, a healthy net cash position on their balance sheet, and increasing free cash flow should be well-positioned to thrive, or at least weather, a stagflationary environment.
More specifically, we can screen for companies with:
over $100 billion market cap
net cash balance sheet
strong pricing power (rising operating margins YoY)
rising Free Cash Flow (YoY).

While only a few S&P 500 companies meet these criteria, it's not surprising to find among them some of the Magnificent 7 like Nvidia, Apple, META, as well as Berkshire Hathaway. These companies demonstrate strong pricing power, robust balance sheets, and increasing free cash flow, making them resilient to inflationary pressures.
Another key takeaway from the latest annual Berkshire newsletter is Warren Buffett's acknowledgment of a dearth of attractive opportunities ahead, with Berkshire's rising share price diminishing the appeal of share repurchases. Nevertheless, Berkshire remains poised to seize opportunities in the event of financial turmoil, recognizing potential bargains amid market volatility. Buffett's cautious stance serves as a reminder that challenges may arise, and Berkshire stands ready to act while others may hesitate. With a record high cash reserves of $167.6 billion, it seems that Berkshire Hathaway is getting ready for another crisis in the coming months.
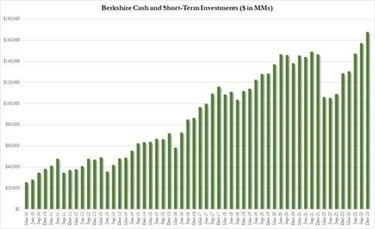
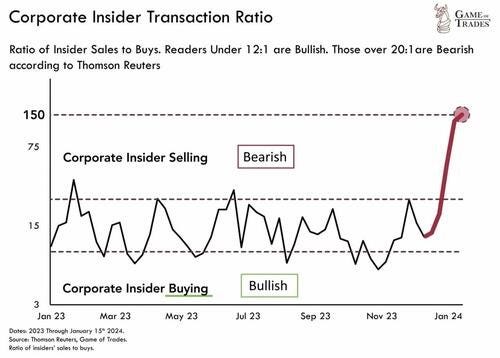
Berkshire Hathaway is not alone among high-profile investors who have expressed caution about the upcoming months. Despite the S&P 500 reaching new all-time highs in the past two weeks, notable insiders such as Mark Zuckerberg, Jeff Bezos, and even Jamie Dimon have been selling at these peaks. In fact, insiders have been offloading stocks at a rate unprecedented in years.
WHAT’S ON THE AGENDA NEXT WEEK?
The first week of the last month of the first quarter will spotlight the US job market's health with the release of the February Non-Farm Payrolls report on Friday. Additionally, the US ISM non-manufacturing data will provide insights into the outlook for the services sector. The state of the Union from President Biden as well as the testimony of Jerome Powell should be uneventful events while investors will pay attention to the congress of the Chinese Communist Party which could announce new stimulus measure to restart the Chinese economy. On the earnings front, the week will feature the final quarterly releases from US retailers including Target, Costco, and Kroger, along with tech sector companies Broadcom, Marvell Technology, and CrowdStrike concluding the earnings season.

KEY TAKEWAYS.
As we enter the epilogue of the second month of the new year, the key takeaways can be summarized as follow:
Wit the Eurozone disinflation nearing its limits, the ECB will also not be able to cut rates in 2024.
The Japanese CPI confirmed the end of immaculate disinflation and supports a BOJ rate hike by the summer.
Given the market's awareness of abundant supply, higher 10-year yields should not surprise anyone, especially as tailed auctions become the norm.
Despite divergence between the ISM and PMI manufacturing indices regarding the direction of the manufacturing sector, they both concur on one significant point: inflation pressures are reaccelerating.
The January core PCE, in line with revised estimates following the hotter January CPI, was another confirmation of the end of immaculate disinflation.
Inflation expectations serve as another indicator that the era of immaculate disinflation is behind us.
Oil is shifting from being "uninvestible" to a "must-own asset" not just due to an imbalanced supply-demand equilibrium but also as a hedge against stagflation.
In this environment, long-dated government bonds is the asset class to avoid, rather than equities.
In a stagflation, the best way for investors to protect their wealth is to own the equity barbell portfolio made of Tech and Energy.
Gold, oil, and other real assets in limited supply will replace long-dated bonds in the standard 60/40 portfolio.
As stagflation rather than recession materializes in the next few months, investors should prepare their portfolios for HIGHER volatility.
In this context, investors should remain prepared for dull inflation-adjusted returns in the foreseeable future.
HOW TO TRADE IT?
As we enter the final month of the first quarter, both the S&P 500 and the Nasdaq 100 reached new all-time highs amidst an "everything rally" spurred by Waller's late comment on Friday regarding the FED's potential unveiling of a new QE strategy dubbed 'Reverse Twist'. This approach would involves the FED purchasing short-term treasuries while offloading Agency MBS, aimed at restoring yield curve steepness from the short end. However, technical indicators like RSI suggest that the recent market rally may be vulnerable to a sharp downturn in the near future, as the strength of these indicators has not confirmed the new all-time high.

Against this backdrop, growth sectors such as IT and consumer discretionary maintained their leadership in the market's upward trajectory, while Energy reaped the rewards of a consistent uptrend in WTI prices over the past week.

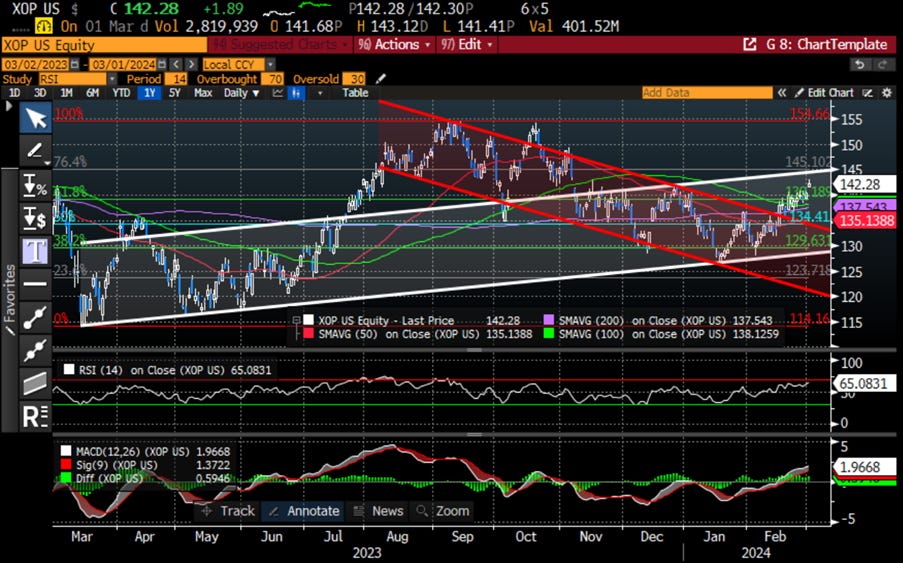
Those investors who would like to have an exposure to the US Oil & Gas exploration and production sector can look at the SPDR S&P Oil and Gas E&P ETF (XOP US) which provide exposure the oil and gas exploration and production segment of the S&P TMI, which comprises the following sub-industries: Integrated Oil & Gas, Oil & Gas Exploration & Production, and Oil & Gas Refining & Marketing.

The 50 days MA (USD135.13) will provide an attractive support for investors to start to get exposure to the sector.
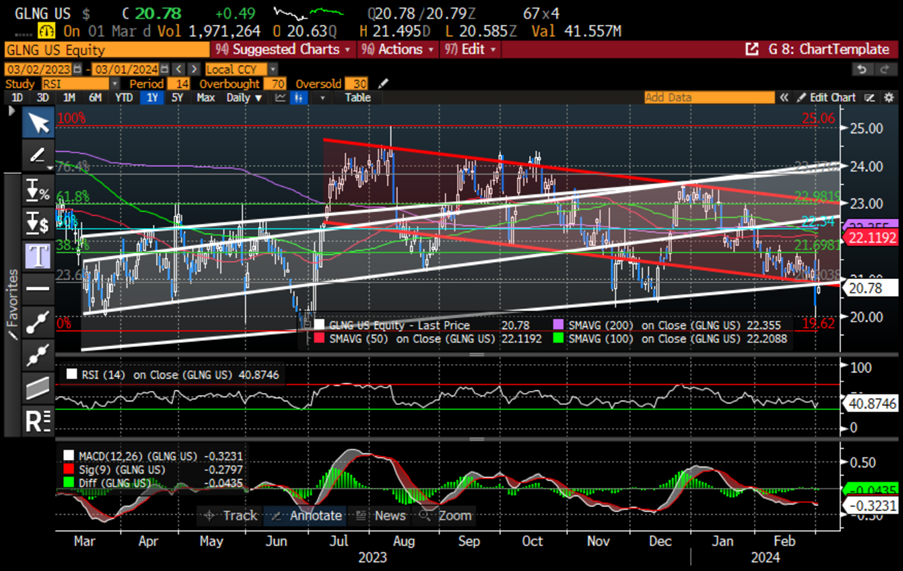
A proxy trade to get exposure to the structural growth in the global LNG market is to look at Golar LNG (GLNG US). Golar LNG owns and operates marine LNG infrastructure. The company had developed Floating LNG liquefaction terminal and Floating Storage and Regasification Unit projects based on the conversion of existing LNG carriers.
The company has deleveraged its balance sheet since 2019 and with the prospect of improving FCF should be able to benefit from the opportunities which will arise in the coming years in the LNG seaborne market.
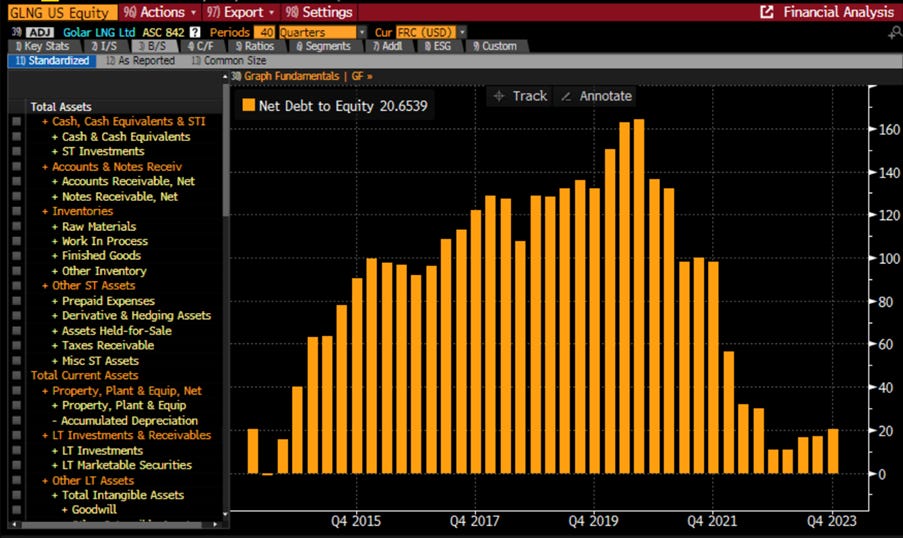
Investors with a higher risk appetite may find the support level at USD20 to be an enticing entry point for a potentially attractive yet volatile trading opportunity.
At The Macro Butler, our mission is to leverage our macro views to provide actionable and investable recommendations to all types of investors. In this regard, we offer two types of portfolios to our paid clients.
The Macro Butler Long/Short Portfolio is a dynamic and trading portfolio designed to invest in individual securities, aligning with our strategic and tactical investment recommendations.
The Macro Butler Strategic Portfolio consists of 20 ETFs (long only) and serves as the foundation for a multi-asset portfolio that reflects our long-term macro views.
Investors interested in obtaining more information about the Macro Butler Long/Short and Strategic portfolios can contact us at info@themacrobutler.com.
Unlock Your Financial Success with the Macro Butler!

Disclaimer
The content provided in this newsletter is for general information purposes only. No information, materials, services, and other content provided in this post constitute solicitation, recommendation, endorsement or any financial, investment, or other advice.
Seek independent professional consultation in the form of legal, financial, and fiscal advice before making any investment decisions.
Always perform your own due diligence.