THE WEEK THAT IT WAS...
The first week of the last month of the second quarter was all about PMI data in China and the US, central bank meetings in Canada and Europe, as well as another Non-Farm Payroll report in the US.
In China, the rebound in the Caixin manufacturing PMI from 51.4 to 51.7, above consensus estimates of 51.6, masked the reality of another round of weakening demand in the manufacturing sector as expressed by the official PMI. This rebound was mostly driven by seasonal adjustment distortions typically seen in May.
As widely anticipated, the ECB followed the Bank of Canada and cut its rates by 25bps to 3.75% for the Deposit Facility Rate, 4.25% for the Main Refinancing Rate, and 4.50% for the Marginal Facility Rate. In its statement, the ECB cited an improved inflation outlook and weakened price pressures as reasons for easing monetary policy after holding rates steady for 9 months. Since the September 2023 meeting, inflation has dropped by over 2.5 percentage points, and expectations have declined across all horizons. However, the ECB noted that domestic price pressures remain strong, with elevated wage growth and inflation likely to stay above target into next year. The latest projections show headline inflation averaging 2.5% in 2024,2.2% in 2025, and 1.9% in 2026, while core inflation is expected to average 2.8% in 2024, 2.2% in 2025, and 2.0% in 2026. Economic growth is projected to rise to 0.9% in 2024, 1.4% in 2025, and 1.6% in 2026. Translated into layman’s terms, the politically driven ECB has decided to give up on its 2.0% inflation target as the continent heads into an inevitable debt trap that will jeopardize the survival of the European banking system.
In the US, following a disappointing set of macroeconomic data in May, the final print of the ISM Manufacturing PMI dropped from 49.2 to 48.7, below expectations of a slight rise to 49.6. The ISM survey indicated new orders declining at their fastest rate since December 2023 and Prices Paid slightly down but still well above levels seen in the last 18 months. However, cost pressures continued to build as commodity prices rebounded over the past months.
The May ISM Services Index surpassed all Wall Street expectations, jumping from 49.4 in April to 53.8, the highest since August 2023. Notably, ISM Service New Orders rose to 54.1 from 52.2, in contrast to the Manufacturing ISM print, where New Orders fell to 45.4. This widened the spread between the two New Orders series to 8.7, the largest since last October. Additionally, the Prices Paid index decreased from 59.2 to 58.1, below the expected 59.0, indicating less latent inflation, while the Employment index, though still contractionary, improved from 45.9 to 47.1.
The May Non-Farm Payroll report added to the ‘Forward Confusion’ narrative as the headline nonfarm payrolls increased by 272k in May, versus a downwardly revised 165k in April, higher than the consensus estimate of 180k. The two-month net revision was -15k. The strength in hiring was concentrated in less cyclical industries like healthcare and government related jobs.
It wasn't just the jobs that came in red hot: wages did too. In May, average hourly earnings increased by 14 cents, or 0.4%, to $34.91, double the April increase of 0.2% and higher than the 0.3% estimate.
While the non-farm payroll report appears steady, it wasn't all positive. The unemployment rate unexpectedly rose to 4.0% from 3.9%, despite expectations of an unchanged figure. Additionally, after nearly recovering all COVID-related losses, the participation rate unexpectedly dropped back to 62.5% from 62.7%.
In this context, as investors await the new dot plots from the FED for the rest of the year, it is highly likely that the FED will remain uncomfortable calling its pivot date. Therefore, investors should be ready to see the FED lowering economic growth expectations and raising inflation expectations, leading Jerome Powell to remove the two cuts expected in the March dots for 2024 and anticipating even fewer cuts for 2025 and beyond as the stagflationary state of the economy will need the FED to hike not to cut after the US presidential election once the political masks will have disappeared.
At the end of the day, the most likely outcome is that the FED will have to raise not cut rates after the November elections even if a myopically driven Wall Street is still calling for a rate cut in September with 53% probability.
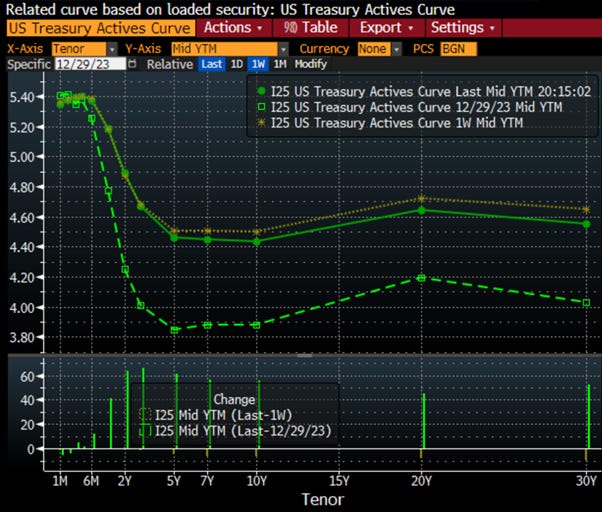
For the bond market, this would mean that the yield curve would un-invert at the long end as the bear steepener, driven by bond vigilantes, exits its renwed hibernation.
As we head into another CPI report, which will be released on the same day as the next FOMC meeting, it is a good time to take a step back and look at where the US economy is heading in terms of inflation and economic growth.
Most investors have a very hard time understanding the concept of inflation and often mistake stagflation for deflation, wondering why people are spending more on less. They only see prices of their daily grocery spending, not disposable income, and certainly not economic growth and unemployment. Looking back at the 1970s, prices rose sharply following the OPEC oil price hikes, but the sharp rise in energy costs crowded out other forms of spending. This resulted in rising prices that had nothing to do with a speculative economic expansion but rather a deflationary contraction. This phenomenon, called stagflation, occurred with rising prices and declining economic growth.
On the campaign trail, Biden said that he will press corporations to raise wages and lower prices. It's a great plan in theory, but as always, it means absolutely nothing and illustrates that he has nothing to offer. Biden revealed his position that the government is never the problem. If you want to raise net disposable income, lower taxes! Raising wages, as he argues corporations should do, will push people into higher tax brackets, and soon, all the benefits will be countered by these socialistic programs. As always, nobody in government ever talks about reducing the size of government waste and corruption.
Deflation is not merely the lowering of prices; it is the reduction of economic activity that can also include stagflation, which occurs when prices rise but there is no economic growth. Stagflation is different from deflation, where the price of goods and services does decline. For example, prior to World War II, the US experienced a massive deflationary environment where GDP fell 30% between the crash of 1929 and 1933. A quarter of Americans were unemployed. Prices plummeted, and consumers were not spending because they had very little, if anything, to spend. Panics erupted, and people hoarded; the Second World War brought America out of that economic downfall. During periods of stagflation, the prices of goods and services increase while buying power decreases. Consumers end up spending more on less. As we are seeing now, retail sales on items such as clothing have declined, but people are spending more on gas and groceries. People feel as if they are earning less despite earning more because their buying power has been drastically reduced. Companies will suffer as consumers spend less, leading to workforce reductions. For example, during the OPEC crisis of the 1970s, unemployment rose to 7.2% by 1980. Inflation went from around 1% in 1964 to 14% in 1980, and GDP growth dropped from 5.8% to -0.3% during that same period. So, be very careful. As a consumer, if you only look at rising prices and ignore the fact that your disposable income is declining, you will be in for a very rude awakening.
US Average Hourly Earnings YoY change & US Recessions.
Digging deeper into the 'stag' side of the equation, over the past 70 years, every time the US unemployment rate has been above its 24-month moving average, the US has fallen into a recession within the next 12 months. Since the US unemployment rate has been above its 24-month moving average since last June, a recession could easily materialize by the second half of the year.
US Unemployment Rate (blue line); US Unemployment Rate 24-months moving average (green line) & US Recessions.
One of the best indicators of a consumer-led recession can be found in the evolution of credit card delinquencies. With credit card delinquencies now exceeding pre-pandemic levels, the FED believes that this suggests ‘that a trend which began prior to the pandemic has accelerated.’
Credit card delinquencies (missing a payment by over 30 days) have been steadily rising across America. The poorest Americans experienced the hardship first, and now those in higher tax brackets are also falling behind on bills. Delinquencies have increased for the last eight to eleven quarters. Among the poorest zip codes in the US, delinquencies rose from 11% in Q2 of 2021 to 17.4% in Q1 of 2024, a 58% increase. The richest zip codes have not been spared with delinquencies at the highest since 2011. Every region in America has experienced an increase in delinquencies by at least 32.2% in relative terms.
In this environment, discontent will grow as everyone outside the plutocrats in power stretch their dollars and watch their quality-of-life decline as they can buy less for more. This discontent is fuelling political upheaval, and since people cannot vote their way out of the current situation due to increasingly apparent rigged elections, the next step will likely be social unrest, which will further constrain supply and fuel inflation.
Moving to the ‘-flation’ side of the equation, commodities have seen a sharp rebound over the past few months, which will contribute to the return of the inflation boomerang, as goods inflation has been the source of the supposed immaculate disinflation over the past 12 months. Indeed, the last CPI inflation print below 3% was in March 2021, more than three years ago. However, the CPI is barely connected to real inflation and dramatically understates the actual increase in the cost of living over the last couple of years. Investors must understand that the US economy is in a cycle where inflation will be higher on average, and we will see periods where inflation surges, as it did in 2022. The US is likely entering a prolonged period of stagflation. This remains one of the key reasons why investors should avoid exposure to long-dated bonds and focus on commodities, particularly physical gold, as the antifragile asset of their portfolios.
The first reasons the US and the Western world are experiencing stickier and longer-lasting inflation is that the Covid pandemic and unstable geopolitical environment have pushed companies to exert closer geographical control over their operations. Western governments have embraced this trend by pushing companies to be proactive in reshoring and friendshoring their activities. In the US, several factors have converged to create a favorable backdrop for companies benefiting from the onshoring trend. These factors include US industrial policy, global events such as Covid, supply chain disruptions, shipping disruptions, and geopolitical events. Among US companies, onshoring or ‘reshoring’ investment has been particularly concentrated in the semiconductor and technology sectors for the time being but other industries are following this trend. These significant supply chain moves come at a price, raising the cost of goods sold and lowering margins.
ISM Manufacturing Prices Paid Index & US Recessions.
A second reason contributing to the return of the inflation boomerang is the rebound in commodity prices, mostly driven by supply constraints related to geopolitical unrest across the world and tighter ESG-related regulations, which are constraining capital expenditures in the commodity sectors.
Bloomberg Commodity Index (blue line); US CPI YoY change (red line) & correlation.
Few commodities wield as much influence in the intricate web of global economics as crude oil. Oil is pivotal in driving economic growth and development as the primary energy source for transportation, manufacturing, and countless other sectors. However, beneath its surface lies a hidden truth: oil can act as a tax on growth, imposing significant costs on economies worldwide.
Oil prices have a profound impact on virtually every aspect of the economy since GDP is at the end of the day transformed energy:
Cost of Production: Industries reliant on oil as a primary input, such as transportation, manufacturing, and agriculture, are directly influenced by fluctuations in oil prices. Higher oil prices translate into increased business expenses, squeezing profit margins and potentially leading to higher prices for goods and services.
Consumer Spending: Rising oil prices can have a ripple effect on consumer spending patterns. As the cost of gasoline and other energy-related products increases, consumers may cut back on discretionary purchases or reallocate their budgets to cover higher fuel expenses, dampening overall consumption and economic growth.
Inflationary Pressures: Oil prices significantly impact inflationary pressures within an economy. As production costs rise, businesses may pass on these higher costs to consumers through higher prices, contributing to inflationary pressures and eroding purchasing power.
Macroeconomic Stability: Fluctuations in oil prices can disrupt macroeconomic stability, leading to volatility in financial markets, exchange rates, and interest rates. Oil-exporting countries may experience windfall profits during periods of high oil prices, while oil-importing nations face trade imbalances, budget deficits, and currency depreciation.
Essentially, a high oil price acts as a tax on growth via its impact on economic activity, as businesses and consumers bear the financial costs, achieving the same level of GDP, but at a higher cost. This is a familiar concept. However, for the US, the dynamics of oil have been evolving over the years. The most significant change has been the shale revolution in the US. Since 2005, US oil production has boomed due to fracking, resulting in the US becoming a net oil exporter and achieving energy independence. This shift in the global oil market has had profound implications for geopolitics, energy security, and economic dynamics worldwide.
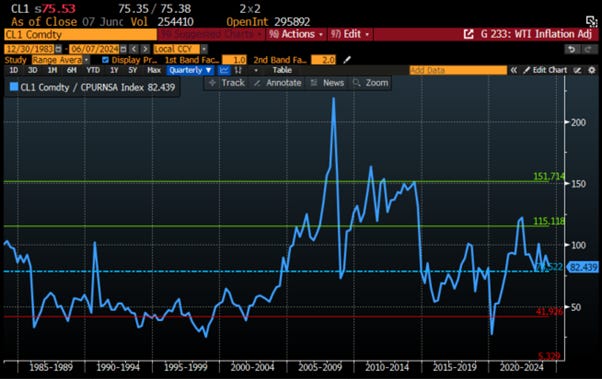
A key question for investors is whether oil is expensive or cheap at its current level. Examining inflation-adjusted oil prices in the US reveals that prices are currently around the long-run average. Prices could double from current levels before significantly impacting the US economy. The moderate price of oil undoubtedly contributes to the resilience of the US economy over the past few years. However, this situation highlights an interesting dynamic: oil is priced in US dollars, making countries other than the US vulnerable to fluctuations in the dollar-denominated oil price.
WTI inflation adjusted rebased at 100 as of December 31st, 1983.
Looking at the gold to oil ratio, it is even more evident that while gold is unrealistically cheap in USD terms, with the gold to oil ratio trading above 1 standard deviation above the 40-year mean, the price of oil in USD and gold terms look incredibly attractive at current levels.
Gold to Oil ratio since December 31st, 1983.
Rising oil prices will pose even greater challenges for countries that import a significant portion of their oil, such as Europe and Japan. In these countries, inflation is likely to increase more than in the US as their currencies weaken, potentially forcing their central banks to raise interest rates more significantly in a time of depressed economic growth.
WTI price in JPY (blue line) & JPY/USD FX rate (red line).
Returning to the oil and gas industry, it is undergoing a major transformation. Investment growth in oil is showing signs of eventually peaking in non-OPEC countries, while investment in liquefied natural gas (LNG) is expected to increase by more than 50% by 2029, as the global gas market is expected to grow by 50% over the next 5 years according to Goldman Sachs.
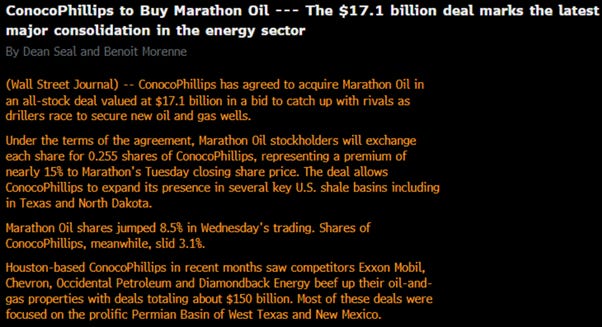
Globally, the oil industry is shifting focus to short-cycle, short-life projects as oil growth peaks, reducing long-term supplies. With global oil prices expected to remain in the $80-$90 range or even moving higher, companies aim to generate attractive returns for shareholders. As cost are rising, mergers and acquisitions are expected to persist, potentially resulting in more trans-Atlantic mergers. Consolidation in the industry is driving efficiency, improving investment quality, and enhancing returns. Companies are responding to future challenges by consolidating and exercising capital discipline, ultimately aiming for higher returns. The consolidation trend, particularly in US shale, is a key driver, and more of it may be anticipated.
Meanwhile, LNG supply is set to rise by 80% by 2030, driven by new projects in North America and Qatar. This will come at a time when rising demand needed for powering AI will need to be met sooner rather than later.
The US is poised to maintain its position as the world's leading LNG exporter, doubling energy capacity by the decade's end. This expansion in LNG supply is expected to alleviate global energy crises, particularly in Europe and Asia. With shale gas driving significant growth, the US is set to become the primary source of LNG to Europe. Additionally, the anticipated increase in LNG capacity by 2027 may reshape natural gas supply dynamics in North America. However, the affordability of natural gas, which has persisted for much of the past decade, may shift in the coming years, potentially leading to inflationary pressures.
For macro investors, the oil price is an important driver of the trend in the CPI. Indeed, there has historically been a strong correlation between the oil price and the year-over-year change in CPI over the past 40 years. This means that if the oil price is on the verge of a sharp rebound, investors should get ready to see a HIGHER CPI print for the foreseeable future.
WTI price (blue line); US CPI YoY Change (red line) & correlation.
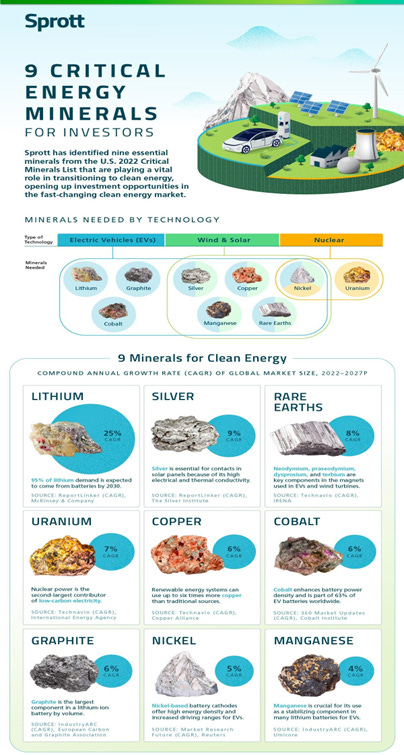
It is not only oil prices that have rebounded recently. Metal prices have been on a tear, and this has not been driven by just gold and silver but also copper that is expected to be turned into gold by the AI revolution. The supply side for silver and copper also looks very favourable for long-term bulls, and central banks have spent the last year buying gold in large quantities. Platinum and palladium are showing signs of life, and unless you believe we will all be driving EVs by 2030, it will be hard for supply to meet demand for catalytic converters moving forward. Other metals like Nickel; Cobalt and Manganese are critical to reducing energy-related emissions and also used in the aerospace sector have started to rebound.
Some of the recent moves for these metals are just the beginning, as supply constraints and rising demand will need to be met with higher prices in a time of escalating geopolitical tensions.
Bloomberg Industrial Metal index (blue line); US CPI YoY change (red line)& correlation.
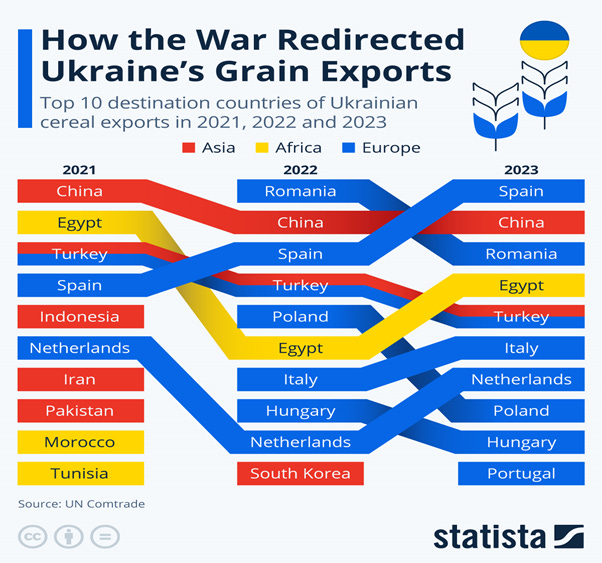
Agricultural commodities have also seen recent increases in prices. Besides weather-related disruptions from El-Nino, geopolitics have played a crucial role in affecting supply and prices. Russia's invasion of Ukraine and the temporary blockage of its Black Sea ports redirected grain flow from one of the world's major producers. Ukraine, known for wheat, corn, and vegetable oils, faced interruptions in its grain exports, causing global food commodity prices to soar. After UN-brokered negotiations, Ukrainian grain exports resumed via the Black Sea route under the Black Sea Grain Initiative. Despite Russia's refusal to renew the grain deal in July 2023, Ukraine and its partners found alternative ways to maintain grain exports, with much of it heading to Europe. Consequently, Romania, Poland, and Hungary saw significant increases in grain imports, while other countries like Turkey and Indonesia sought alternative suppliers due to the war.
While the rally in agricultural commodities is just in its infancy, this will add to the inflationary pressure of an economy that is already suffering from persistently high inflation.
Bloomberg Agriculture index (blue line); US CPI YoY change (red line)& correlation.
If stagflation is an environment where inflation and the unemployment rate are high simultaneously, while the GDP growth rate is low, a Stagflation proxy index can be constructed by adding the US unemployment and CPI rates and subtracting GDP growth. Although this proxy indicator is currently well below the levels reached in the 1970s and early 1980s, the recent trend should bring investors' attention to the fact that, contrary to the 'Forward Confusion' spread by the FED and the US government, it is time to anticipate an inflationary bust and position portfolios accordingly.
Stagflation Proxy Index & US Recessions.
The problem for most investors is that anyone under the age of 60 has no real acquaintance with stagflation, as the last time the US experienced such an economic scenario was between 1977 and 1981.This period was marked by high volatility for equities. Those who ignored hard assets like gold and were stuck in government bonds missed out on the real antifragile asset during a time when investors lost confidence in the government.
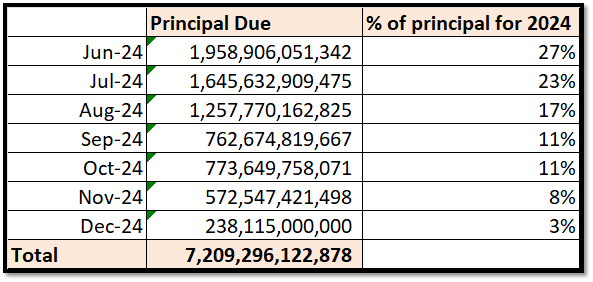
In this context, investors should be particularly worried that governments in the western world have continued to increase their debt by embracing loose fiscal policies which were one of the origins of the 1970s stagflation. On that matter, a look at the amount of debt the US will have to refinance before the end of the year should make every bond investor worried that HIGHER NOT LOWER INTEREST RATES will last for much longer than what Wall Street has been advocating over the past 18 months. Indeed, the US government will have to refinance more than USD7.2 trillion before the end of 2024. This means that the recent dull bond auctions we have seen over the past few weeks are likely to become the norm rather than the exception.
Over the next 30 years, the US government will need to refinance more than $27 trillion. This is certainly not something that any current presidential election candidates will discuss during their campaign, given their age.
For investors who remain unconvinced that the current problems are largely due to the actions of the US government since the Covid pandemic, it is noteworthy that now half of the 30 companies in the Dow Jones index are perceived as less risky to default than the US government itself.
US Treasuries have not waited for the upcoming inflationary bust to become a 'return-less' asset class. In fact, investors must understand that over the past 20 years, on an inflation-adjusted basis, US Treasuries have delivered a negative return, while gold has risen more than threefold over the same period.
Bloomberg US Treasury Index (blue line); Gold price in USD (red line) inflation adjusted and rebased at 100 as of December 31st, 2023.
Not only have US Treasuries significantly underperformed equities over the same period, but the correlation between the two asset classes has also increased significantly since the COVID pandemic.
Bloomberg US Treasury Index (blue line); S&P 500 Index (red line) rebased at 100 as of December 31st, 2023, and correlation.
Therefore, it seems that US Treasuries have become a useless ‘return-less asset’ in a diversified portfolio, given the rising correlation between Treasuries and Equities. Given rising risk of default from the governments, investors who are seeking income will have to switch out of traditional US Treasuries, including T-bills, which were once a upon a time seen as the risk-free asset but are no longer free of risks. The alternative is to hold a diversified portfolio of investment-grade short-duration (not more than 12 months) USD corporate bonds, which should be the preferred way for investors to manage their cash allocation.
In the meantime, investors have continued to pile into long dated bonds ETF such as TLT, with huge inflows for most of the past 24 months. Indeed, for decades, these investors have been trained to buy the dip and thinking that the bond side of the 60/40 portfolio will save them when the stocks are underperforming.
iShares 20+ Year Treasury Bond ETF (TLT US) (blue line) & Shares outstanding.
The problem with that idea is that stocks and bonds become correlated when inflation is running hot, something we saw in 2022, the worst year for the 60/40 portfolio since 1937. The last asset you want to own during an inflationary cycle is long dated bonds, especially with the US government’s current financial situation doesn’t exactly instil confidence that they are going to get spending under control.
Stagflation Proxy Index (blue histogram); S&P 500 index (red line); Bloomberg US Treasury Index (green line) and correlation between S&P 500 index and Bloomberg US Treasury Index (lower panel).
In this context, income investors will need to consider short-dated (not more than a 12-month maturity) investment-grade USD bonds issued by US corporations as a way to manage their cash. By the end of this economic cycle, investors who are still blurred by the Wall Street ‘Forward Confusion’ narrative, will probably realise that TLT was the toilet paper ETF which was the asset NOT to own.
TLT investors at work.
A safer alternative would be to own a significant portion of their portfolio in physical gold, as its price rises when confidence in the government declines; owning gold serves as a hedge against government risks. Owning a stock or a corporate bond represent a similar trade. When a company goes bankrupt, bondholders typically recover some value from the company's assets. However, when a government defaults, bondholders receive nothing.
US CDS 5-Year Spread (blue line); Gold price (red line) & correlation.
In a nutshell, investors have to understand that the antifragile asset for their portfolio is physical gold, as it is non-confiscatable and has no counterparty risks.
US Stagflation proxy index (blue histogram); Relative performance of Physical Gold to Bloomberg US Agg Total Return index (red line) and correlation.
Inside equities, this once again brings us back to the Equity barbell portfolio made of technology and energy stocks which have proved to be the best way to invest in equities when an inflationary bust unfolds.
US Stagflation proxy index (blue histogram); Relative performance of the Barbell Equity Portfolio to the S&P 500 index (red line) and correlation.
Aggregating the different asset classes, as all roads lead to stagflation, investors will realize that the death of the traditional 60/40 portfolio made of equities and bonds since the COVID pandemic will be even more evident. The new diversified portfolio, which remains mostly ignored by Wall Street, is the Barbell Portfolio made of 30% US tech stocks, 30% US energy stocks, and 40% physical gold. Looking back at the past 35 years, this portfolio has a strong track record of outperforming the traditional 60/40 portfolio when stagflationary pressures have been on the rise, such as since the start of the COVID pandemic.
US Stagflation proxy index (blue histogram); Relative performance of Barbell 60/40 Portfolio to Old 60/40 Portfolio (red line).
In conclusion, the US economy is heading into an inflationary bust, and it's just a matter of when and how severe it will be. Oil is going to be the main driver even if all roads are already leading to stagflation from here. This suggests that a secular bear market for bonds lies ahead and that commodities are a much more attractive asset class.
Among commodities, physical gold is the obvious choice to own, but investors who are able to stomach more volatility can allocate part of their portfolio to crude oil; metal and agricultural commodities, which will benefit from shortages driven by wars, social unrest, and tighter regulations constraining supply. Indeed, looking at prior inflationary periods, commodities and stocks are expected to outperform and see massive inflows in the coming years, with the tech and energy sectors being the best way to invest in equities, as the AI revolution will make these two sectors the best options to navigate an increasingly volatile environment for investors.
WHAT’S ON THE AGENDA NEXT WEEK?
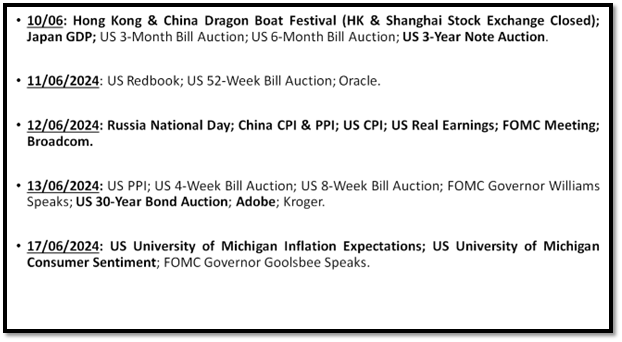
The week of the Dragon Boat Festival in China will once again be a time when investors focus on inflation data both in China and the US. On the same day that the US CPI is released, the FOMC will meet to deliver its new Dot Plots for the rest of the year. Investors will also pay close attention to the University of Michigan inflation expectations to see if consumers' inflation expectations are truly anchored, as the FED narrative suggests. Finally, Oracle, Broadcom, and Adobe will be among the last companies reporting their quarterly earnings for the quarter.
KEY TAKEWAYS.
As the northern hemisphere gets ready for the summer, here are the key takeaways:
The China PMI data confirmed that to Make China Great Again, the government and the PBOC will still need additional time as manufacturing and services activities remain fragile.
The ECB meeting signals that Lagarde, under political pressures, has decided to kiss goodbye to the 2% inflation target despite remaining ‘in charge’ of a data dependent central bank.
US ISM data pointed to more divergences between manufacturing and services with the manufacturing adding to the risks of an inflationary bust.
The US Non-farm Payroll report has added another sign pointing to an inevitable inflationary bust ahead.
On the ‘Stag-‘side of the equation, when US unemployment exceeds its 24-month average, as it has been the case since last June, a recession typically follows within 12 months.
On the '-flation' side, commodities have sharply rebounded recently, which will contribute to the return of the inflation boomerang, as goods inflation has driven the supposed immaculate disinflation over the past 12 months.
Oil, metal, and agriculture commodity prices will contribute to the return of the inflation boomerang.
US Treasuries are now not only a 'return-less' asset class but, given their high correlation with equities, have also lost their rationale for being part of a diversified portfolio.
With more than $7.0 trillion of debt to refinance before year ends, lacklustre US Treasury auctions are set to become the norm rather than the exception.
With continued decline in trust in public institutions, particularly in the Western world, investors are expected to move even more into assets with no counterparty risk which are non-confiscatable, like physical gold.
For income investors, rather than chasing long-dated government bonds, they should focus on USD investment-grade US corporate bonds with a duration not longer than 12 months to manage their cash.
In a stagflation, the best way to protect wealth is still to own the equity barbell portfolio made of Tech and Energy and Physical Gold and avoid long dated bonds.
As stagflation rather than recession materializes as the economy is increasingly weaponized, investors should prepare their portfolios for HIGHER volatility.
In this context, investors should also remain prepared for dull inflation-adjusted returns in the foreseeable future.
HOW TO TRADE IT?
June started with a week of weaker-than-expected data, highlighting that despite the ‘Forward Confusion’ narrative, all roads lead to an inflationary bust. This initially pushed the S&P 500 and Nasdaq indices to new all-time highs before they pulled back. Ahead of next week's CPI and FOMC meeting, investors will need to monitor the 50-day moving average as a key technical support, as volatility is expected to rise.
In this context, it's no surprise that last week’s performance was dominated by growth sectors such as IT, Communication Services, and Healthcare. Meanwhile, cyclical sectors like Materials, Energy, and Utilities, which outperformed the previous week, lagged behind.
Stagflation presents a particularly challenging environment for investors, as the combination of sluggish economic growth and inflation renders traditional asset allocation ineffective in delivering decent inflation and risk-adjusted returns. Lessons from the 1970s, coupled with the increasing weaponization of the economy, suggest that investors should own decentralized assets such as physical gold, which cannot be confiscated by governments tempted to change the rule of law. Every investor, small or large, should hold at least 25% of their wealth in physical gold stored outside the banking system. It should be clear by now that government bonds in the western world are kryptonite in an inflationary bust, and cash management should be done by holding a diversified portfolio of IG USD bonds of US corporations with a maturity of less than 12 months. Outside physical gold, investors can also consider other real assets to protect their wealth against the adverse effects of an inflationary bust on their standard of living. These real assets must be stored and owned in jurisdictions less likely to change the rule of law for investors. Commodities are one of these real assets. Real estate, if acquired, should be paid in cash or financed with fixed mortgage rates and located in countries where the rule of law will be preserved, even if all governments with no exception will be tempted to change the rules over time as they all struggle with the ripe effects of wars and civil unrests. Countries to avoid at all costs include western countries outside fiscal havens like Switzerland, Liechtenstein and Cayman Island. In Asia, Singapore is expected to remain one of the best places to own, settle, and custodize real assets. In the Americas, Panama and Uruguay are probably among the safest countries to own assets and look for a second citizenship for those who can afford it.
At The Macro Butler, our mission is to leverage our macro views to provide actionable and investable recommendations to all types of investors. In this regard, we offer two types of portfolios to our paid clients.
The Macro Butler Long/Short Portfolio is a dynamic and trading portfolio designed to invest in individual securities, aligning with our strategic and tactical investment recommendations.
The Macro Butler Strategic Portfolio consists of 20 ETFs (long only) and serves as the foundation for a multi-asset portfolio that reflects our long-term macro views.
Investors interested in obtaining more information about the Macro Butler Long/Short and Strategic portfolios can contact us at info@themacrobutler.com.
Unlock Your Financial Success with the Macro Butler!
Disclaimer
The content provided in this newsletter is for general information purposes only. No information, materials, services, and other content provided in this post constitute solicitation, recommendation, endorsement or any financial, investment, or other advice.
Seek independent professional consultation in the form of legal, financial, and fiscal advice before making any investment decisions.
Always perform your own due diligence.















Great article. Very comprehensive.
100% agree with stagflation. BUT! while I don’t write off the possibility that the Fed increases rates, I don’t think they will.
The reason is that the Fed mainly needs the banking system to continue to function and exist. This is even more important than getting back to 2% inflation.
AND! The Fed has direct oversight of our banking system (and money). You know how banks make money? Loans. You know what banks have a lot of? Real estate loans. If the banks can’t make money and the assets they do have are rotting in the back of the fridge (like that ignored Tupperware of tuna salad) then that is a big problem. And getting biglier by the day.
Next, the interest due on the short term treasuries which fund our government is, I have a hunch, inflationary in its own right. That is getting close to a trillion dollars of interest going back into the economy every year. What will happen to those dollars? My hunch is that they will go into the same assets you mention in your article as an inflation hedge. A positive feedback loop of higher prices. So does raising rates paradoxically increase inflation? Hmmm…?
The Fed is caught in a prison of its own making. Fight inflation with raised rates and risk the underlying functioning of the system and paradoxical continued inflation or accept structural inflation as the reality in which we exist. I lean toward the Fed folding like a cheap lawn chair like the ECB and cutting rates. Perhaps sooner rather than later (maybe?!).
Another option: the Fed vapor locks and keeps things just as they are for a long time as the Titanic continues to list to port. Perhaps they rearrange some deck chairs and make speeches. Maybe they then do something dramatic after it is too late which… yeah, that checks out.
Keep in mind ... the huge numbers of excess deaths and disabilities caused by the Covid vaccines is driving the job openings... dead and maimed people of working age... who can no longer work ... is not exactly a healthy jobs market
But because almost all analysts are unwilling to acknowledge this ... (because they fear they or their family members are next..) we get confusion on this issue...