


Bull On Thin Ice...


THE WEEK THAT IT WAS...
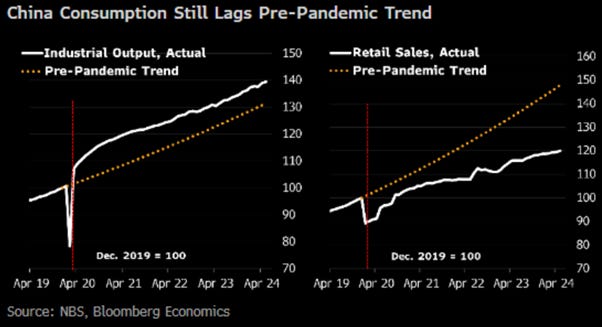
The week of Eid al-Adha and Juneteenth was all about retail sales and industrial production in China and the US, inflation data in Japan, and US flash PMI data.
In China, the latest economic data for May showed that industrial production rose 5.6% YoY, down from 6.7% in April and undershooting the consensus of a 6.2% rise. Growth in retail sales picked up to 3.7% YoY from 2.3% in April, beating the consensus forecast of 3.0%. This set of data confirmed that the recovery initiated at the start of the year is decelerating, dragged down by further weakness in real estate. However, the PBOC, increasingly seen as the Bundesbank of the Global South, continues to manage its monetary policy orthodoxically as part of the greater objective to ‘Make China Great Again.’
In Japan, the May CPI excluding fresh food rose 2.5% YoY, quickening from +2.2% in April but slightly below expectations of +2.6%. As the core inflation data signals the first signs of the return of the inflation boomerang and remains stubbornly above the BoJ’s 2.0% inflation target, investors should prepare for another interest rate hike as soon as July.

US retail sales barely rose by 0.1% MoM in May, falling short of the consensus expectation of a 0.3% MoM increase. Worse still, April's 0.0% change was revised down to a 0.2% MoM decline, resulting in the headline (nominal) retail sales print being up just 2.3% YoY. Excluding autos, the picture was grimmer with sales dropping 0.1% MoM (vs. +0.2% expected), and excluding both autos and gas stations, sales rose just 0.1% MoM (vs. +0.4% expected). The crucial control group, used in GDP calculations, also disappointed in May, and April was revised lower, marking a weak start for Q2's GDP (April -0.5%, May +0.4%). This marks the fourth consecutive monthly miss. In a nutshell, American consumers spend more on less. Yet as with every private wave, confidence declines and people begin to hoard. As people are spending money on the basics like food and energy, the demand for goods is simply not there.

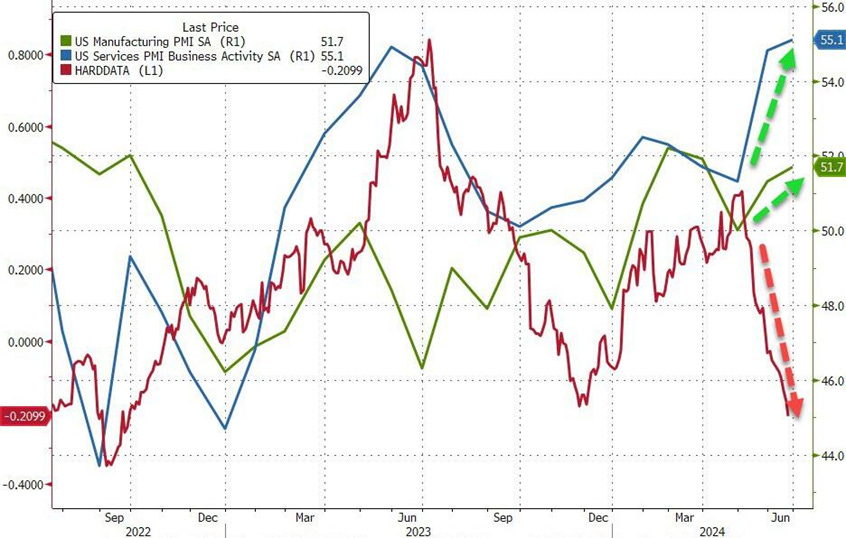
The US flash PMI surprised to the upside, with Manufacturing at 51.7 (51.3 prior, 51.0 exp) and Services at a 26-month high of 55.1 (54.8 prior, 54.0 exp). The PMI is running at a level broadly consistent with the economy growing at an annualized rate of just under 2.5%. The upturn is broad-based, as rising demand continues to filter through the economy. Although hard data showed a weakening in consumer spending, the services PMI reflected strong domestic spending.
In this context, while the FED and the Biden administration are still attempting to smooth over the data and entertain Wall Street’s myopic dreams of a FED pivot, more and more seasoned investors are understanding that this will change nothing in the end game. These investors realize that the FED is impotent to solve the economic problems created by Keynesian policies.

For the bond market, this would mean that the yield curve would un-invert at the long end as the bear steepener, driven by bond vigilantes, exits its renewed hibernation.

Over the past 24 months, there has been a lot of volatility in the macroeconomic narrative as Wall Street has been keen to spread ‘Forward Confusion’, avoiding the fact that all roads are now leading to stagflation. That said, the objective reality is that the stock market keeps making higher highs, while at the same time the technical breadth of the S&P 500 index has been deteriorating, with the number of members of the index above their 200-day MA at the lowest since last December.
S&P 500 index (candle chart); Number of S&500 members with price above 200 day Moving Average (red line) & correlation.

At the same time, there are increasing signs of exuberance among Wall Street analysts, who are expecting nearly 20% annualized EPS growth rates over the next 18 months.

As we head into the summer, which has historically been a period for starting financial crises, revolutions, and wars, investors have shown an incredibly high level of complacency. Equity and bond implied volatility have been increasingly low over the spring, while macroeconomic risks have only been rising.
ICE BofA Move Index (blue line); Chicago Board Options Exchange Volatility Index (red line) & Spread (bottom panel).

At the same time, as geopolitical risks rose in Europe, financial markets experienced something that is usually a sign that something is brewing behind the curtain: the dollar is going up, and US Treasury yields are temporarily moving down. Over the past 40 years, this kind of pattern has usually been the trigger for a tightening of financial conditions and crisis.
Chicago FED National Financial Conditions Index (blue line); US 10-Year Yield (red line); DXY Index (green line).

The last time this happened was in 2018-2019, in the pre-Covid world, when the USD started to rise. For those who remember this period, in November 2018, the governor of the RBI highlighted how USD funding had evaporated under the strains of US Quantitative Tightening and the brewing pre-pandemic recession.
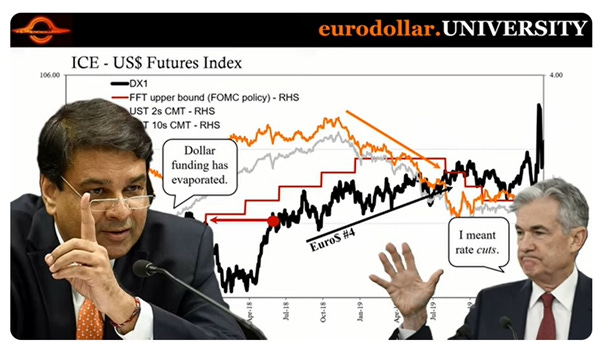
The same pattern was seen in 2015 and previously in 2008 when the USD started to skyrocket just after the notorious Bear Stearns bailout.

Given that a rising USD and lower Treasury yield have been indicators of financial troubles brewing behind the curtain, investors must understand that they live in a statistically wild world. It's akin to experiencing ‘unseasonably hot’ weather in the middle of summer, unexpected things happen all the time (unexpected if you set your expectations according to a normal distribution curve).

In Europe, the recent European Parliament elections have heightened investors' awareness that the continent has not resolved its sovereign debt issues. As people bank their votes, the risk of an escalation in the Ukraine conflict and political instability in France could precipitate a debt trap, which could inevitably impact the stability of the domestic banking system. As investor must understand, sovereign CDS is often anchored in financial risk, meaning that the European financial sector is on the verge of a crisis which will inevitably lead to a weaker EUR (i.e. even stronger USD).
Credit Default Swap of France (blue line); EUR/USD Fx rate (axis inverted; red line).

In Japan, we learned last week that the 5th largest bank, Norinchukin, a financial institution devoted to overseas investment (i.e., a massive player in the Japanese Yen carry trade), suffered massive losses on its overseas bond portfolio as it was forced into a negative carry position given the yield curve inversion in the US.
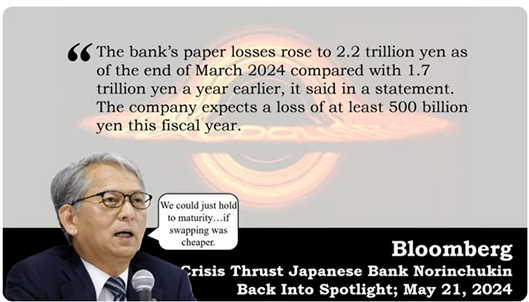
Given the prolonged inversion of the US yield curve, the carry trade on US Treasuries held by Norinchukin became negative, pushing the Japanese bank to decide to sell its long-dated US Treasuries.

Since Norinchukin has no other choice than to look for a positive carry trade, it will have probably, like most Japanese banks have done over the past 12 months, to reinvest the proceed of the sale of its US treasuries into riskier fixed income products like CLOs and other product related to the sinking Commercial Real Estate sector in the US.

Digging deeper into the recent developments around Norinchukin, we find that last December, behind the curtain of the mass media as the FED always operates, Norinchukin's New York Branch was accepted as one of the only 25 banks allowed to use the New York FED Standing Repo Facility. This likely means that the bank already knew by the end of last year that its USD financing could start to become dicey, and it needed some form of USD financing backstop.

https://www.newyorkfed.org/markets/standing-repo-facility-counterparties
For investors over 40 years old, memories may harken back to 1998 when two Nobel laureates, one-half of the "Black Scholes" options pricing equation, and leverage became infamous for spreading systemic risks across financial markets through a four-letter fund known as LTCM. LTCM made substantial bets on pricing discrepancies, engaging in arbitrage across stocks, bonds, currencies, and derivatives under the assumption that prices would eventually converge. However, when the unexpected occurred, it revealed that even the most esteemed financiers are fallible mortals rather than infallible gods. Declining market conditions exposed that these capitalists possess no supernatural abilities; rather, their reliance on risky strategies and excessive leverage drove their downfall. With LTCM's collapse, it seemed that a single hedge fund's demise could potentially drag the entire global financial system down with it.

The current dynamics in the US Treasury market do show parallels to historical infatuations with leverage and arbitrage, albeit in a different context. Leverage and arbitrage strategies are indeed factors that can influence the behaviour of the yield curve, potentially contributing to its inversion over an extended period. The prolonged inversion of the US yield curve, now exceeding 500 days, reflects a scenario where short-term interest rates surpass long-term rates. This phenomenon, historically observed before economic downturns such as in 1929, 1974, and 2008, raises questions about the role of leverage and arbitrage in today's Treasury market.

Today, the problem lies in the over-abuse of leverage in the US Treasury ‘basis trade’, which has been evident for years. However, it wasn’t until around 2015-2018 that we began to see it break down with increasing frequency. The apparent success of this trade has more to do with the expansion of FED programs like QE, QT, and BTFP, rather than the brilliance of prodigy traders. Is this ‘basis trade’ or ‘arb’ not akin to those that have repeatedly imploded? Is it resurfacing in the Treasury market? Trades like this can persist for a while, sounding promising until suddenly the music stops. An unexpected event causing premature trade closures or fails to deliver could unleash a tidal wave of repercussions across the financial system and economy. Just ask Silicon Valley Bank.
Leverage + Excessive Treasury Issuance = Manipulated Profits.
Pulling back the veil reveals that a pool of pricing discrepancies has likely allowed the yield curve to remain inverted for an unusually long period. Two of the largest players in the market, Citadel and Jane Street, facilitate many of these discrepancies in hedge fund trades across the curve. Together, they control an abnormally large portion of several markets, as noted in a recent article of the Credit Bubble Bulletin.

https://creditbubblebulletin.blogspot.com/2024/05/weekly-commentary-citadel-vs-jane-street.html
The question then becomes: how does the US Treasury ‘basis trade’ resemble LTCM? Currently, the US Treasury is issuing a massive amount of short-dated paper. Market participants short these short-term securities and buy the long end, aiming for a minuscule profit that seems viable only due to an excessively high level of leverage. This leverage has been speculated to exceed 300%.

In reality, when something 'unexpected' occurs, these leveraged trades create pockets of destabilization or systemic risk in what is supposed to be the 'safest asset'. Moral hazard is now a more significant concern than ever before. Entities like Citadel and Jane Street have grown too big to fail and operate with that assumption. The aggressive expansion of their operations, coupled with their extensive use of leverage, supports the theories of 'Terminal Phase' excess and speculative 'melt-up'. The growth of this trade can be traced through its expansion beyond hedge funds and shadow banks, now embraced by numerous small funds with billions of dollars. They engage in a low-return, leveraged strategy in what's considered the ‘safest security,’ aiming for larger returns. However, it raises questions: do all participants truly grasp the risks involved? Are they backed by competitive entities prioritizing profit, willing to extend credit regardless of the underlying security's position?
Much like the GameStop saga where ‘professionals’ play a gamma squeeze game with little understanding of the signal provided by the Greeks underneath., these trades can quickly spiral out of control. This can lead to entities folding or needing external capital injections, prompting calls for rule changes to contain systemic risks. Many smaller funds and banks mimic this ‘trade that works’ until it doesn't, until the ‘unexpected’ event exposes vulnerabilities. As history shows, every crowded trade fails at a critical moment, when the last buyer buys, or the last seller sells.

In this context, investors should ask themselves if Wall Street, in complicity with the FED and the US Treasury, has created an inversion that cannot be undone due to a large segment of the market being intoxicated by leverage exceeding several hundred percent for less than 30 basis points.
Behind the scenes, as it typically operates, the SEC announced on January 8th new FICC trading rules. These rules mandate central clearing of certain US Treasury securities secondary cash market transactions and broader clearing of repurchase and reverse repurchase transactions. The requirement for clearing cash market UST transactions will take effect on December 31, 2025, while clearing for repos will begin on June 30, 2026. This broader central clearing initiative for UST repos is expected to prompt significant restructuring of trading relationships in the market and will necessitate substantial efforts by market participants to adapt to new legal and documentation requirements in a changing clearing landscape.

https://www.debevoise.com/insights/publications/2024/01/sec-releases-final-rule-requiring
Historically, all major bubbles have been created by the ‘smartest guys in the room,’ not by ‘Joe Six Pack’, but it was ‘Joe Six Pack’ who had to pay the price for it. These ‘smartest individuals’ repeatedly disregard known risks to satisfy their gambling instincts, often causing significant problems for the global financial system. In 2018/19, similar issues led to Repo spikes and failures. We witnessed similar repercussions last year between July and October when Bill Ackman openly ‘talked his book’ to manipulate entry and exit liquidity for his bond trade. In plain English, this manoeuvre is referred to as a ‘rug pull’ or ‘exit scam’. At Wall Street, everyone moves ahead and book their profits with a smile.

This bring us back to Einstein’s definition of insanity was doing the same thing over and over again and expecting a different outcome. Banks in the US continue to lose money on commercial real estate, face heavy losses on securities portfolios as yields push higher, and are just as exposed in the aggregate to bank runs from uninsured deposits. Sanity thus demands readiness for more bank failures.

Looking at what is happening in the credit market, over the past 12 months, fixed income investors have witnessed a trend of tightening spreads. Investors are recognizing that amidst a booming US government deficit driven by unchecked spending on defence, reshoring efforts, and investments in unprofitable green energy projects, holding bonds from investment-grade corporations offering sustainable growth in earnings per share (EPS) and free cash flow (FCF) may be more beneficial than holding bonds from a plutocratic government deemed to fail.
US Corporate BAA 10-Year spread (blue line); US 10-Year Yield -US 2-Year Yield (histogram) & correlation.

This is one of the reasons why more than half of the components of the Dow Jones are now perceived as less risky than the US government itself.

To assess how much tighter credit can become, one effective tool historically used to monitor bubbles is the Maslow’s hierarchy of credit. This model has reliably captured the psychological aspects of credit risk-taking. As of Summer 2024, we have surpassed the Love/Belonging phase and entered the Esteem phase. In credit terms, this signifies increased leverage and illiquidity. Private credit epitomizes illiquidity, and accredited investors are increasingly exploring this way to incorporate leverage into transactions, drawing more participants into the structured finance arena. However, we have not yet reached the ‘Credit Genius’ phase where products like Leveraged Super Senior (LSS) and CPDO (Constant Proportion Default Obligations) dominate. Memories of the Great Financial Crisis and the European Debt Crisis remain vivid, tempering investors’ entry into this highly sophisticated space, but we are progressing in that direction.
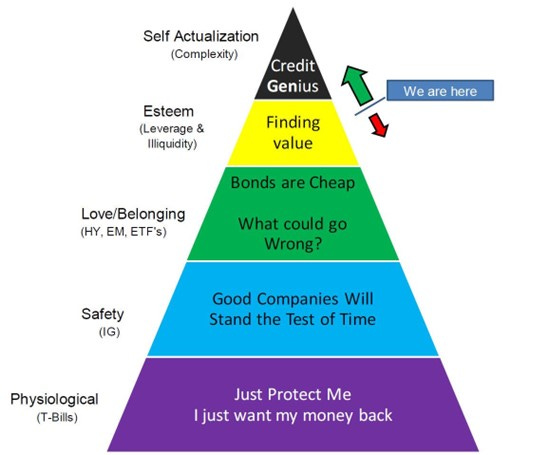
The direction to travel in the Maslow hierarchy of credit pyramid is crucial. As we ascend the pyramid, spreads tighten. Each new innovation or investor entering the asset class drives spreads tighter, creating a self-reinforcing trade where tighter spreads attract more ‘chasing,’ further tightening spreads. In June 2007, spreads reached their tightest point; CDX could be traded in billions in locked markets with spreads below 60 for Investment Grade. LCDX was highly popular despite disarray in the mortgage market and looming dividend cuts for major banks and broker-dealers. The complexity is risky, particularly when unwinding begins, but it's a journey towards potentially becoming a ‘Credit Genius.’

The perfect complement to Maslow’s Hierarchy of a Credit Bubble is the 5 Circles of Bond Investor Hell. Anyone who has traded bonds knows these circles well. As credit spreads remain tight, investors have limited options. ‘Hoping the Market Cheapens’ isn't viable after prolonged spread tightening. ‘Increasing Duration’ doesn't boost yields much with inverted curves, especially if the economy is heading into a stagflation. ‘Decreasing Credit Quality’ is restricted by mandates but becomes necessary for in need of yield. ‘Giving up Liquidity’ has been increasingly common recently, especially for investors like insurance companies constrained by tax and regulatory requirements. This solution can also lead to disaster as most investors are by then buying into something which is not where they have expertise. ‘Increasing Structure’ appeals to those willing to do the work to capture spread. Adding modelling capability can generate alpha, evolving naturally and benefiting from enhanced subordination and structural advantages from NRSROs. These circles drive movements within Maslow's hierarchy, pushing investors toward structured risk and reduced liquidity, a trend likely to persist but not advisable to follow.

In the current environment, the private credit space, which has contributed to tightening credit spreads but should be avoided due to its illiquidity, investors should prioritize the return OF capital over the return ON capital. The changes in the composition of the corporate bond markets have been the primary driver for tightening credit spreads. There are fewer issuers, and they are generally larger, reducing the likelihood of oversights. With fewer investors involved in each deal, pricing errors are less likely. Greater familiarity with credits in the market enhances accuracy. Overall, transparency in issuer information has improved significantly over the past two decades, meaning comparisons of spread charts over time should consider these changes for accuracy.
On the corporate side, the Nationally Recognized Statistical Rating Organizations (NRSROs) have been historically slow to upgrade, and this trend may have worsened, especially after the global financial crisis, where attitudes toward rating structured products shifted more than in the corporate sector. Meanwhile, corporations have become more comfortable maintaining lower ratings rather than striving for higher ones, as the spread differential doesn't justify the operational challenges of achieving a higher rating. Thus, while BBB-rated companies now constitute a larger portion of the index, the impact of this shift is debatable. From a practical standpoint, defaults remain low even among BBB-rated firms within five years, reducing concerns about investment-grade credit quality.
In finance circles, conventional wisdom suggests that credit spreads cannot compress beyond a certain ‘sovereign ceiling.’ However, the right question is to challenge this view as the U.S. government does two things:
Increases the amount of debt, seemingly endlessly.
Talks more and more cavalierly about missing a payment.
Many of the largest issuers, though US-based, operate globally and possess strong financial positions. They are governed by leaders and boards keenly aware of their fiduciary duties to bondholders.
Investors typically focus on T+X for corporate bonds, where X represents the credit spread. But what components make up this spread? It includes credit or default risk, liquidity (though less so with advancements in portfolio trading and ETFs), and other factors such as market perception. As investors contemplate the challenges in bond markets, they may find that corporate credit, even at current tight levels, could potentially tighten further, especially compared to supposedly safer sovereign issuers like the U.S. government.
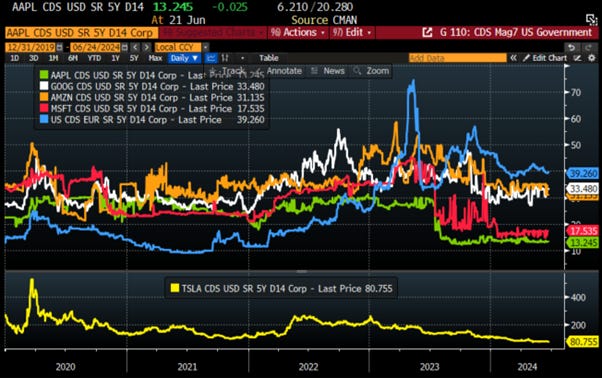
Bottom line, while no single economic argument favours tighter credit spreads, the surprise may come when the consensus shifts towards much tighter credit spreads across the board. Investors will begin to realize that the issue lies with governments, not private corporations. The next crisis will inevitably be a sovereign debt crisis, highlighting that owning a bond from a company like General Motors for example means investors may recover some funds from the sale of company assets in case of default. In contrast, if a government defaults, as expected sooner rather than later in Europe, holders of French OATs for example may find that even offering the Mona Lisa in the Louvre for auction won't guarantee repayment.
CDS Spread of US government (blue line); Microsoft (red line); Apple (green line); Amazon (orange line); Alphabet (while line); Tesla (yellow line; lower panel).
In this context and while Wall Street is still luring investors into an infamous ‘Goldilocks’ scenario, it should surprise no one that US households’ investments in stocks and government bonds are at a new all-time high, while ownership of real assets is only at average levels.

As it is premature to assume the inflation problem has been resolved, households’ ownership of inflation-resilient assets is insufficient to protect against a return of the inflation boomerang. By far the largest real asset in this sector is real estate, yet its ratio against inflation-vulnerable financial assets is barely above its 80-year average. Moreover, households’ ownership of interest-bearing deposits and money market funds, none of which are inflation-proof but are at least likely to lose less in real terms than long term government bonds, is at a 60-year low.
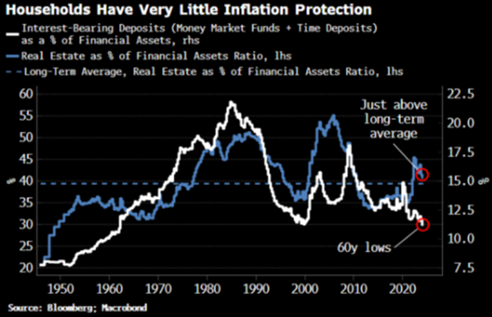
Instead, households have been leveraging themselves to buy stocks. The ratio of equity holdings to savings (time deposits + money market fund assets) recently reached a new high. This has helped push the cyclically adjusted P/E ratio of the S&P to a level it has only surpassed twice before, in 2000 and 2021.

Therefore, household investment portfolios and portfolios across the financial industry, are dominated by stocks and bonds, with only a small allocation to commodities.

This happens at a time when commodities remain secularly cheap compared to other financial assets. The commodity ratio to a 50/50 portfolio of stocks and bonds soared during the inflationary 1970s.

In a stickier environment similar to that of the 1970s, it is easy to fall into the money illusion trap with a portfolio of financial assets like the traditional 60/40 stock-bond portfolio. In nominal terms, such a portfolio was up over 30% in the decade; however, after the ravages of double-digit inflation, the same portfolio actually lost 35% in real terms.

Ultimately, history has shown that in an inflationary bust (i.e., stagflation), the best asset allocation is the Barbell Portfolio, composed of 30% tech stocks, 30% energy stocks, and 40% physical gold.
US Stagflation proxy index (blue histogram); Relative performance of the Barbell Portfolio (30% S&P 500 IT Sector; 30% S&P 500 Energy sector; 40% Physical Gold) to the old 60/40 portfolio (60% S&P 500 index; 40% Bloomberg USAgg Fixed Income Index) (red line)

In this context, it is clear Keynesian economics is faltering. Keynes argued in his 1936 book ‘The General Theory of Employment, Interest, and Money’ that volatile aggregate demand could lead to inflation or recessions, emphasizing spending as a tool for price control. Today, these theories are failing due to significant shifts: the US, once balanced budgeted, is now the largest borrower, aligning more with Adam Smith's ‘invisible hand’ theory. Keynesian economics gave the government the green light to manipulate the economy, or at least make numerous failed attempted to do so. There is that old joke about communism that ‘you can vote your way in but must shoot your way out’, seemingly fitting to the utter disaster governments have created in regard to the economic situation.

In 2024, the government is by far the largest borrower, rendering interest rate hikes ineffective as it simply borrows more, beyond the control of central banks. Historical examples, like the Federal Reserve's refusal during the Korean War in 1951, highlight conflicts over monetary policy when the budget isn't balanced. Quantitative Easing undermined the Keynesian model, leaving central banks with few tools to manage the economy. Government spending continues unchecked, fuelled by unsustainable borrowing, leading to an impending Sovereign Debt Crisis. The inability of Keynesian economics to adapt to declining confidence in government and the economy suggests a need for new approaches to understanding economic cycles, including factors like geopolitical tensions, which interest rate adjustments alone cannot sustainably manage.
Even with the influx of gold pouring into Europe from the New World discoveries, it caused significant inflation and economic turmoil. Ultimately, Spain's fiscal mismanagement led it from being the richest nation in Europe to a third-world country, a pattern which should sound familiar of what is next for the US.

Schumpeter viewed the Business Cycle as waves of innovation, where inventions like steam engines, combustion engines, tractors, airplanes, and the Internet propel economies forward. These dynamics are beyond the control of central banks. Paul Volcker acknowledged the cycle's approximately eight-year span. His Rediscovery of the Business Cycle illustrated the failure of Keynesian Economics in the 1970s. Even former FED Chairman Alan Greenspan conceded that the Business Cycle inevitably prevails.

In a nutshell, it is time for investors to understand how the business cycle works and to learn to live with it. Politicians and central banks in the Western world, which have embraced a socialist agenda that has led to the destruction of their economies, will have to come to terms with this reality despite that they have tried to control and manipulate the business cycle over centuries.

Those same governments, under the pretext of Diversity, Equality, and Inclusion (DEI) policies, have chosen to open their borders to illegal aliens and vilify the police. Meanwhile, philanthropists with political agendas have funded mobs advocating for the abolition of law enforcement, and non-citizens run rampant, attacking officers without consequences.

https://www.inclusionhub.com/articles/what-is-dei
Everyone must understand that governments falter when the police fail to provide protection. This is why in the US; some cities are advocating to fill officer vacancies with migrants. All it takes is for the police to align with the people against the government for societal collapse to ensue. The current issue of rioting against the police is historically part of the Revolutionary Cycle, which unfolds in five stages:
The FIRST STAGE of a revolution begins with intellectual dissent and whistleblowing, which governments often dismiss as temporary. This stage marks the recognition of governmental corruption and injustice. Examples include Edward Snowden's revelations of government surveillance, turning the state into a 100% surveillance entity monitoring every citizen's communication.

The SECOND STAGE of revolution begins when intellectual debates prove futile and initial conflicts arise. Government corruption reaches its peak, using justice for self-interest. Economic decline, exacerbated by government tax hikes, focuses public discontent on law enforcement, often seen as morally compromised for following orders. Moderate leaders attempt reasoning for resolution, ignored by the government, fuelling injustice and extremist demands for radical change, akin to Lenin's leadership. Initial protests demand reform but often devolve into revenge. Governments resist reform, relying on a defensive police state they've created, escalating protests and discontent until police loyalty shifts to the people, sparking the next revolutionary stage.

The THIRD STAGE of revolution escalates into street warfare as governments cling to power and resist acknowledging their mistakes. Historical examples like the Nika Revolt in 532 AD show police siding with the people or remaining neutral. In Ukraine's revolution against Yanukovich, police support shifted when they perceived Russian intervention. Conversely, in the Nika Revolt, the government deployed the army, resulting in mass casualties among both protesters and police. During the American Revolution, local authorities distinguished themselves from British control due to centralized power residing in England rather than locally.

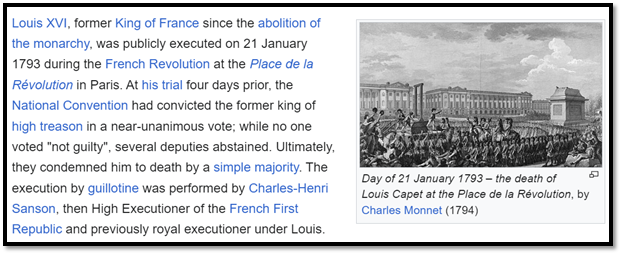
The FOURTH STAGE of a domestic revolution involves direct confrontation with the government and its head of state. In the American Revolution, although the British monarch was out of reach, loyalists had their property confiscated and some were executed for supporting the king. In contrast, during the Russian Revolution, the entire Romanov family was executed, and in the French Revolution, King Louis XVI and his wife were publicly executed. Similarly, during the English Revolution, King Charles I was seized and beheaded publicly. Historical instances like the assassination of Abraham Lincoln in 1865 also underscore this phase of seeking retribution for years of oppression and injustice.
The FIFTH STAGE of a revolution typically marks the recovery phase, where a new form of government emerges from the upheaval. In the United States, political moderates took power and established a new system based on utopian ideals, without the need for wholesale political purges as seen in revolutions with centralized power. Conversely, in the aftermath of the French Revolution, even moderates were eventually ousted by radicals like Robespierre, who instigated the Reign of Terror. Eventually, the radicals were overthrown, leading to the drafting of the French Constitution and the establishment of the Directory. Similar cycles of upheaval and restoration of nationalism occurred in other revolutions, with new leaders often emerging, such as Napoleon or Oliver Cromwell,
In 2024, the western world is in the second stage of the revolutionary cycle and rapidly heading toward stage three as discontent grows. However, investors should not be surprised if the plutocrats in power distract them from the looming domestic civil unrest by escalating military tensions in Ukraine, provoking Russia into an extended conflict. Additionally, they might incite another proxy war, possibly in the Korean peninsula. This strategy could serve to create a narrative of the US 'winning' by confronting Putin or potentially serve as a pretext to delay US Presidential elections due to heightened global tensions. This delay could give the permanent state more time to prepare for an early Biden succession.
In this context, bulls are walking on thin ice as much could go wrong in the coming weeks with an accelerating electoral calendar in France, the UK, and later in November in the US. With considerable complacency in financial markets and the widespread perception that the inflation problem is behind us, and that government bonds remain the safe asset to own amid higher volatility, many investors have not yet realized that the real problem lies with the government, not the private sector. Given this scenario, the best hedge is to hold positions that do not require hedging. Any of the potential events mentioned above could present opportunities as significant as those seen during the lows of the Covid pandemic. Whatever you do, don’t panic at the exact moment everyone else does. Once it’s in the press, it’s already priced in. Therefore, investors should prepare ahead of time to be a counterparty for those who are panicking. How much liquidity will it take? More than your counterparties have.
Investors should ultimately remember that they should not believe in anything just because they have heard it or because it was spoken and rumoured by many, but because they have done their own analysis to discover the truth.

WHAT’S ON THE AGENDA NEXT WEEK?
The last week of the last month of the second quarter will be relatively quiet for investors, as they will only need to focus on the Core PCE index and the University of Michigan inflation expectations and consumer indices, both to be released on Friday. The FED will also publish the results of the US Bank Stress Tests, likely continuing to whistle Dixie to investors' ears that everything is sound and stable in the US banking sector. Probably more entertaining will be the first presidential debate between Biden and Trump to be broadcasted live on Thursday evening US time. Finally, FedEx, Micron, and Nike will be the final S&P 500 companies to release their quarterly earnings for the first quarter.

KEY TAKEWAYS.
As the Northern hemisphere moves into the Summer season, here are the key takeaways:
The China retail sales data showed once again that more time is needed to Make China Great Again.
US retail sales confirmed that consumers are spending more on less, indicating that the consumer-driven economy is dying.
The US flash PMI, despite indicating an improving economic outlook, will not change the reality that all roads are leading to stagflation.
While the inflation boomerang is coming back in Japan, Norinchukin is the first Japanese bank to face the country's financial doom loop.
The current complacency in financial markets masks the reality that those deemed too big to fail are once again engaging in dangerous leveraged trading strategies, which will lead to another financial blowout.
In today’s world, the real problem is the government, not private corporations, which is why many corporations are now perceived as less risky than the government itself.
While credit spreads are tight on a historical basis, they will get tighter as investors understand that the next crisis will be a sovereign debt crisis, pushing governments to default.
In this context, current investors' asset allocations, overweight in equities and bonds and underweight in real assets, leave them unprepared for the upcoming inflationary bust.
As Keynesianism has failed, investors should learn to embrace the business cycle and live with it rather than ignoring it.
The failure of socialist Keynesian government policies will precipitate the Western world into a revolutionary environment which will be stagflationary.
With continued decline in trust in public institutions, particularly in the Western world, investors are expected to move even more into assets with no counterparty risk which are non-confiscatable, like physical gold.
US Treasuries are now not only a 'return-less' asset class but, given their high correlation with equities, have also lost their rationale for being part of a diversified portfolio.
For income investors, rather than chasing long-dated government bonds, they should focus on USD investment-grade US corporate bonds with a duration not longer than 12 months to manage their cash.
In a stagflation, the best way to protect wealth is still to own the equity barbell portfolio made of Tech and Energy and Physical Gold and avoid long dated bonds.
As stagflation rather than recession materializes as the economy is increasingly weaponized, investors should prepare their portfolios for HIGHER volatility.
In this context, investors should also remain prepared for dull inflation-adjusted returns in the foreseeable future.
HOW TO TRADE IT?
The week of the Juneteenth celebration was another ugly week for US macro data, dominated by declines in 'hard real data'. For equity investors, the Dow massively outperformed the Nasdaq, which still managed to end the week with minimal gains, marking the 8th positive week in the last 9 weeks. The S&P 500 also closed positively for the third week. As bulls walk on thin ice and all roads lead to an inflationary bust, they should prepare for much higher volatility in the coming weeks, as the current complacency in the equity and bond markets is unlikely to last. In this context, investors will continue to monitor the 50-day moving average as a key technical support to add companies that are part of the Barbell equity portfolio.

In this context, it's no surprise that last week’s performance was dominated by a mix of growth and value sectors such as Consumer Discretionary, Financials, and Communication Services. Meanwhile, Materials, Real Estate, and Utilities underperformed.

As there are increasing signs that the US economy is heading into consumer-led stagflation, and with risks related to governments and financial institutions driving market volatility, investors are advised to hedge their portfolios using decentralized assets 'free of counterparty risk,' prioritizing the return OF capital over the return ON capital. As we have reminded investors over weeks and months, the ultimate asset with no counterparty risk is physical gold. In a stagflationary environment, it is crucial for all investors, big or small, institutional, high net worth, and retail, to allocate 20% to 40% of their assets to physical gold stored outside the traditional banking system.
For investors looking to hedge their equity portfolios against a black swan event that could precipitate equity markets into a significant correction, they can benefit from the low level of volatility by buying 5% out-of-the-money puts on the S&P 500 with an expiry just after the US presidential election (November 15th) for a historically low premium. Should the US presidential election or another event cause the recent bull market to break the thin ice it has been walking on, these puts will provide adequate hedging for investors looking to stay invested. If the immaculate complacency prevails even after the US electoral deadline, investors will lose a minimum amount of capital, which is expected to be more than compensated by the performance of the Barbell Equity portfolio composed of Tech and Energy stocks, which will inevitably continue to outperform in the upcoming inflationary bust.

For fixed-income investors, owning government bonds in developed or emerging markets has become risky. In the current environment it is reckless to own government bonds with maturities over six months. That’s why investors should focus on investment-grade bonds issued by US corporations with an average maturity of less than 12 months.
At The Macro Butler, our mission is to leverage our macro views to provide actionable and investable recommendations to all types of investors. In this regard, we offer two types of portfolios to our paid clients.
The Macro Butler Long/Short Portfolio is a dynamic and trading portfolio designed to invest in individual securities, aligning with our strategic and tactical investment recommendations.
The Macro Butler Strategic Portfolio consists of 20 ETFs (long only) and serves as the foundation for a multi-asset portfolio that reflects our long-term macro views.
Investors interested in obtaining more information about the Macro Butler Long/Short and Strategic portfolios can contact us at info@themacrobutler.com.
Unlock Your Financial Success with the Macro Butler!

Disclaimer
The content provided in this newsletter is for general information purposes only. No information, materials, services, and other content provided in this post constitute solicitation, recommendation, endorsement or any financial, investment, or other advice.
Seek independent professional consultation in the form of legal, financial, and fiscal advice before making any investment decisions.
Always perform your own due diligence.
“The global economy was facing the worst collapse since the second world war as coronavirus began to strike in March, well before the height of the crisis, according to the latest Brookings-FT tracking index. “The index comes as the IMF prepares to hold virtual spring meetings this week, when it will release forecasts showing the deepest contraction for the global economy since the 1930s great depression. https://archive.md/UUfl2
Then we got covid ... the death shots... and trillions of $$$ in stimulus...
What surprise can we expect this time?
My take in a nutshell. Sales are declining to increased prices by the middleman, thereby affecting the end user the consumer. Since prices have increased again in the past quarter and of this one too, consumers won't spend. They are holding on to their money. Also, the bulls are selling in a sketchy market to protect against any significant losses.