


Cash: King or Catch?


THE WEEK THAT IT WAS...
As investors close out the year, the second week of December was relatively light on macroeconomic news, with inflation reports from China and the US being the main focal points. The politically driven ECB chairwoman also had the opportunity to share her views on how the ECB plans to address the ongoing political and budget crisis in her home country, as well as her expectations for dealing with the impact of the Trump tariffs, which are likely to push the Eurozone into an inflationary bust sooner rather than later.
China’s CPI inflation slowed to 0.2% in November, with factory-gate prices continuing their decline, highlighting the poor state of the economy. Weak price signals, alongside sluggish PMIs, suggest that the current stimulus is failing to revive the economy. November's PPI fell 2.5% year-on-year, extending a 26-month deflationary streak.

The ECB delivered an expected 25bps rate cut, avoiding a steeper 50bps move despite Europe's economic slump and persistent inflation. This fourth cut in the easing cycle lowered the Deposit Rate to 3.0%, with the Refi and Lending Facility rates trimmed to 3.15% and 3.40%, respectively. Key policy language shifted, dropping references to ‘restrictive’ settings and signalling the ECB views rates as neutral at 3.0%. Inflation was downplayed with the statement, ‘The disinflation process is well on track,’ though 2025 forecasts still show inflation above target, especially core inflation at 2.3%. Wage growth remains a concern as prices and wages continue adjusting with significant delays.

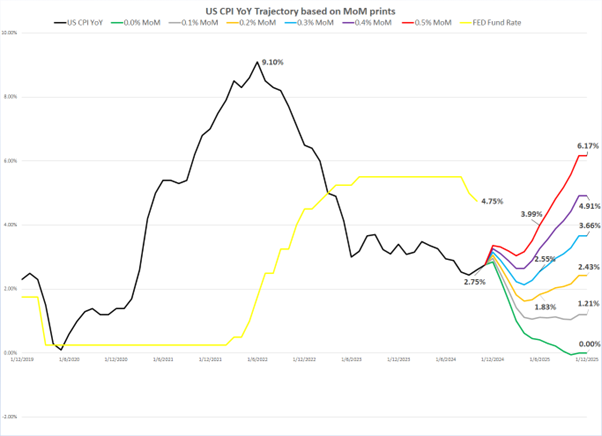
The November US CPI reveals persistent inflationary pressures, signalling that the US is moving toward reflation even before anticipated policy changes. Core and super-core CPI remain stubbornly high, suggesting that upcoming import tariffs and stricter immigration policies will likely accelerate inflation.
Investors should by now recognize the mathematical improbability of reaching the 2% inflation target by mid-2025. To achieve this would require unprecedented disinflation:
Returning to 2% inflation by mid-2025 is economically unfeasible, requiring monthly CPI increases below 0.3%.
Year-over-year CPI would need monthly inflation consistently under 0.2% for the next 13 months to return to below 2.0% by end of 2025.
If monthly inflation exceeds 0.2% for the next 13 months, year-over-year CPI could range between 3.6% and 6.2%, forcing the Fed to acknowledge its premature policy easing.
Following another step-in consumer price reflation, despite widespread exuberance over the data being 'as expected,' producer prices surged in November. Headline PPI rose 0.4% MoM, exceeding the anticipated 0.2%, the largest increase since June, pushing YoY PPI to 3.0%, the highest since February 2023. Food costs drove the increase, with a 54.6% spike in chicken egg prices contributing significantly, alongside rises in vegetables, fruits, processed poultry, and residential electric power. Meanwhile, services costs are accelerating YoY, and energy's deflationary impact is rapidly diminishing.
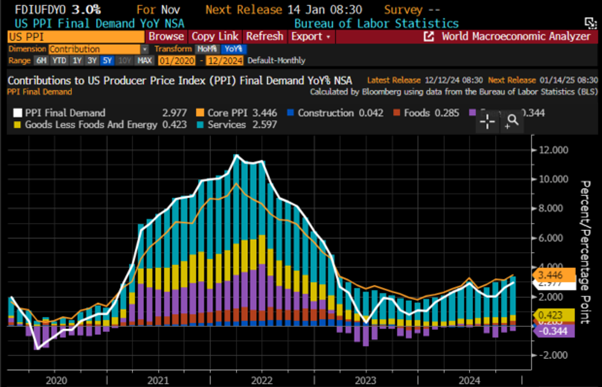
Not only was much of the PPI report higher than expected, but the underlying components were as well. The percentage of components rising on an annual basis stands at 80%, which, historically, is typically consistent with PPI remaining elevated.

Most concerningly, the spread between core CPI and core PPI has turned negative for the first time since January 2021. As a result, businesses will begin to face margin pressures or will need to raise prices unless they are prepared to accept a significant derating of their share prices over the next 12 months.
S&P 500 12-months Forward P/E (blue line); Spread between US Core CPI & US Core PPI (histogram) & correlations.

Bottom line: If October's CPI data prompted the FED's 25bps cut last month, November's report suggests a potential pause this month, especially as investors brace for goods and services reflation tied to measures from the 47th U.S. president-elect. With the likelihood of the US economy shifting from an inflationary boom to an inflationary bust increasing daily, Wall Street, assigning a 93% probability to a 25bps cut next week and forecasting nearly three cuts by the end of 2025, must accept the FED's growing irrelevance.

Indeed, since the last FOMC meeting on November 7th, the long end of the yield curve has continued to rise, with the largest increases recorded in the 5-10 and 30-year maturities.

Investors should by now be accustomed to how the Permanent Brown Portfolio allows them to achieve a 3% to 4% real return (above inflation) during peacetime by equally allocating investments across four asset classes, which should form the backbone of every portfolio throughout the business cycle. They should also understand that by actively managing their asset allocation based on the business cycle, they can achieve higher real returns over time. Among the four asset classes, which are divided into contracts (cash and bonds) and properties (equities and gold), one asset class has historically been considered King: CASH.

Investors should first define cash in investing terms: short-term, low-risk instruments or accounts offering liquidity and modest, interest-based returns. Designed to preserve capital, cash investments suit those prioritizing safety over high-risk options. Easily convertible within 90 days, they are backed by governments, banks, or reputable institutions, ensuring capital security. These investments typically offer predictable returns through fixed or variable interest rates and have short maturities, from a few months to a few years.
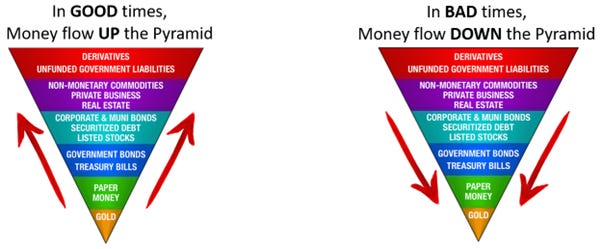
In John Exter's Inverted Pyramid of Risk, cash and physical gold rank among the lowest-risk assets. During credit expansions, capital flows upward toward higher-risk, lower-liquidity assets, amplifying theoretical capital through reuse as collateral in layers like derivatives. In crises, capital shifts downward to safer assets like cash, and gold, reflecting a flight to stability. Exter’s pyramid highlights hidden financial risks, urging investors to look beyond balance sheets. Gold stands apart as an asset free from credit, government risks, and currency devaluation. With rising sovereign debt defaults and declining trust in public institutions, investors increasingly seek assets with no counterparty risk—gold, the ultimate antifragile asset.
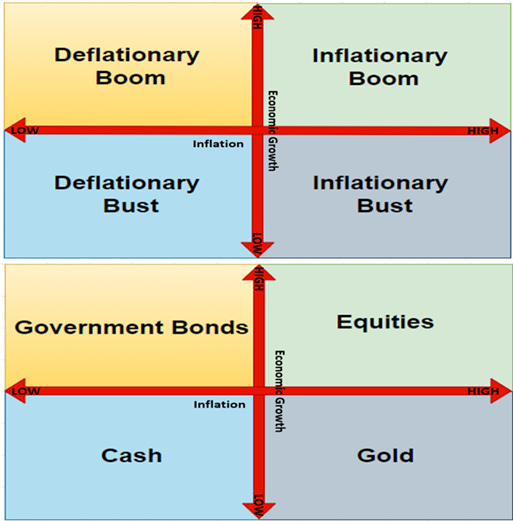
When matching the four seasons of the business cycle with the four asset classes of the Permanent Browne Portfolio, investors should remember that cash is the preferred asset class during a deflationary bust due to its short-term maturity and the contractual nature of its value. Conversely, gold is the preferred asset during an inflationary bust, as it provides protection in environments where investor trust in the government diminishes.
This preference for gold over cash during an inflationary bust is evident from the CPI-adjusted performance of the four asset classes during the most recent inflationary bust in the US economy, spanning January 2022 to October 2023. During this period, still fresh in the minds of most investors, bonds and stocks were the asset classes to avoid at all costs. Gold, however, was the only asset class that provided inflation-adjusted protection for investors' wealth.
CPI adjusted return in USD of Gold (blue line); S&P 500 index (red line); Bloomberg US Ag Total Return Index (green line); Bloomberg US Treasury Bills 1-3 months Index (purple) between 31st January 2022 and 31st October 2023.

Investors know that the past four years and the turn into the 2020s have brought massive changes, not only in people's lifestyles but also in the weaponization of USD assets, which has had significant consequences on the economy and government spending. Apart from fuelling ongoing financial conflicts, this has been the source of structurally higher inflation. Looking at the performance of the four asset classes on a CPI-adjusted basis for U.S. investors, it should come as no surprise that gold and equities (e.g., the S&P 500 index) have offered not only higher but also positive inflation-adjusted returns, while contracts like cash and bonds have declined in value when adjusted for US CPI as the US business cycle swung from inflationary boom and bust since the start of this decade.
CPI adjusted return in USD of Gold (blue line); S&P 500 index (red line); Bloomberg US Ag Total Return Index (green line); Bloomberg US Treasury Bills 1-3 months Index (purple) since 31st December 2019.

From a longer time horizon, it becomes definitively clear to anyone who can read a chart that physical gold outperforms cash when the economy is in an inflationary mode, whether during an inflationary boom or an inflationary bust.
Upper Panel: S&P 500/Oil ratio (blue line); 84 months Moving Average of the S&P 500/Oil ratio (red line); Second Panel: Gold/Bond ratio (green line); 84 months Moving Average of the S&P Gold/Bond ratio (red line); Lower panel: Relative performance of Physical Gold to Bloomberg US Treasury Bill 1–3-month index (yellow line).

Upper Panel: S&P 500/Oil ratio (blue line); 84 months Moving Average of the S&P 500/Oil ratio (red line); Second Panel: Gold/Bond ratio (green line); 84 months Moving Average of the S&P Gold/Bond ratio (red line); Lower panel: Relative performance of Bloomberg US Ag Total Return Index to Bloomberg US Treasury Bill 1–3-month index (yellow line)

In summary, investors can conclude that, for asset allocators, cash is not always king; it reigns supreme only when the economy enters a deflationary bust, an environment the US has not experienced since the late 1990s and early 2000s and is unlikely to face soon. Anyone with a modicum of common sense can see that, despite the ‘Trumped’ propaganda spread by the elected 47th US president, the adoption of widespread tariffs will inevitably be inflationary and even stagflationary. This will likely push the US from the current inflationary boom into an inflationary bust sooner rather than later, following similar transitions in other major economies like the Eurozone and Japan.
If cash is not always king for asset allocators, the next question is: what about for stock pickers? In an environment where government spending among G7 countries has gone parabolic, and government debt and its refinancing have become major concerns for investors who understand where the real risks lie, many have yet to realize that corporations have been far more frugal in managing their balance sheets over the past decades. For those who fail to grasp that governments are living on borrowed time, a simple look at the evolution of US nominal GDP and public debt since 1993 is revealing. A key milestone occurred in December 2012, when US public debt surpassed nominal GDP for the first time. Since then, public debt has more than doubled, while nominal GDP has grown by less than 80% over the same period.
US Nominal GDP in nominal USD (blue line); US Public Debt in nominal USD (red line).

While the U.S. government has spent recklessly with little accountability, corporate America has managed its balance sheets far more prudently. The S&P 500’s net debt (Total Debt – Cash Equivalents) peaked in 2007 during the Global Financial Crisis and steadily declined until 2022, except during the 2020 COVID-19 lockdowns. Since 2022, net debt has risen slightly, likely due to increased investment in automation and AI to address inflationary pressures but remains below the peak of 2007 levels. Corporate America achieved this through a threefold increase in cash equivalents, while total debt grew by less than 8%. In contrast, US public debt has nearly quadrupled over the same period.
S&P 500 Cash Equivalents (blue histogram); Total Debt (red histogram); Net debt (Total Debt – Cash Equivalents) (green histogram).

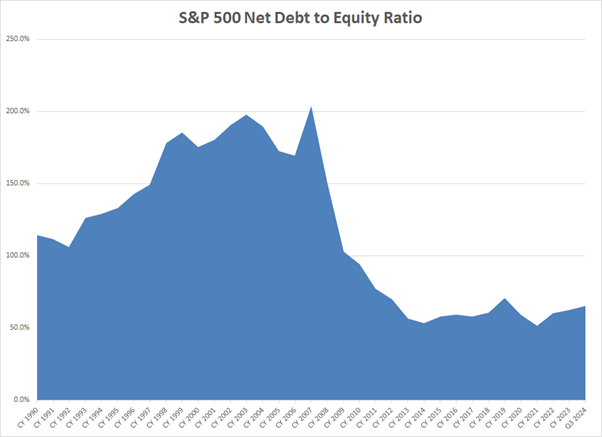
This ability to generate significant cash while being prudent with debt has allowed corporate America to reduce its net debt-to-equity ratio to 65.0% on aggregate for the S&P 500 index as of the end of Q3 2024. This compares to a staggering 204% at the end of 2007, during the height of the Great Financial Crisis that led to bankruptcies like Lehman Brothers. If one assumes that nominal GDP represents the ‘equity’ created by the government, the U.S. government’s current net debt-to-equity ratio stands at approximately 123%. Any investor with a modicum of common sense can discern who is more likely to default in the foreseeable future and that’s why the once upon risk free asset (i.e. government bonds and cash) and not necessarily free of risks anymore.
S&P 500 Net debt to equity ratio since 1990.
Having cash on the balance sheet is important, but the ability to generate cash through a steady business model and redistribute it via dividends is a key indicator of corporate health. As of Q3 2024, the annualized free cash flow (FCF) for the S&P 500 reached a record high, surpassing the previous peak in 2021. Wall Street projects FCF to grow by 21% in 2025, following a 15% increase in 2024 and nearly doubling since 2014. Dividends are also expected to rise by 6% in 2025, having more than doubled between 2013 and 2024. As the U.S. economy faces challenging times ahead, investors should focus on sectors that are cash-rich and capable of generating positive FCF to ensure long-term resilience.
S&P 500 Free Cash Flow (blue histogram) Dividends (red histogram).

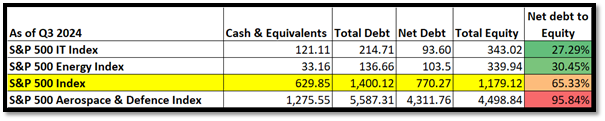
As the scenario of an inflationary bust is getting more traction, sector and stock picking will inevitably gain importance due to rising debt costs and increasing difficulties for corporates with a weaker business model to refinance their debt and grow their sales and earnings. In tis context, analyzing sector leverage can provide valuable insights for equity portfolio allocation. As of Q3 2024, three sectors within the S&P 500 have a net debt-to-equity ratio below 50%. Unsurprisingly, the notoriously cash-rich IT sector is the least leveraged, but some investors may be surprised to see Energy and Materials ranking as the second and third least leveraged sectors. Conversely, traditionally defensive sectors such as Utilities, Consumer Discretionary, and Consumer Staples are among the most leveraged, with net debt-to-equity ratios exceeding 100%.

Savvy investors know that in a world where geopolitics increasingly drives the business cycle, the best way to shield their wealth is by investing in a so-called Smart Defense Equity Portfolio, consisting of equal-weight investments in the IT, Energy, and Aerospace Defense sectors. When evaluating these sectors in terms of balance sheet quality, investors will note that the Aerospace and Defense sector is, unsurprisingly, more leveraged than both the S&P 500 index and the IT and Energy sectors.
At this point in the analysis, investors should have already understood that while cash is not always king for asset allocation, it is certainly key when selecting sectors within an equity allocation. This is especially important as the world is gradually shifting from an inflationary boom to an inflationary bust amid the threat of tariffs.
Digging deeper into stocks, as of the end of November 2024, 69 companies within the S&P 500 have a net cash balance sheet and have generated positive free cash flow (FCF) over the past 12 months. Not surprisingly, five out of the Magnificent Seven are part of this group. Over the past 24 years, the number of S&P 500 companies meeting this quantitative criterion has ranged from 61 in December 1999 to 131 in October 2005.

An investor who had invested $100 in an equal-weight portfolio of Net Cash & positive FCF companies over the past 25 years would have $765 as of the end of November 2024. Over the same period, those who had invested $100 in the S&P 500 would have $410, while $100 invested in the Smart Defence Equity portfolio, composed of one-third IT, one-third Energy, and one-third Aerospace Defence indices, would have grown to $1,885 by the end of November 2024.
Those with an inquisitive mindset would note that the Net Cash & + FCF portfolio began to deliver alpha against the S&P 500 starting in 2010, with an accelerating trend of outperformance at the beginning of 2020. However, it significantly underperformed from December 2021 to January 2023, a period previously characterized as an inflationary bust, before delivering another leg of outperformance during the past 22 months of the inflationary boom.
The main reason for the underperformance of this portfolio during an inflationary bust is likely that, since the 2020s, companies with net cash on their balance sheets and positive FCF generation have generally been found in the IT sector, which has historically been a sector to avoid during an inflationary bust. Meanwhile, the portfolio has been structurally underweighted in energy-producing sectors, such as Energy, which have historically performed well during difficult economic times such as an inflationary bust. In fact, between December 2021 and January 2023, the portfolio had no allocation to the Energy sector and nearly 30% allocated to the IT sector, along with over 10% in Consumer Discretionary.

As of the end of November 2024, the 69 stocks in the S&P 500 with a net cash position on their balance sheet and positive FCF generation over the past 12 months are primarily in the IT sector (33.3%), Financials (17%), Industrials (16.6%), and Consumer Discretionary (12.9%).

In a nutshell, if the worst-case scenario of a 'Trump Stagflation' materializes in 2025, that kind of sector allocation would not bode well for investors, based on the historical returns of energy-consuming sectors versus energy producers during previous inflationary busts.
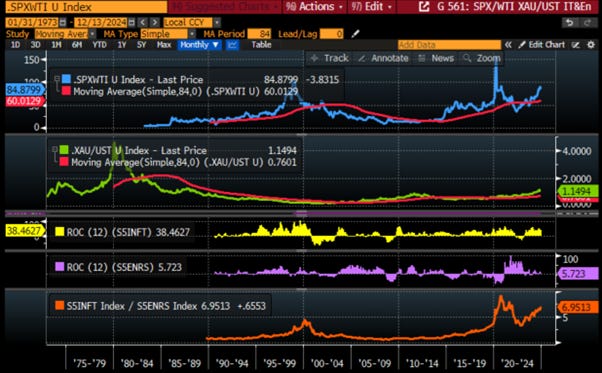
Upper Panel: S&P 500/Oil ratio (blue line); 84 months Moving Average of the S&P 500/Oil ratio (red line); Second Panel: Gold/Bond ratio (green line); 84 months Moving Average of the S&P Gold/Bond ratio (red line); Third Panel: S&P 500 IT Index 12-monhs rate of change (yellow histogram); Fourth Panel: S&P 500 Energy index 12-months rate of change (purple histogram); Lower panel: Relative performance of S&P 500 IT Index to S&P 500 Energy index (orange line).
This brings us to the conclusion that, yes, cash is king in a deflationary bust and is likely to guide sector selection, especially when the economy shifts from an inflationary boom to an inflationary bust. However, relying solely on net cash positions and positive FCF generation for stock picking could lead to an over-allocation in sectors that have benefited from the recent inflationary boom, such as IT and Consumer Discretionary, while being underweight in sectors like Energy, which performs well during an inflationary bust, as seen in the US between December 2021 and January 2023. In this context, investors who can connect the dots and want to prepare for the worst-case scenario of a 'Trump Stagflation' should still conduct their due diligence in stock picking within the three sectors of the Smart Defence Equity Portfolio: IT, Energy, and Aerospace Defence. The Smart Defence Portfolio remains the best way for investors to reduce volatility in their equity asset allocation. However, investors should keep in mind that during an inflationary bust, they will need to reduce their equity allocation and increase their allocation to gold and other real assets.
Upper Panel: S&P 500/Oil ratio (blue line); 84 months Moving Average of the S&P 500/Oil ratio (red line); Middle Panel: Gold/Bond ratio (green line); 84 months Moving Average of the S&P Gold/Bond ratio (red line); Lower Panel: Relative Performance of Smart Defence to S&P 500 Index (yellow line).

Investors should also never forget that, in the worst-case scenario of an inflationary bust, gold, not government bonds, is the antifragile asset to hold. Among equities, investors will need to shift from energy-consuming sectors like IT to energy-producing sectors like oil and gas. This shift will occur in an environment where investors must increasingly prioritize the Return OF Capital over the Return ON Capital.
WHAT’S ON THE AGENDA NEXT WEEK?
The last full week of trading of the year will bring investors' attention to China and US retail sales and industrial production, as well as the Core PCE index in the US, which will be released two days after the last Federal Open Market Committee (FOMC) and Bank of Japan meetings of the year. Nike and FedEx will complete the release of quarterly earnings for the third quarter of 2024.

KEY TAKEWAYS.
As everyone are decorating their houses for Christmas, here are the key takeaways:
The latest inflation data points to deflation, but the Yuan has been a poor store of value since late 2021, reflecting the challenges of an impending inflationary bust and Xi’s struggle to Make China Great Again.
The politically driven ECB cut rates by 25bps as expected, signalling neutral policy while cautioning on persistent inflation risks from wage growth and delayed price adjustments.
The US November CPI underscores persistent inflation, with sticky core metrics and upcoming tariffs signalling a steeper path to reflation, making the FED's 2% target by mid-2025 phantasmagorical.
November's hotter-than-expected PPI, driven by food and services inflation, signals that Corporate America faces the choice between rising margin pressures or passing higher input prices on to consumers sooner rather than later, fuelling the reflation wave.
The Permanent Brown Portfolio balances cash, gold, bonds, and equities to provide steady returns, with cash and gold acting as safe-haven assets during deflationary and inflationary busts.
Throughout history, physical gold outperforms cash during inflationary periods, while cash outshines bonds in both inflationary booms and deflationary busts.
As government debt soars since the start of the decade, Corporate America stays disciplined, cutting debt and boosting cash reserves.
With rising government debt, the once upon a time ‘risk-free’ assets like government bonds and cash are no longer free of risk.
Cash may be king in a deflationary bust, but smart stock picking across sectors like IT, Energy, and Aerospace Defence, along with a strategic shift to gold and real assets, is key to reducing volatility and preparing for an inflationary bust.
With the US still in an inflationary boom, the S&P 500/gold ratio sitting just above its 7-year average, a drop below this level has historically signalled poor outcomes for the economy and equity returns.
In today’s volatile market, investors should favour antifragile assets like gold over bonds, as gold offers low equity correlation, stability, and resilience against currency debasement.
In such environment, investors will once again need to focus on the Return OF Capital rather than the Return ON Capital, as stagflation spreads.
Physical gold remains THE ONLY reliable hedge against reckless and untrustworthy governments and bankers.
Gold remains an insurance to hedge against 'collective stupidity' and government’ hegemony which are in great abundance everywhere in the world.
With continued decline in trust in public institutions, particularly in the Western world, investors are expected to move even more into assets with no counterparty risk which are non-confiscable, like physical Gold and Silver.
Long dated US Treasuries and Bonds are an ‘un-investable return-less' asset class which have also lost their rationale for being part of a diversified portfolio.
Unequivocally, the risky part of the portfolio has moved to fixed income and therefore rather than chasing long-dated government bonds, fixed income investors should focus on USD investment-grade US corporate bonds with a duration not longer than 12 months to manage their cash.
In this context, investors should also be prepared for much higher volatility as well as dull inflation-adjusted returns in the foreseeable future.
HOW TO TRADE IT?
With only 11 trading days left in the year, the Nasdaq continued to outperform the S&P 500 and the Dow, which ended the week lower, while the Nasdaq posted its fourth consecutive weekly gain. This outperformance appears to be driven by year-end window dressing, propelling the Magnificent 7 to new all-time highs over the past seven days, despite Nvidia's significant underperformance during this period. While all three indices remain in bullish daily and weekly technical reversal patterns, caution is advised as a potential yearly top and pullback could close the November 6th gap, with support likely at the 50-day moving averages in December.

In this context, it’s no surprise that Communication Services, Consumer Discretionary, and IT keep outperforming, while Materials, Utilities, and Real Estate lag.

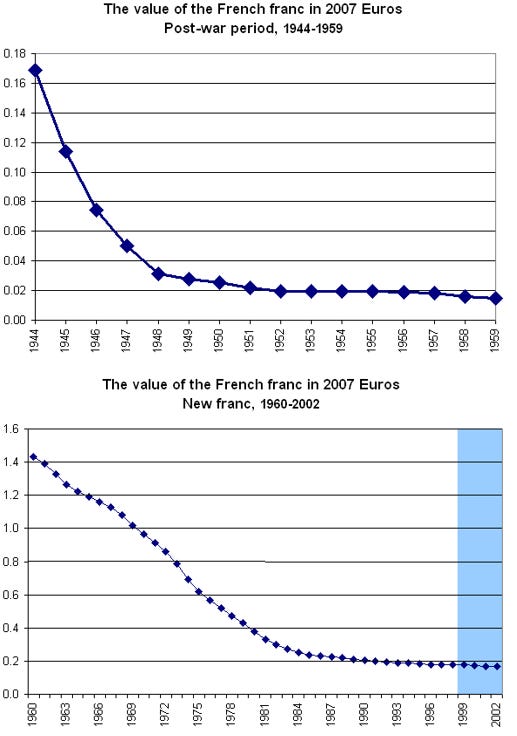
The best quality of every manager and leader, including wealth managers, is to prepare for the worst and hope for the best. In this context, while investors know that cash is king, they must acknowledge that cash can also be catch. Being a contract with the government issuing the currency, cash bears the counterparty risk of that government, which can change the rules governing its use. Investors in Emerging Markets are accustomed to seeing the real value of their domestic currencies debased. They also know that in times of crisis, governments are quick to create new currencies to convince citizens that their economy is doing well. For those who are not convinced, they can ask the citizens of Zimbabwe how rich or poor they feel, even after holding a 100 trillion banknote.

French investors are probably one of the last in the western world who have been bearing with this reality. The French franc, introduced in 1795 after the Revolution, replaced the livre tournois and was initially pegged to silver. While it held value through the 19th and early 20th centuries, World Wars I and II led to significant declines, especially during WWII when hyperinflation caused a 90% loss in value. In 1960, a currency reform replaced the old franc with the new franc (NF) at a rate of 100:1, pegged to a basket of currencies to restore stability.
Investors must also recognize the importance of where they should safeguard their cash during turbulent financial markets, especially amid ongoing wars and the resulting debt crises that will follow. They should avoid holding accounts in countries prone to sovereign crises or embroiled in proxy wars. This includes nations within the Eurozone, the UK and anywhere in the Middle East. For those residing or planning to settle in the mercantilist Global South, establishing accounts in Singapore, Hong Kong, and Mauritius can provide a secure option to navigate the challenges of geopolitics and capital controls. Americans should prioritize banks with a strong presence in red states, which are more likely to thrive in the next four years and avoid regional banks heavily exposed to real estate assets in blue states.
In summary, much like diversifying where they store their gold, investors should store their cash in multiple locations. As the world faces increasingly uncertain times, it is essential to have backup plans—Plan B and Plan C—that can be activated if external geopolitical factors disrupt the primary plan.

Savvy investors must carefully select the banking institutions where they custodize their cash and avoid placing all their eggs (i.e., cash) in one basket (i.e., a single bank). In this environment, rather than hoping their bank will survive the next financial crisis as the too big to fail are now too big to rescue, they should actively manage their cash. A prudent strategy would involve diversifying into a portfolio of short-dated (not exceeding 12 months maturity) investment-grade USD bonds issued by US strategic companies with low leverage and strong competitive moats. These qualities will enable such companies to navigate rising yields and weak economic growth, exacerbated by widespread tariffs. Since the end of May 2024, such a portfolio has delivered a 3.0% return as of end of November 2024, translating to an expected annualized return of at least 5.0%, with minimal credit and duration risk.
While the US has never experienced a currency change over the past century, other countries have been accustomed to changing their currency, and ultimately the real (inflation adjusted) value of their cash, when economic conditions were so dire that it became the only way for those in power to maintain control and address inflationary debasement of their debt. In this context, rather than focusing on the nominal returns of the four asset classes in the Permanent Brown Portfolio, the CPI-adjusted rate of return seems more appropriate. Beyond the risk of holding government-backed contracts during periods of reckless spending and weaponization of USD assets, investors will note that gold, not cash, will preserve their wealth on a CPI-adjusted basis when the economy transitions from an inflationary boom to an inflationary bust. In this context, those with a large cash position in their portfolio are betting on the expectation that the US economy will enter a deflationary bust in the next 12 months, an unlikely scenario, especially as the 47th US president uses his favourite tactic, tariffs, in negotiations with the mercantilist Global South, which increasingly seeks to reduce its dependence on the unpredictable consequences of America's imperialistic ‘Pax Americana’ and its never-ending ‘bankers' wars.’
Upper Panel: S&P 500/Oil ratio (blue line); 84 months Moving Average of the S&P 500/Oil ratio (red line); Second Panel: Gold/Bond ratio (yellow line); 84 months Moving Average of the S&P Gold/Bond ratio (red line); Third Panel: Gold price adjusted to US CPI 12-months rate of change (yellow histogram); Fourth Panel: S&P 500 adjusted to US CPI 12-months rate of change (purple histogram); Fifth Panel: Bloomberg US Agg Bond index adjusted to CPI 12-monhts rate of change (orange histogram); Lower Panel: Bloomberg US T bills 1-3 Months adjusted to US CPI 12-months rate of change (grey histogram).

Investors holding cash should recognize that keeping funds in a bank account exposes them to counterparty risk. Historically, inflationary busts have been challenging for the banking sector, as financial crises have often coincided with such periods of the business cycle. This comes at a time when a tsunami of liquidity could be weaponized, poised to crash against the great wall of debt refinancing, while institutions deemed ‘too big to fail’ have become ‘too big to rescue.’
Upper Panel: S&P 500/Oil ratio (blue line); 84 months Moving Average of the S&P 500/Oil ratio (red line); Second Panel: Gold/Bond ratio (yellow line); 84 months Moving Average of the S&P Gold/Bond ratio (red line); Third Panel: Relative Performance of KBW Bank Index to S&P 500 index (purple line); KBW Bank Index 12-months rate of return.

In a nutshell, in both an inflationary boom and an inflationary bust, cash is a catch, not king, when adjusted for CPI. Therefore, investors should increase their allocation to property in such an inflationary environment. Investors can still be invested in equities until the US economy remains in an inflationary boom and will have to switch to gold and other real assets once the business cycle in the US and elsewhere moves into an inflationary bust.
Given the high likelihood of fluctuating inflationary cycles, investors should focus on gold, not bonds or cash, as the key antifragile asset. Gold offers better risk-adjusted returns to own as the US economy on the verge of transitioning from an inflationary boom to an inflationary bust. In this context, holding US equities without a significant gold hedge has become irresponsible. Allocating over 50% of equity holdings to energy and defence stocks, while avoiding long-term government bonds, will protect investors' wealth and deliver returns exceeding the 3% to 4% real annualized return of the Browne Portfolio in this environment. Investors should also minimize cash held in the banking system and government bonds, replacing them with gold and short-term, investment-grade corporate paper.
As the coming years will be challenging for investors and their families, it’s crucial to focus on factual data rather than propaganda. While we can't alter cycles or control the future, we can learn from the past to prepare for what lies ahead, staying calm and proactive to protect ourselves and our loved ones. As the adage says, prepare for the worst and hope for the best, as it’s always about money, money, money…
And whoever controls the money controls the world…

If this report has inspired you to invest in gold and silver, consider Hard Assets Alliance to buy your physical gold:
https://hardassetsalliance.com/?aff=TMB
At The Macro Butler, our mission is to leverage our macro views to provide actionable and investable recommendations to all types of investors. In this regard, we offer two types of portfolios to our paid clients.
The Macro Butler Long/Short Portfolio is a dynamic and trading portfolio designed to invest in individual securities, aligning with our strategic and tactical investment recommendations.
The Macro Butler Strategic Portfolio consists of 20 ETFs (long only) and serves as the foundation for a multi-asset portfolio that reflects our long-term macro views.
Investors interested in obtaining more information about the Macro Butler Long/Short and Strategic portfolios can contact us at info@themacrobutler.com.
Unlock Your Financial Success with the Macro Butler!

If this report has inspired you to invest in gold and silver, consider Hard Assets Alliance to buy your physical gold:
https://hardassetsalliance.com/?aff=TMB
Disclaimer
The content provided in this newsletter is for general information purposes only. No information, materials, services, and other content provided in this post constitute solicitation, recommendation, endorsement or any financial, investment, or other advice.
Seek independent professional consultation in the form of legal, financial, and fiscal advice before making any investment decisions.
Always perform your own due diligence.