


Caught Off Guard FED?


THE WEEK THAT IT WAS...
During the 2024 Pink Moon week, significant macroeconomic indicators like the US Manufacturing and Services flash PMI, along with inflation-related data such as the GDP deflator; Core PCE Index and University of Michigan consumer inflation expectations, took the spotlight. Outside the US, the Bank of Japan garnered attention ahead of the next week's FOMC meeting. Additionally, the week marked the beginning of the earnings season for the Magnificent 7.
In Japan, while the Bank of Japan's monetary-policy decision might have disappointed yen bulls, with dollar-yen breaking through 158 after the announcement, there was no explicit mention of tapering quantitative easing, let alone quantitative tightening, apart from keeping the policy rate at 0.1%. However, the much shorter policy statement could signal that the BOJ aims to enhance market communication and move further away from unconventional policies. This suggests that a reference to quantitative tightening could still occur later this year. In fact, the BOJ could buy fewer bonds under the radar in what is known as "stealth tapering."

In the US, the Flash April US services and manufacturing PMI fell to their lowest levels in the past 5 months, with the manufacturing sector slipping back into contraction for the first time since November. As another sign that inflation has boomeranged, after March showed accelerating prices, flash April data confirmed the trend. Manufacturing has now registered the steepest rate of price increases in three of the past four months, with factory cost pressures intensifying in April amid higher raw material and fuel prices, contrasting with the wage-related services-led price pressures seen throughout much of 2023. In a nutshell, slower growth coupled with much faster inflation suggests an impending inflationary bust, which doesn't align with the conditions conducive to rate cuts; quite the contrary.

The initial Q1 2024 GDP estimate added to concerns about the US economy moving towards an inflationary bust. Despite the Biden administration's attempt to downplay it with ‘Forward Confusion’, GDP growth for Q1 was just 1.6%, a significant drop from Q4's 3.4% and below the expected 2.5%. Behind the soft-landing narrative lies the troubling reality of the GDP deflator, which came in at 3.1%, exceeding expectations of 3.0% and nearly doubling the 1.6% seen in Q4.

Adding fuel to the return of the inflation boomerang, both the headline and core PCE deflator printed hotter than expected (+2.7% versus +2.6% expected versus +2.5% prior and +2.8% versus +2.7% expected versus +2.8% prior, respectively). The service sector led the MoM and YoY acceleration in the headline PCE and core PCE. The three-month annualized core PCE jumped to 4.4%, hardly suggesting that the inflation pressures are easing.
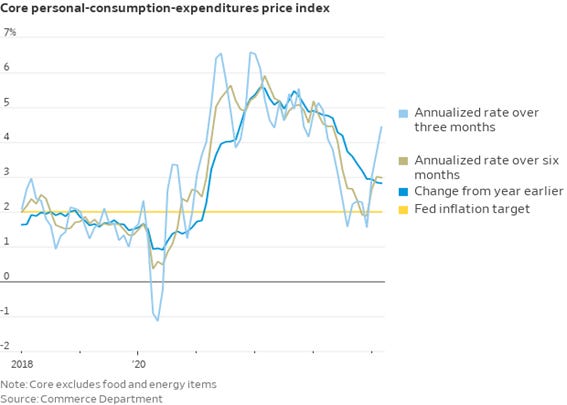
Adding to these stagflationary data, the latest University of Michigan 1-year inflation expectation rose to 3.2%, up from the preliminary +3.1% in April and 2.9% in March, marking the highest level since November 2023. On the other hand, the headline sentiment declined in April from a 3-year high as consumers’ perceptions of their current financial situation and the economic outlook over the next year both slid to four-month lows.

As a reminder that the US commercial real estate sector continues its slow-burning agony, the latest report from ATTOM shows that CRE foreclosures topped 625 in March, up 6% from February and 117% YoY. The number of foreclosures is approaching its October 2014 peak of 889. Not surprisingly, outside California, which began experiencing a rise in commercial foreclosures last November, New York and New Jersey also showed increases last month. More worrying is the spread of the CRE crisis to ‘red states’ like Florida and Texas, which benefited from business migration out of ‘heavily taxed blue states’ in 2023. At the same time, office vacancies rose to a record of 19.8% as of end of Q1 2024, up from 19.6% in the fourth quarter of 2023.

With 228 companies of the S&P 500 having released their Q1 2024 earnings so far, this earnings season has seen a mix of hits and misses among the Magnificent 7 and the semiconductor sector. Interestingly, outside of Communication services, driven mostly by Alphabet’s stellar results and outlook, most sectors have experienced flat to negative EPS revisions since the beginning of the month, with the Healthcare sector particularly affected by negative trends.

Adding to the deterioration of the geopolitical tensions, on April 20th, the US congress when it passed the new aid package to support the so-called ‘war effort’ for Ukraine also approves the REPO Act, bringing a new dimension to the weaponization of the USD. This REPO Act allows the Biden administration to confiscate billions in Russian sovereign assets held in US banks. The REPO Act mandates actions related to the confiscation and disposition of these assets, directing U.S. financial institutions to notify the Treasury Department of any Russian assets they hold. Confiscated assets are to be deposited into the Ukraine Support Fund, which is supposed to compensate Ukraine for damages caused by the Russian invasion and supports reconstruction efforts, humanitarian assistance, and other purposes aiding Ukraine's recovery. The bill also aims to establish an international mechanism to tap into Russian assets in Europe for further compensation to Ukraine.

Not only is the REPO Act ILLEGAL, it is an escalation of the already weaponized USD, which will also trigger massive outflows from European and US banks from other countries that have chosen to oppose the Washington warmongers and green zealots. These countries are joining the BRICS bloc to create a new economic bloc independent of the so-called Western developed countries, which are heading toward underdevelopment in a new Stone Age under their scammed green climate change agenda.
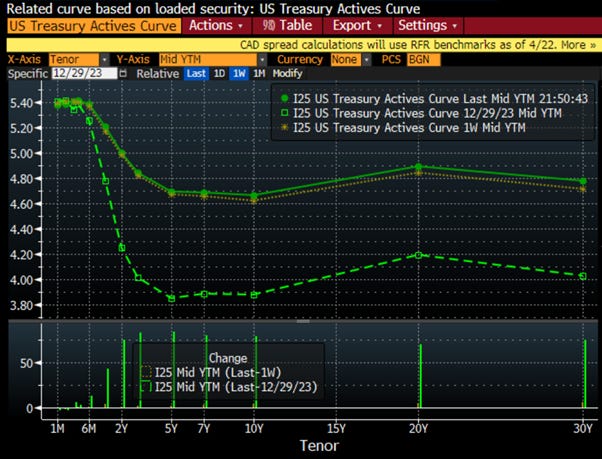
With more data pointing to an inflationary bust, it should come as no surprise that the bear steepener has regained further momentum over the past week. While this Monday's US Treasury Quarterly Refunding Announcement could temporarily calm the bear steepener, Janet Yellen is running out of magic tricks to delay the inevitable: the un-inversion of the yield curve by the long end.
In this context, it is becoming increasingly evident that the FED will NOT cut rates in 2024 and that rate HIKES should soon become the baseline expectation. However, with the US presidential election just 6 months away, a rate hike before the November meeting seems unlikely but after everything could be on the table. Meanwhile, the 'Forward Confusion' driven by the myopic Wall Street consensus still anticipates more than one interest rate cut for the year, with a probability of 36% for the first cut to occur in September.

With the bear steepener emerging from its 'Halloween hibernation', concerns about a possible squeeze in US funding markets are resurfacing. While funding issues have been quiet this year, the current situation calls for renewed vigilance. This bear steepening exacerbates reserve depletion via a decreasing reverse repo facility (RRP) and raises government interest payments.

Over the past weeks, the curve has been bear steepening in the 3-12 month versus 10-year sectors, driven by the return of the inflation boomerang, pushing the term premium higher. This measure is approaching levels not seen since 2008, as indicated by tradeable forward OIS rates rather than the "academic" term premium.

A bear steepening poses specific challenges in the current environment. Firstly, the Reverse Repo (RRP) has played a critical role in bolstering risk assets amidst a rapid rate-hiking cycle and ongoing Quantitative Tightening (QT). The Treasury's shift towards short-term bills enabled Money Market Funds (MMFs) to access over $2.5 trillion in RRP liquidity to finance government operations. This prevented excessive public issuance from overshadowing other assets, supporting rallies in stocks and bonds. However, the decline of the RRP, possibly to zero, indicates that total reserves are nearing their lowest comfortable level, estimated at $2.5 to $3 trillion. Currently, domestic RRP levels have fallen to as low as $327 billion, marking the lowest levels since June 2021, with total reserves and RRP combined just over $4 trillion.

As Reverse Repo declines and yields on 6-month and 12-month bills rise, bills become more appealing to Money Market Funds compared to the RRP facility. Seasonal tax payments may have contributed to the recent decrease, but the facility's clear downward trend and growing volatility shouldn't be overlooked. Historically, perceived non-risks have transformed into real risks when vigilance wanes, which might be the case now. Previous funding episodes have witnessed a sudden drop in funding volumes just before a rapid increase, akin to a tsunami wave. A further decline in total reserves + RRP, along with FED funds volumes, could signal emerging funding problems.

For equity investors, higher yields pose a threat to US stock market breadth, worsening existing concerns. Breadth measures have declined to levels similar to those seen in November, with fewer stocks reaching new highs on the NYSE and S&P 500. Additionally, the percentage of S&P stocks with RSI below 30 has reached 6-month highs.

Since last summer, there's been a strong inverse relationship between the 10-year yield and the percentage of S&P stocks trading above their 200-day moving average. Currently, breadth on this measure is higher than expected based on this relationship, suggesting that further increases in yields could lead to more S&P stocks weakening.

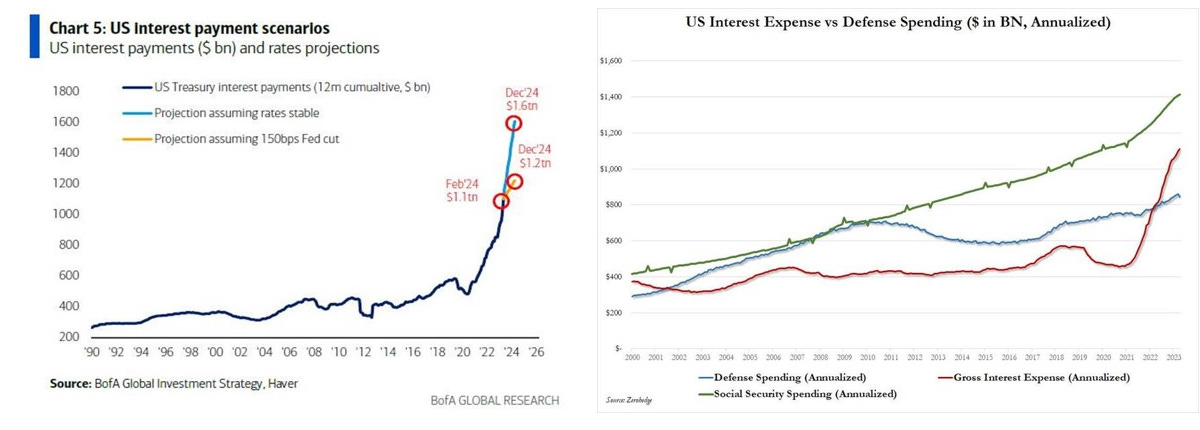
Meanwhile, total US interest expenses continue to soar. After exceeding total annual defence spending about a year ago, the interest on US debt is on track to become the single largest government outlay, surpassing social security by the end of 2024, reaching $1.6 trillion. This makes interest payments the largest spending category in the US government.
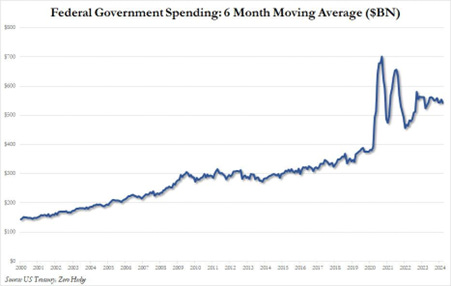
Rising yields and their impact on US government interest payments compound the challenge posed by consistently high monthly outlays, which surged to $568 billion in March from $567 billion in February, marking the highest monthly spending total in 2024. This results in a 6-month moving spending average (for smoothing purposes) of $542 billion. One can only speculate about the trajectory of the chart below during and after the next recession.
On the government income front, the US federal government receipts, standing at $4.580 trillion on a 12-month rolling basis, have declined by 5%. This suggests that the US economy might not be as robust as the ‘Forward Confusion’ narrative spread by ‘Bidenomics’ suggests to investors and voters.

In a nutshell, the US doesn't have a tax collection problem but a spending problem. No amount of tax changes will fix it; higher taxes may only drive more billionaires to tax havens like Dubai. Putting the year-to-date deficit in context, in the first six months of fiscal 2024, the US deficit reached $1.065 trillion, just shy of the $1.1 trillion last year, which was the 2nd highest on record after the post-COVID 2021. Annualized, the total deficit is expected to hit $2.2 trillion in fiscal 2024, despite the US supposedly "growing" at around 2.5%. One can only imagine the GDP growth if the US didn't have such a wartime/crisis deficit.

The unsustainability of US fiscal policy is vividly illustrated by the fact that any great power spending more on debt service (interest payments on the national debt) than on defence will not remain great for long. This historical pattern, seen in past empires like Hapsburg Spain, ancien régime France, the Ottoman Empire, and the British Empire, is about to be tested by the US. According to the CBO, net interest outlays will the largest spending of the US government this year, and this gap is projected to widen rapidly in the coming years. By 2041, interest payments are expected to double the defence budget. Comparatively, between 1962 and 1989, interest payments averaged 1.8% of GDP, while defence spending was 6.4%.

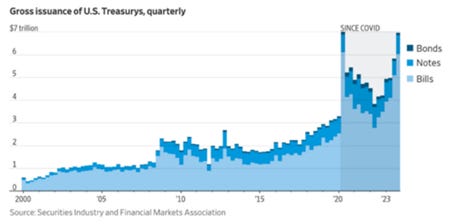
Based on this data, it's no surprise that quarterly Treasury issuance, to be updated by Janet Yellen this coming Monday, is nearing peak COVID levels. Despite this, the current administration maintains that the country isn't in an emergency state and enjoys a healthy economy. Meanwhile, the swelling percentage of short-term bill issuance suggests difficulty in selling longer-term notes and bonds, a historical pattern seen in countries facing sovereign debt crises.
Apart from the FED funds rate, the balance sheet is another tool used by the FED to inject shadow liquidity behind the scenes. On March 20th, 2024, Powell indicated their readiness to reduce Quantitative Tightening to ensure sufficient liquidity in the system, referencing the 2019 Repo market blowout. This move is likely influenced by Lori Logan, the Dallas FED Governor, who is well-versed in monetary plumbing and recognizes its shortcomings. Currently, the FED is reducing its balance sheet by $60 billion per month via QT, with expectations that this amount will be halved soon. However, thanks to the use of RRP and the TGA, the USD liquidity index proxy has remained relatively stable since the end of 2022. This stability was a key driver of the equity market rally last year.
S&P 500 Index (Blue line) Versus Fed Balance Sheet – TGA - Reverse Repo Account (Red line)

Even further behind the scenes, on March 5, 2024, the ISDA urged the FED, FDIC, and OCC to reform the supplementary leverage ratio (SLR) by permanently excluding on-balance-sheet U.S. Treasuries from total leverage exposure, consistent with the scope of the temporary exclusion for US Treasuries implemented in 2020. In simpler terms, ISDA suggests a permanent framework for banks to continuously fund US Treasury issuance and deficits. This would essentially imply a ‘Ponzi QE infinity’, allowing banks unlimited capacity to purchase Treasury debt. While not yet implemented, the ISDA's proposal suggests a significant development towards complete debt monetization.

With the FOMC meeting on the horizon, investors are questioning whether the FED is coughed off guard in its 'Forward Confusion' narrative. While institutions may convey stability, it's the markets that truly reflect economic and financial conditions by pricing in future expectations. Despite attempts to paint a rosy picture, more investors are recognizing the monetary trap the FED finds itself in. Over the past 18 months, three crises have shaken sound money assets:
the UK Gilt crisis in October 2022,
the Silicon Valley Bank/Regional Bank crisis in March 2023,
and the abrupt rise in the 10-year U.S. Treasury yield above 5% in October 2023, prompting dovish talk and a soft pivot from the FED signalling an end to the rate hike cycle.
Gold, silver, and other commodities, albeit to a lesser extent, are reacting to the gargantuan fiscal deficit and an inevitable upcoming sovereign debt crisis, given their 'non-confiscability' and lack of counterparty risk, especially for Gold.

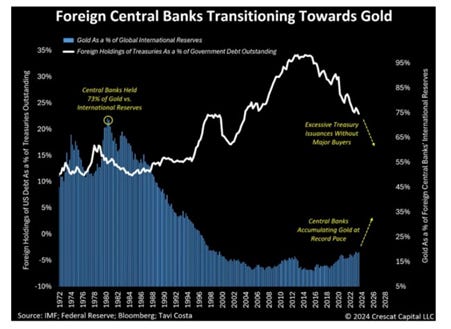
This move in ‘sound money’ asset is unprecedented, as evidenced by recent changes in the price of gold compared to the "real yield" on the U.S. 10-Year bond. It should be clear by now that gold has been sniffing out the global debt and fiscal problems that lie ahead for the US and other western governments. This trend has also been reinforced by the escalating war cycle, which has prompted foreign central banks, especially in the BRICS countries, to buy physical gold rather than US Treasuries since the weaponization of USD assets.
Gold Price (blue line); US 10-Year Real Yield (axis inverted; red line) & correlation.

Investors have to understand that Gold is and has always been a hedge against government risks, and this recent trend in gold is the best example of how investors are now clearly understanding that the FED has become impotent and interest rates no longer have such a strong impact given irresponsible government spending. This echoes the 1970s, when gold rose despite higher interest rates amid war and supply constraints. The change in gold price behavior also demonstrates that the economic conversation is changing, and investors are starting to understand that government bonds, once perceived as risk-free assets, are no longer free of risk. On that matter, the UK Gilt crisis in the Fall of 2022, when Liz Truss proposed tax cuts and spending increases, followed by a severe sell-off in the UK Gilt (bond) market and weakness in the British Pound, is the perfect example of the loss of trust investors have in public institutions. As a reminder, prime Minister Truss (via the Bank of England) was forced to reverse these policies to stop the market rout, and she also lost her job.

Therefore, it's increasingly clear that the issue of debt sustainability is looming and likely to be the trigger of the next crisis sooner rather than later. During COVID, the debt/GDP ratio for much of the developed world skyrocketed. Fiscal expansion pushed debt higher while GDP contracted, impacting both the numerator and denominator. The recovery from the COVID recession brought some balance as rapid nominal GDP growth, fuelled by inflation, mitigated some of the denominator effect. However, as growth slows below trend, attention will turn to the numerator, or debt level. Debt levels in developed markets suggest a significant risk of unsustainability.

The uncomfortable truth is that there's no simple answer to the debt/GDP challenge. Debt sustainability isn't determined by a clear threshold; it's a nuanced issue. With the average maturity of developed market sovereign debt between 5 and 10 years, governments are still adjusting to higher nominal rates after a decade of low or negative rates. This adjustment will lead to rising debt-servicing costs. Rough projections indicate that interest expenses as a share of GDP globally are expected to increase from 2.5% to 3.5% on average by the end of the decade.

The gap is most evident in countries with the highest debt levels, such as the US, France, and the UK. France, in particular, exemplifies the looming debt trap. As the second-largest economy in the euro area, its fiscal stability concerns could have broader ramifications. Recent figures show France's debt/GDP surpassing Spain's but remaining below Italy's, which is nearly 140%. Italy's fiscal position has been a market concern for decades, indicating there's no simple threshold measure. Italy would require a primary surplus to stabilize its debt level, with its average primary surplus at 1.5% during the post-GFC, pre-Covid decade. The bad news for France is that contrary to Italy, the US, Switzerland, Japan, and Korea, most of its debt is own by foreigners which explain while France will be among the firsts to fall into the incoming debt trap.
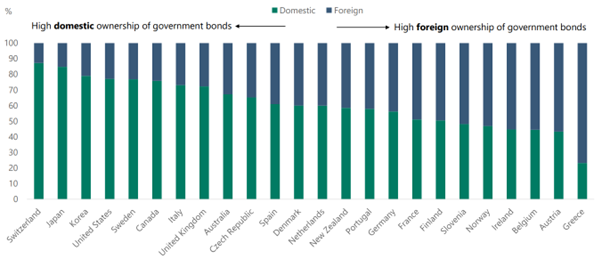
The good news for the US is that it has high domestic ownership of its government bonds. However, while the FED was raising rates, households were significant buyers of US treasuries, though this trend has started to reverse as the economy slowdowns.

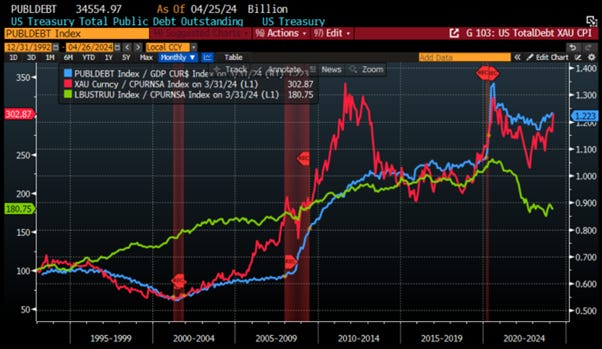
The bad news for holders of US treasuries is that a higher debt-to-GDP ratio is inflationary. In an environment where debt-to-GDP is set to rise and reach new historical highs, on an inflation-adjusted basis, Gold, NOT government bonds, will emerge as the new antifragile asset.
US Total Debt to GDP ratio (blue line); Value of $100 invested on December 1992 in Gold (red line) and US Bonds (green line) adjusted to US CPI.
The rising total debt-to-GDP ratio highlights the stark contrast between the principles that drove the founding fathers of the United States to seek independence from the British monarchy and the current state of affairs. This contrast is best exemplified by comparing the Constitution of the United States, which spans a mere four pages, to the Code of Federal Regulations, which has ballooned to over 185,000 pages.

Looking back at history, when governments grow to disproportionate sizes, it never ends well. The longest-reigning empire, the Roman Empire, fell as a direct result of an oversized and plutocratic public sector that bankrupted Rome. The private sector produces economic growth, while the government is a public servant consuming the wealth generated by others. The US empire will face the same fate, likely disguised by dragging the world into a war that the BRICS and their partners do not want.

While it should now be clear that the ‘smart money’ is coming to understand that the FED is caught off guard and the U.S. government's fiscal situation is out of control, people and investors will lose even more trust in public institutions. Indeed, many people already sense that something is wrong, and they are moving to protect themselves against government risk. The unpopularity of the current US president is just a symptom of that. In this case, it should not be a surprise that trust in public institutions is now around the level of the US population the government employs (20% of the population).

This sentiment is further underscored by the recent decision of Costco, the second-largest US retailer, to sell gold bars and explore expanding into selling silver bars and coins as well.

When building a diversified portfolio, seasoned investors understand the significance of diversifying their portfolios based on historical correlation between asset classes. Those same seasoned investors know that correlations are asymmetrical. In plain English, they behave differently in good times versus bad times. Essentially, diversification tends to work well when you don’t want it to (during rallies), but it fails to protect us during downturns. This challenges the traditional investment strategy of diversification, highlighting the need for a more nuanced approach to managing portfolio risk, especially in volatile markets. The most important thing to keep in mind is that return always wants its risk payment.

Like in the 1970s when the US government made big public investments, in the 2020s the government’s power had been driven by increasing borrowing and printing money to subsidize unproductive investments in renewable energy and to push societal preferences. Looking back at the performance of the different asset classes over the 1970s, this underscores the importance for investors to allocate a significant portion of their portfolio to gold and avoid exposure to government bonds.

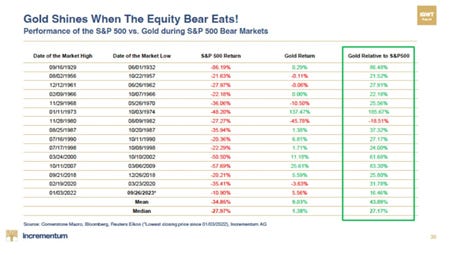
Another reason why investors should own physical gold in a private vault and not government bonds in their portfolios is that physical gold performs extremely well during equity bear markets. As capital looks for a new home when investors realize that the purported risk-free asset (i.e. government bonds) is no longer free of risk, the capital allocated to fixed income will have to find a home in an antifragile asset, which is physical gold and none other.
While central banks have been accumulating gold since the weaponization of USD assets, they still have a long way to go to match the amount of physical gold they hold with that of US Treasuries in their reserves.
WHAT’S ON THE AGENDA NEXT WEEK?
As the first month of the second quarter ends, the week will be marked by various bank holidays in Japan, Europe, and China. It will be a busy macro week with the release of the US Treasury Quarterly Refunding Announcement, the China and US Manufacturing and Non-Manufacturing PMI data. The ‘Labor Day’ celebration will coincide with the FOMC meeting just ahead of the release of the April Non-Farm Payrolls report to end the week. From a microeconomic perspective, the week will see the second leg of the earnings season for the Mag7, with Amazon releasing its Q1 2024 results on Tuesday, while Apple will be in focus on Thursday. Other companies releasing quarterly earnings include Paramount Global, AMD, McDonald’s, Qualcomm, Devon Energy, and Cheniere Energy.

KEY TAKEWAYS.
As the spring season in the northern hemisphere unfolds, here are the key takeaways:
The Bank of Japan decided to overlook the weakness of the Yen and deferred yet another inevitable rate hike until later this year.
The US GDP and Flash PMI data add to the long list of recent indicators pointing to the US being on the verge of an inflationary bust.
The US Core PCE data adds fuel to the return of the inflation boomerang as investors remain lured by ‘Forward Confusion’.
The earnings season confirmed that the rest of the year will be much more challenging for Corporate America, including most of the Magnificent 7.
The US economy, like most Western economies, is relying on unsustainable gargantuan fiscal stimulus to grow.
More government control will continue to drive unproductive spending, fuelling inflation and inevitably leading the Western world into a sovereign debt crisis and ultimately an ‘inflationary bust.’
Whatever the FED decides, whether it's a cut, no cut, or even a hike, another alphabet soup of liquidity program will likely emerge to support gargantuan fiscal deficits.
With the recent adoption of the illegal REPO Act authorizing the confiscation of Russian assets to finance the ‘Ukrainian war effort’, the weaponization of the USD has reached a new level, which will have dramatic long-term consequences for European and US banks.
As governments seek to increase their control over their citizens, trust in public institutions will continue to decline, leading investors to move even more into assets with no counterparty risk and which are non-confiscatable, like physical gold.
For fixed income investors who are still chasing the long duration trade, more pain awaits as long-dated yields must reflect the new stagflation reality.
In a stagflation, the best way to protect wealth is still to own the equity barbell portfolio made of Tech and Energy and Physical Gold and avoid long dated bonds.
As stagflation rather than recession materializes as the economy is increasingly weaponized, investors should prepare their portfolios for HIGHER volatility.
In this context, investors should also remain prepared for dull inflation-adjusted returns in the foreseeable future.
HOW TO TRADE IT?
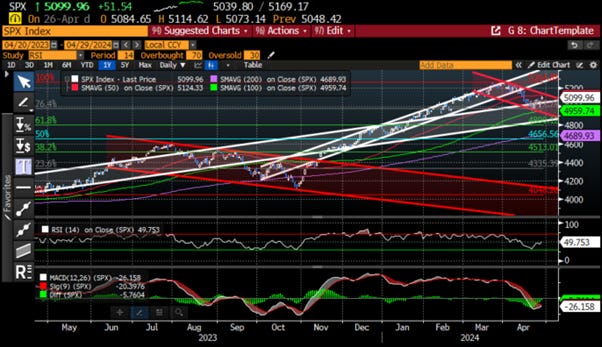
Under the pink moon over the northern hemisphere, stocks registered their first positive week after three consecutive weeks of losses. This rebound was mostly driven by Alphabet and Microsoft's stellar results, as they seem to be the only two companies capable of delivering profitable growth in the ongoing AI revolution. This allowed the Nasdaq to outperform the S&P 500 and the Dow Jones, which struggled with disappointing results from Caterpillar, Boeing, and Intel. However, it is too early for the bull to shout victory, as the S&P 500 failed to close the week above the 50-day moving average, which from a technical standpoint could mean that the past week's rebound is a head fake that could be reversed with a deterioration of geopolitical and macroeconomic data in the next few weeks.
Amid the current circumstances, it's not surprising that growth sectors such as IT, Consumer Discretionary, and Communications Services led the rebound last week, while cyclical sectors like Energy and Materials lagged behind.

As signs of an inflationary bust continue to spread despite the "Forward Confusion" spread by the FED, the Biden Administration, and Wall Street and a geopolitical black swan event could be around the corner, investors should keep some ‘dry powder’ (USD cash) to prepare for a potential blip in equity markets by mid-May to increase their exposure to quality stocks. In the meantime, investors should avoid exposure to long-dated government bonds and financials, which are likely to be the main casualties of the upcoming stagflation.
At The Macro Butler, our mission is to leverage our macro views to provide actionable and investable recommendations to all types of investors. In this regard, we offer two types of portfolios to our paid clients.
The Macro Butler Long/Short Portfolio is a dynamic and trading portfolio designed to invest in individual securities, aligning with our strategic and tactical investment recommendations.
The Macro Butler Strategic Portfolio consists of 20 ETFs (long only) and serves as the foundation for a multi-asset portfolio that reflects our long-term macro views.
Investors interested in obtaining more information about the Macro Butler Long/Short and Strategic portfolios can contact us at info@themacrobutler.com.
Unlock Your Financial Success with the Macro Butler!

Disclaimer
The content provided in this newsletter is for general information purposes only. No information, materials, services, and other content provided in this post constitute solicitation, recommendation, endorsement or any financial, investment, or other advice.
Seek independent professional consultation in the form of legal, financial, and fiscal advice before making any investment decisions.
Always perform your own due diligence.