THE WEEK THAT IT WAS...
The last week of the last month of the second quarter was probably the calm before the storm for macroeconomic indicators, as investors' focus was only on the PCE core index, inflation, and consumer sentiment expectations in the US. The week also saw another round of Treasury auctions. Finally, the FED delivered another unexciting round of bank stress tests results while the US presidential race turned into a circus.
The FED bank stress tests were just another way for the FED to whistle Dixie to investors' ears that everything is sound and stable in the US banking sector while the reality is much more dire as all seasoned investors know. While every firm passed, results varied among them. At JPMorgan, the biggest US bank, the CET1 ratio would decline to 12.5%, from 15% at year-end under the stressed scenario. Among the megabanks, Wells Fargo’s CET1 fell to the lowest level at 8.1%, from 11.4% at year-end. That they’re so far above the minimum is likely to bolster their case against additional dramatic capital increases.
According to the FED, a ‘severe recession’ would result in projected losses of $684 billion. Total loan loss rates vary significantly across banks, ranging from 1.3% to 18.7%, due to differences in loan portfolio compositions. For instance, loss rates range from 2.3% on domestic first-lien mortgages to 17.6% on credit cards, reflecting the varying sensitivities and historical performance of these loans. Some loan portfolios, sensitive to home prices or unemployment rates, may experience high loss rates due to significant stress on these factors in the adverse scenario. Looking at the full list of projected loan losses for the 31 banks in the stress test, it is remarkable that Goldman Sachs, once considered the master of the universe, now has the second crappiest, ‘subprimiest’ credit card portfolio among all US banks; only Ally Bank fares worse.
Probably more entertaining was the debate between the supposed two candidates for the US presidential election, which CNN proudly announced as the first debate ever to take place BEFORE each candidate was actually nominated by their respective parties. As most would have already understood, the reason for this was to set the stage for Democrats to move to replace Biden, probably by Hillary. CNN moderators did an amazing job of being unbiased. This debate revealed that Biden often struggled to speak, and his closing argument was truly pathetic.
This was not a slam dunk for Trump either. The lies discussed were so deep you needed a raft, not a shovel to navigate them. Indeed, investors know that inflation rose during the 1960s and broke the Gold Standard due to the Vietnam War. All the money Biden authorized for war and climate change drastically altered the economy, plain and simple. Even FED Chairman Powell in December stated that Biden's spending is ‘unsustainable,’ yet every word about inflation was just a lie. While Biden is clearly not capable of standing for a second term, it's not that everything is rosy with Trump. He just looks like the lesser of two evils.
While absolutely nobody cared about the final Q1 GDP print, there were two notable things about it. First, the headline number came in fractionally higher than last quarter's downward revised print, with an annualized increase of 1.4%, up from 1.3%, right in line with estimates. However, while the overall GDP print was higher, the composition was decidedly uglier, with Personal Consumption unexpectedly sliding from a 2.0% annualized number to just 1.5%, missing the 2.0% expectation. This confirms what recent earnings reports from McDonald's, Coca-Cola, Walgreens, Levi Strauss, and Nike have made very clear: the US consumer, the pillar supporting 70% of GDP growth, is cracking. Investors should stay away from consumer-related stocks, except for supermarket discount companies catering to the needs of an increasing number of distressed consumers.
The FED's favourite inflation indicator, Core PCE, rose 0.1% MoM in May (after a revised +0.3% MoM for April) but was in line with expectations. The headline PCE Price Index was unchanged MoM as expected, as Durable Goods deflation offset surging Services costs. However, on a YoY basis, the so-called SuperCore PCE slowed to 3.39%, which remains stubbornly high and well above the FED’s 2% target.
The final print of the University of Michigan consumer survey in June saw a surprising increase in sentiment and a decline in inflation expectations from 3.3% to 3.0% for one-year expectations. However, overall sentiment was lower MoM, with the headline dropping from 69.1 to 68.2, and the biggest drop was related to current conditions.
Overall, the last week of the second quarter in 2024 will be remembered for delivering surprisingly steady Treasury auctions for 2;4 and 7 year papers. However, before investors get too excited, they should remember that the US Treasury still has more than $5 trillion to refinance, in addition to the $1.4 trillion fiscal deficit recently updated by the CBO.
In this context, while the FED and the Biden administration are still attempting to smooth over the data and entertain Wall Street’s myopic dreams of a FED pivot, more and more seasoned investors are understanding that this will change nothing in the end game. These investors realize that the FED remains impotent to solve the economic problems created by Keynesian policies.
For the bond market, this would ultimately mean that the yield curve would un-invert at the long end as the bear steepener, driven by bond vigilantes roars over the Summer.
Seasoned investors know that financial markets are filled with stories of greed, bubbles, and impostures, all created to satisfy investors' greed. These rational investors also understand that when something seems too good to be true, they should be extremely cautious, as there is likely something brewing behind the scenes aimed at exploiting those eager to get rich quickly. Unless you have been living under a rock for the past 18 months, you must be aware that the latest equity bull market has been driven by a handful of companies capitalizing on the AI narrative. While from Wall Street's point of view everything seems magic with AI, the reality behind the curtain is much gloomier.
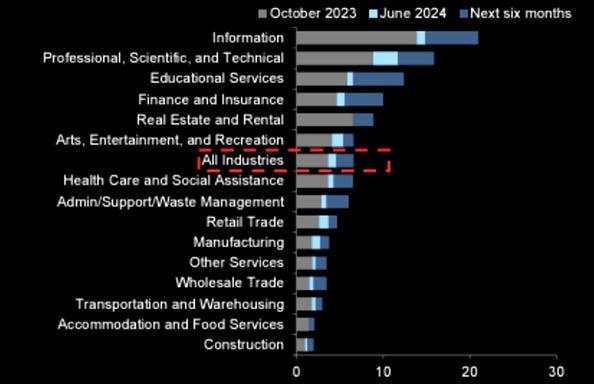
Indeed, more and more businesses are finding out that AI is not magic. Based on a recent survey conducted by Census Bureau, only 5% of companies in the US are using the technology. Of course, some sectors like IT and Education have already are already using much more AI than this American average, some sectors like Accommodation; Food Services and Construction almost have not yet uses AI so far.
Further down the value chain, away from Nvidia's glow, signs of discontent are emerging. Businesses are cutting back on new AI tools due to concerns about hallucinations, costs, and data security. The proportion of global companies planning to increase AI spending in the next 12 months has dropped to 63% from 93% a year ago, according to a survey of 2,500 business leaders by Lucidworks Inc. if we were to measure the malaise with the Gartner Hype Cycle, AI would be deep in the ‘trough of disillusionment’.
Gartner’s chart shows that new technologies often follow a path to a ‘plateau’ once their true usefulness is recognized. To reach this point, tech companies must identify where their hype has faltered. The issue isn’t overestimating AI’s capabilities but presenting it as too general-purpose. Leaders like Sam Altman of OpenAI and Demis Hassabis of Google pursued the ambitious goal of artificial general intelligence (AGI), which refers to computers surpassing human abilities to solve all problems. Unlike the clear, specific aims of companies like Salesforce or Netflix, the lofty AGI goals have become so grand that they've lost meaning, with promises ranging from creating abundant wealth to solving climate change and curing cancer. In this environment, tech leaders should be wary of Nvidia Corp.'s rapid rise. Indeed, the mega-tech companies, which were once very ‘capital light,’ are increasingly becoming more capital intensive. This shift raises the risk that depreciation expenses could become a significant challenge for their earnings growth in the years ahead.
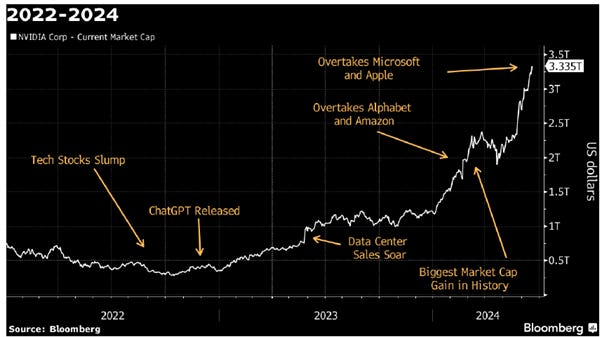
On the other hand, the AI rally has made Nvidia one of the world's most valuable companies, selling coveted AI chips to a few cloud giants benefiting from the AI hype. However, the outlook is not as rosy as it looks like. Sustaining this growth will be challenging for Nvidia, even as it ventures into software sales.
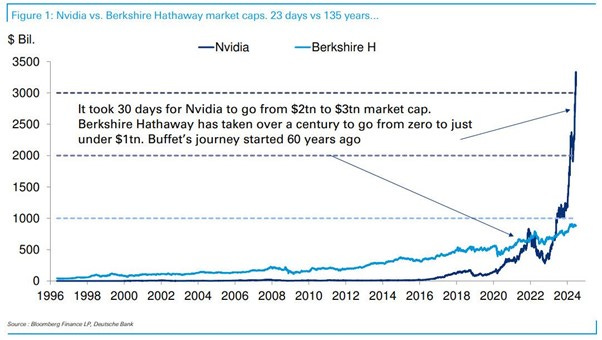
To put the ‘Jensanity’ surrounding Nvidia's recent stock market performance into perspective, the company added $1.0 trillion in market cap over just 32 trading days. This six-week gain surpassed the total market cap of Berkshire Hathaway, a company Warren Buffett spent six decades building and was not been able to bring the $1.0 trillion.
The reality is that the outlook for easy money has historically attracted fraudsters, who are always smart enough to take advantage of investors' greed as they follow Wall Street headlines without questioning what is really happening behind the scenes and what is rationally realistic about long-term expectations. The last time investors had to deal with this kind of craze was during the dot-com era. For those old enough to remember, the dot-com bubble, while it seeded the development of the internet economy, was also ripe for fraudulent accounting practices.
Outside Earnings From Operations which was ‘invented’ by Nortel in the midst of the Dot com bubble, one of the oldest magic accounting tricks and which is not illegal but raise questions is roundtripping sales.
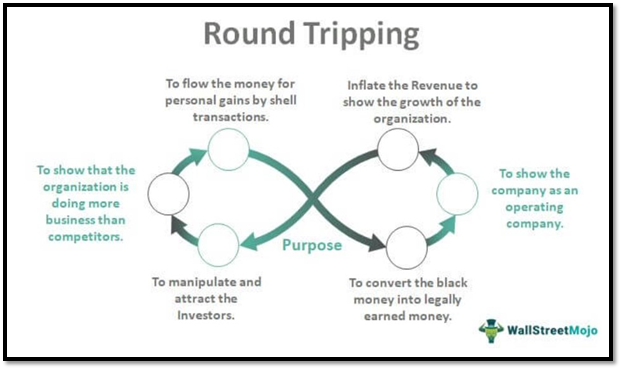
Round-tripping sales is a method of inflating revenue by artificially boosting sales figures. It occurs when one company buys from another company with the agreement that the latter will use the same amount of money to buy from the former. This creates a circular transaction with no net economic substance but may be fraudulently reported as a series of productive sales and beneficial purchases on the books of the companies involved.
There are several ways round-tripping sales can be employed:
To inflate revenue: Company A sells an asset to Company B, and then Company B sells the same or a similar asset back to Company A for about the same price. Both companies record the transactions as revenue, even though no real profit has been made.
To manipulate stock prices: By artificially inflating trading volumes or creating the illusion of liquidity, companies might engage in round tripping to make their stock more attractive to investors.
To move money across borders: Round tripping has been used to take advantage of differing tax systems or to bring back offshore funds without attracting the usual tax implications.
In layman’s terms, round-tripping can be defined as a form of barter where a company sells an unused asset to another company and simultaneously agrees to buy back the same or similar assets at approximately the same price. This swapping of assets in a round-trip transaction results in no real economic gain but may be falsely recorded as productive sales and beneficial purchases on the companies’ books, violating the accounting principle of substance over form. Despite appearing busy and growing, companies engaged in round-tripping do not generate genuine profits. This illusion of growth has historically attracted speculative investors and temporarily inflated the market capitalization of firms like Enron, CMS Energy, Reliant Energy, Dynegy, and Wirecard.
https://www.newyorker.com/magazine/2023/03/06/how-the-biggest-fraud-in-german-history-unravelled
To detect and prevent round-tripping sales, regulatory bodies and investors should watch for the following red flags:
Unusual or suspicious transactions: Transactions that are unusually large, frequent, or irregular may indicate round tripping.
Lack of economic substance: Transactions lacking economic substance, such as buying and selling the same assets, may indicate round tripping.
Inconsistencies in financial reporting: Inconsistencies in financial reporting, such as unusual changes in revenue or profit figures, may indicate round tripping.
The reason to look at round-tripping sales is that the Nvidia miracle, as the Wall Street mass media have called it, seems in many aspects too good to be true.
Let’s start by examining the new trend in the lending market. Investors know that in lending, as in all things, necessity is the mother of invention. Regardless of the rate, lenders want to lend, and borrowers want to borrow, often both sides overdoing it. In the era of higher-for-longer interest rates and the ongoing supposedly AI revolution, the latest collateral trend is the artificial intelligence chip itself. For example, in early May, Blackstone led a $7.5 billion round of financing for CoreWeave, an emerging AI cloud computing provider backed by Nvidia. For those who are not familiar with CoreWeave, it uses software and automation to deliver efficient and high-performance infrastructure tailored to the specific needs of AI engineers and innovators.
https://www.coreweave.com/about-us
In this latest round of financing, CoreWeave , Blackstone and Magnetar Capital used Nvidia's graphics-processing unit (GPU) chip as collateral. According to the Wall Street narrative, Nvidia currently struggles to meet the demand from major players like Amazon and Microsoft. These companies are heavily investing in GPU chips, driving prices sharply upward. In this environment, over $10 billion has been raised using GPU chips as collateral. Startups in the AI sector, despite rapid growth, are not yet profitable. As a result, interest rates on loans are in the low double digits. As traditional lenders, who typically offer lower rates, have avoided this sector, asset-based lenders, commonly used by small businesses and real estate developers, are stepping in to finance this high-flying technology niche.
https://www.wsj.com/tech/ai/how-wall-street-lenders-are-betting-big-on-the-ai-boom-25b38259
For the record, Magnetar Capital played a key role in the 2008 financial crisis by creating and investing in mortgage-backed securities (MBS) and collateralized debt obligations (CDOs). This contributed to the housing bubble by increasing demand for subprime mortgages, which inflated the value of these securities and allowed Magnetar to profit significantly.
Focusing on the short history of Nvidia, it was founded on April 5th, 1993, and initially operated in obscurity. It wasn't until 1999, when Steve Jobs had recently returned to lead Apple, that this semiconductor startup began to attract attention from investors. Nvidia quickly gained momentum, with its stock surging over 1,600% between its inception and its entry into the S&P 500, reaching a market value of approximately $8 billion. This growth occurred amidst a downturn in many other technology stocks following the dot-com bubble peak in March 2000. Nvidia's early success was driven by its technology being integrated into popular video-game consoles such as Microsoft’s Xbox and Sony’s PlayStation. The GeForce graphics processing units (GPUs) developed by Nvidia became highly sought-after among gamers due to their ability to consistently deliver the most realistic gaming experiences.
In late 2001, after being one of the best performers in the US stock market, Nvidia entered the S&P 500 index, replacing the once-darling energy giant Enron, which moved into bankruptcy after its accounting frauds were exposed.
https://www.gamedeveloper.com/game-platforms/nvidia-replaces-enron-on-s-p-500
Over the next six years, Nvidia faced setbacks. The stock plunged in 2008 due to the financial crisis and increased competition from Advanced Micro Devices Inc. A partnership disagreement with Intel further strained Nvidia's prospects, leading to its exit from a major market. In 2011, Nvidia settled with Intel for $1.5 billion. In 2012, Nvidia introduced data center graphics chips for complex computing tasks like oil exploration and weather prediction. Despite potential, these chips initially saw slow adoption. It took nearly nine years for Nvidia shares to regain their 2007 highs.
Nvidia's shares surged again in 2015 as its chips became foundational in emerging technologies such as advanced graphics, autonomous vehicles, and AI products. Despite a downturn in cryptocurrency mining demand, Nvidia's data-center sales continued to grow. The Covid-19 pandemic further boosted this segment, as companies sought additional computing power for remote work. Nvidia's data-center revenue multiplied eightfold from fiscal 2017 to fiscal 2021.
In 2022, Nvidia's shares fell with the tech sector due to higher interest rates and reduced post-Covid demand. The release of OpenAI's ChatGPT initially stirred interest, leading to a surge in orders for Nvidia's chips by early 2023. Nvidia's first-quarter 2023 earnings shocked Wall Street with sales forecasts surpassing expectations by over 50%. Data-center sales outpaced gaming revenue for the first time in fiscal 2023, with analysts projecting sales to exceed $100 billion this fiscal year.
The main reason to discuss the potential use of round-tripping sales for Nvidia is due to the chip maker's stratospheric sales figures. This should prompt any investors to question the true nature behind these sales.
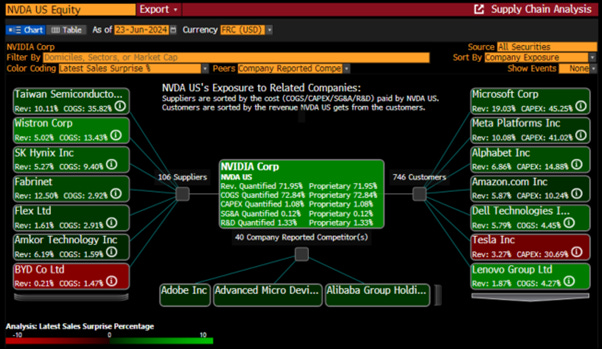
For those investors curious about Nvidia's revenue strategies and inclined toward investigation, they likely have heard about the strategy employed by Nvidia and the Wall Street community. This strategy involves 'subsidizing' AI startups by investing in them and then selling them GPU chips using Nvidia’s financial capabilities. Simply put, an investment bank and Nvidia invest in an AI startup, which then purchases products from Nvidia. This boosts the sales and revenue expectations of Nvidia, allowing it to raise sales guidance each quarter and drive its share price higher, thereby enriching shareholders who are related to the investment bank which helped to create the startup. In essence, the initial investment in the AI startup by the investment bank, even if the startup fails to deliver profits, is relatively small compared to the potential returns earned by shareholders of the product company. Nvidia and Wall Street investment banks have executed this strategy on a large scale, amplifying the illusion of the ‘AI exponential age’ narrative and have used this narrative to generate exponential returns on their investments in Nvidia shares.
A look at Nvidia's latest 10Q report reveals on page 13 that Nvidia defines its investments in non-affiliated entities to include marketable equity securities, which are publicly traded, and non-marketable equity securities primarily in privately held companies. As of April 28, 2024, the carrying value of its non-marketable equity securities totalled $1.5 billion, up from $1.3 billion as of January 28, 2024, and $493 million as of April 30, 2023. In summary, Nvidia invested $1.0 billion over the past year in non-affiliated entities that are, of course, purchasing its chips, and these investments have been funded by Nvidia’s free cash flow.
https://s201.q4cdn.com/141608511/files/doc_financials/2025/q1/NVIDIA-10Q-20242905.pdf
Since most of these non-affiliated entities are not listed, it is clearly difficult to assess the viability of these 'investments'. One example of a non-affiliated entity that has been under the media spotlight is Cohere. Cohere defines itself as believing in ‘the union of research and product to realize a world where technology commands language as compellingly and coherently as humans themselves’.
Outside of AI startups, one of the largest new buyers of Nvidia GPUs is Tether (USDT), which has been implicated in significant fraud within the crypto market. Tether has allegedly laundered $35 billion USDT through Sam Backman Fried's Alameda Research.
Investors do not need to perform forensic accounting to recognize red flags in Nvidia's results, which should prompt seasoned investors to ask questions. Examining basic accounting ratios reveals significant concerns that even novice accounting students would find intriguing. For instance, looking at Nvidia's Days to Inventory Outstanding ratio, a liquidity metric that measures how long a company holds its inventory before selling it, shows minimal change compared to six quarters ago. This ratio deteriorated significantly in 2023 at the same time that Wall Street was trumpeting that ‘AI is hot’. This should raise the first question: why hasn't Nvidia reduced its inventories if demand for its chips is so robust?
The second red flag is related to Nvidia's cash conversion cycle (CCC). The CCC measures how long it takes a company to convert its investments in inventory to cash. While the narrative suggests that the AI market is booming, Nvidia's results show that its CCC has been deteriorating over the past 5 quarters. In simpler terms, likely due to the economic slowdown and a prolonged period of higher interest rates, Nvidia's clients have been slower to pay the company over the past year.
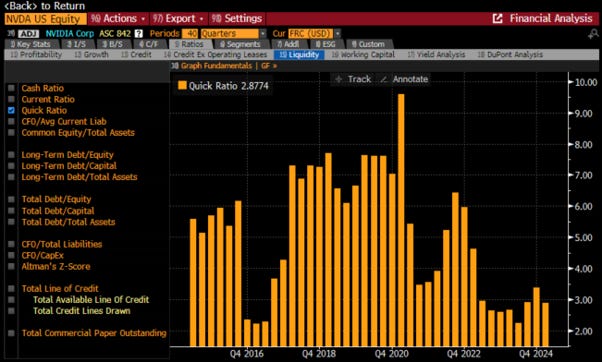
All of this is happening alongside a quick ratio that has not improved for more than a year. For those who are not familiar with accounting, the quick ratio is an indicator of a company’s short-term liquidity position. It measures a company’s ability to meet its short-term obligations with its most liquid assets.
Transitioning from the income statement to the balance sheet, Nvidia has experienced a notable rise in current liabilities and other short-term liabilities, contributing to an overall increase in total liabilities. The issue of rising liabilities, especially amidst the Wall Street narrative that interest rates are set to have peaked, and considering Nvidia's strong cash generation, raises questions about why these liabilities are being issued at this point in Nvidia's business cycle.
Indeed, Nvidia has continued to issue billions of short-term and long-term debts over the past quarters.
Bringing its weighted average debt duration to almost 13 years stands in stark contrast to the Wall Street narrative of expecting lower interest rates at the long end of the curve in the foreseeable future.
It is undeniable that Nvidia has been an extraordinary generator of free cash flow (FCF) over the past 2 years, although the 'quality' of this FCF is questionable. Was it subsidized by investments in non-related entities that created 'artificial' demand for Nvidia chips? Would all these AI startups have been able to start their businesses without the support of Nvidia and the Wall Street investment banks? Probably not.
One thing that is certain is that instead of being well-invested in R&D, this FCF has been funnelled back into share buybacks. Indeed, while Nvidia invested $2.7 billion in R&D expenses over the past quarter, it spent 6 times more or $16.8 billion on buying back its shares.
Of course, these share buybacks are also magically contributing to higher share prices and benefiting those on Wall Street who are among the largest shareholders of the company.
This brings us to another dark side of the Nvidia miracle. While Nvidia became one of the largest market capitalizations in the world, it's not widely reported by financial mass media that most Nvidia transactions occur on Dark Pools. For those unfamiliar, Dark Pools represent a fascinating yet enigmatic aspect of trading. These alternative trading platforms operate away from the public eye, gaining popularity among institutional investors seeking anonymity. Dark pools, also known as dark liquidity or non-exchange trading venues, are private forums for trading securities not accessible to the general public. Unlike traditional stock exchanges that provide transparency by displaying bid and ask prices and executing trades on a centralized platform, dark pools offer anonymity and confidentiality to participants. This opacity is achieved by withholding trade information until after execution, thereby masking trading intentions and minimizing market impact.
https://www.investopedia.com/articles/markets/050614/introduction-dark-pools.asp
Dark pools operate through electronic trading systems that match buy and sell orders anonymously. Participants submit orders to the dark pool, specifying price and quantity, and the system matches compatible orders based on predetermined criteria. Trades executed within dark pools are reported to the public exchanges after completion, often with a delay or in aggregated form. This preserves the anonymity of participants and helps prevent price disruption in the broader market.
https://fastercapital.com/content/Illuminating-Dark-Pools--The-Role-of-Third-Market-Makers.html
FINRA, Wall Street’s self-regulator, started releasing Dark Pool data in 2014. However, this data lumps together trading activity for each Dark Pool and its respective stocks over entire weeks, with delays of two weeks for big cap stocks and four weeks for smaller companies. The chart below illustrates the top eight Dark Pools that conducted the largest number of trades in Nvidia’s stock over a recent period, based on FINRA's available trading data. Interactive Brokers' Dark Pool consistently leads in trading Nvidia shares, followed by global banking giants UBS and JPMorgan in second and third place, respectively. Dark Pools owned by other major trading firms like Goldman Sachs, Morgan Stanley, and Bank of America’s Merrill Lynch also rank among the top eight. Notably, JPMorgan has been fined substantial amounts by multiple regulators for inadequate trade surveillance, but it’s unclear if its Dark Pools were involved.
In this environment, seasoned investors shouldn't be surprised that Wall Street isn't currently debating whether every investor should not own Nvidia. It's well-known among analysts that it's safer to be wrong with the crowd than to be right alone. Embracing the old Wall Street adage ‘Bulls make money, bears make money, pigs get slaughtered,’ the analyst community is now anticipating even higher price targets over the next 12 months for its AI darling.
One compelling reason investors should be cautious about the sustainability of the Nvidia miracle is Jensen Huang's current rock star-like adulation. History has shown that such adulation of CEOs in financial markets does not end well for investors.
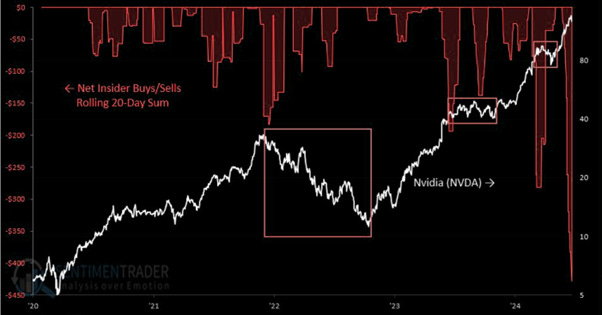
Last but not least, despite the optimistic environment portrayed to YOLO investors that Nvidia have limitless returns, Nvidia's insiders have been recently selling their shares at the fastest pace in years.
To satiate retail investors’ greed and complete the insanity built around Nvidia, on December 13th, 2022, the SEC approved the first ETF leveraged on a single stock. The GraniteShares 2x Long NVDA Daily ETF (NVDL US) seeks daily investment returns of twice the daily percentage change of Nvidia's common stock. This ETF, designed specifically for YOLO investors, has amassed over $4.0 billion in assets under management since the start of the year. Needless to say, those who were driven by greed will be the first to pay the price of the upcoming AI disillusion.
As noted before, major bubbles historically have been created by the 'smartest guys in the room,' not 'Joe Six Pack,' yet it's 'Joe Six Pack' who bears the consequences. Investors, in particular retail investors frequently ignore known risks to satisfy their speculative urges, causing significant disruptions in the global financial system. During the dot-com bubble, unscrupulous Wall Street bankers and CEOs of internet startups exploited the greed of retail investors to build economically unsustainable companies, creating what seemed like a new El Dorado at the time. Similarly, the current AI revolution is being touted as having profound impacts on everyone's future, but like past gold rushes, it likely has its own darker sides that will come to light once those orchestrating the narrative feel they've profited enough at the expense of retail investors who will be investing irrationally in this promised land for a better life. In the meantime, US households (i.e. retail investors) have turned more and more bullish on the equity market.
Once again Einstein’s definition of insanity which was doing the same thing over and over again and expecting a different outcome comes to light. Institutional and retail investors, fuelled by the Fear of Missing Out (FOMO) or the need to achieve higher returns in an environment where the cost of living is rising and value for money is diminishing, are irrationally investing in AI-related tech stocks without asking critical questions. Sanity dictates readiness for a potential rude awakening to the realities of the AI boom.
In conclusion, despite the Wall Street narrative proclaiming insatiable demand for AI chips, both big tech companies and startups struggle to generate sufficient revenue from AI to justify the costs of computing power. For those who experienced the Dot-com boom and bust, this story feels eerily familiar, and all investors, including those who studied this period in financial history books, recall how it ended.
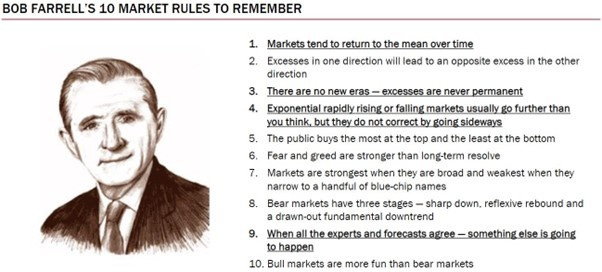
For portfolio allocators, with the US economy heading towards or already in an inflationary bust, it should now be clear that fixed income, particularly government bonds with a maturity of more than 12 months, is an increasingly risky asset class. Therefore, apart from physical gold, which is the new antifragile asset class for investors looking to preserve their wealth in this inflationary environment, they will have to be very selective in terms of their equity investments. Seasoned investors understand the concept of return to the mean. The Return to the Mean (RTM) investment theory, also known as Mean Reversion, is a financial concept that suggests asset prices tend to revert to their historical means or averages over time. This theory is based on the idea that extreme price movements are temporary and that assets will eventually return to their normal or average levels.
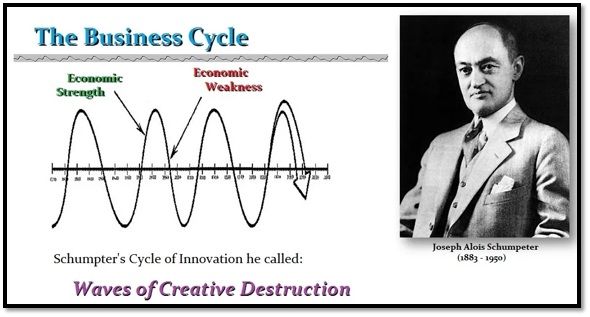
This concept is rooted in the real-life analogy of a slingshot, which is ultimately tied to the business cycle.
Rather than adhering to Keynesian theory, which has been associated with the failures of communist and socialist government policies, investors must grasp the dynamics of the business cycle and adapt accordingly. Politicians and central banks in the Western world, who have embraced socialist agendas leading to economic destruction, will need to confront this reality despite centuries of attempts to control and manipulate the business cycle.
In this context, when something is trading at almost 2 standard deviations below the 30-year mean, investors should always take note of the extremity of the trend. With the Dow/Nasdaq ratio returning to levels not seen since the dot-com bubble, it may be time to consider the end of the YOLO tech party.
Dow to Nasdaq ratio over the past 34 years; Mean and Standard deviations.
This is particularly true considering that, despite what investors hear in the financial mass media, real 10-year yields are only 100 basis points away from the level that triggered the burst of the same dot-com bubble.
Dow to Nasdaq ratio (blue line); US 10-Year Real Yield (red line) & correlation.
Additionally, with Treasury yields set to move structurally higher and the issue primarily lying with the government rather than corporate America, investors should consider using the Dow Gold ratio rather than the equity risk premium as an indicator for asset allocation. Currently resting around its 70-year mean, this ratio does not provide a clear signal on whether investors should overweight equities or physical gold in the new barbell portfolio, structured with 60% in equities and 40% in physical gold.
Dow to Gold ratio; mean and standard deviation since 1954.
Skilful investors know that profits are not realized until a position is sold. They also understand that there are times to buy and times to sell.
As Bob Farrell's rule number 5 highlights, ‘the public buys the most at the top and the least at the bottom.’ This is why investors with common sense should consider that the time to sell the Nasdaq and buy Dow Jones companies is now.
While we are not here to judge whether the dark pooled artificial accounting put in place by Nvidia is fraudulent or not, it should be clear that there are too many troubling signs for investors to ignore the risks they take by chasing the supposed AI financial rainbow in the current darkened economic environment.
In this context, the best hedge remains hold positions that do not require hedging. Any of the potential events mentioned above could present opportunities as significant as those seen during the lows of the Covid pandemic. Whatever you do, don’t panic at the exact moment everyone else does. Once it’s in the press, it’s already priced in. Therefore, investors should prepare ahead of time to be a counterparty for those who are panicking. How much liquidity will it take? More than your counterparties have.
WHAT’S ON THE AGENDA NEXT WEEK?
The first week of the third quarter will be a holiday-shortened week in the US, celebrating Independence Day on Thursday. However, it will be a particularly busy week for investors, focusing on PMI data in China and the US, along with the health of the US job market on Friday. The market will also pay close attention to the Federal Reserve Chairman's remarks on Tuesday and the FOMC minutes on Wednesday. On the political agenda, after the French go to the polls on Sunday for the first round of the parliamentary election, the Brits will do the same on Thursday for their general elections.
KEY TAKEWAYS.
As third quarter starts, here are the key takeaways:
The FED bank stress test was another whistle Dixie to investors' ears, suggesting that everything is sound and stable in the US banking sector. However, the main outcome is that Goldman Sachs, once seen as the master of the banking universe, has become the second most risky bank among the too-big-to-fail players.
The final print of the Q1 GDP confirmed that stagflationary pressures are rising, with growth on the verge of contraction as the consumer is now tapped out, while prices remain very sticky.
The May core PCE once again showed that core and supercore inflation is much stickier than most still expect.
Whoever the next tenant of the White House is, the US deficit will continue to rise, and inflation will remain stickier for much longer.
While presented as a financial miracle, the AI boom has many dark sides that are not exposed to investors.
Artificial intelligence is coupled with Artificial Accounting, which should raise investors’ eyebrows if the profits are not also artificial.
The use of dark pools brings another reason for investors to be worried if the AI boom is real or artificial.
The Dow to Nasdaq ratio is at a level that could trigger a slingshot move into an unloved and under owned segment of the equity market.
With continued decline in trust in public institutions, particularly in the Western world, investors are expected to move even more into assets with no counterparty risk which are non-confiscatable, like physical gold.
US Treasuries are now not only a 'return-less' asset class but, given their high correlation with equities, have also lost their rationale for being part of a diversified portfolio.
For income investors, rather than chasing long-dated government bonds, they should focus on USD investment-grade US corporate bonds with a duration not longer than 12 months to manage their cash.
In a stagflation, the best way to protect wealth is still to own the equity barbell portfolio made of Tech and Energy and Physical Gold and avoid long dated bonds.
As stagflation rather than recession materializes as the economy is increasingly weaponized, investors should prepare their portfolios for HIGHER volatility.
In this context, investors should also remain prepared for dull inflation-adjusted returns in the foreseeable future.
HOW TO TRADE IT?
The first half of the year ended with investors aggressively pricing in a Republican/Trump victory in November after the last Thursday farce in Atlanta. On the macro front, data continued to disappoint, concluding a first half of the year that saw the worst start for macro surprises since 2018. Despite the bad news and as the market starts to understand how to be invested in a stagflation, the S&P 500’s 15% gain is the best H1 performance in an election year since 1976. This performance was driven by tech stocks, with the Nasdaq outperforming other major US indices. Last week saw the first negative week for the S&P 500 since the last week of May. With bulls on thin ice and all roads leading to an inflationary bust, investors should prepare for much higher volatility in the coming weeks. The current complacency in the equity and bond markets is unlikely to last as the political environment becomes more uncertain. In this context, investors will continue to monitor the 50-day moving average as a key technical support to add companies that are part of the Barbell equity portfolio.
After weeks of underperformance, investors moved back into the Energy sector, which outperformed alongside Communication Services and Real Estate. Meanwhile, Consumer Staples, Utilities, and Materials underperformed.
As there are increasing signs that the US economy is heading into consumer-led stagflation, investors should remember the old Wall Street saying: ‘No one rings the bell at the market’s top.’ This is why so many investors got burned when the dot-com bubble burst and the GFC took everyone by surprise, despite all the signs of greed being present. However, those who learned from history and knew that defence was more prudent than the fear of missing out avoided most of the losses, and some even gained mildly from these crashes. Indeed, seasoned investors know that greed is the worst enemy of rational risk management. Given these considerations, investors should hedge their portfolios using decentralized assets free of counterparty risk, prioritizing the return OF capital over the return ON capital. The ultimate asset with no counterparty risk is physical gold. In a stagflationary environment, it is crucial for all investors, whether big or small, institutional, high net worth, or retail, to allocate 20% to 40% of their assets to physical gold stored outside the traditional banking system.
For investors looking to stay invested in equities, many indicators suggest a major rotation from Nasdaq retail-owned sectors to Dow Jones institutional-owned companies over the next quarters. With dark pooled artificial accounting being a catalyst for the perceived AI miracle, investors who want to remain in the technology sector as part of a barbell equity portfolio are advised to hedge their positions. Buying a 5% out-of-the-money put on the Nasdaq Index (QQQ US) with an expiry just before the end of the year can be done for a mere 2.5% premium.
For those believing in the slingshot theory, they can finance this put by selling an at-the-money put on the Dow Jones index (DIA US) with similar maturity, for a slightly higher premium. This trade is not suitable for every investor but should provide a decent hedge against the upcoming rising volatility that will impact equity portfolios.
At the end of the day, if the Nasdaq underperforms the Dow Jones in the second half of the year, even if both indices trend lower, those choosing this strategy will end up owning quality US companies that will benefit from rising capital flows from overseas investors fleeing their own domestic markets.
For fixed-income investors, owning government bonds in developed or emerging markets has become risky. In the current environment it is reckless to own government bonds with maturities over six months. That’s why investors should focus on investment-grade bonds issued by US corporations with an average maturity of less than 12 months.
At The Macro Butler, our mission is to leverage our macro views to provide actionable and investable recommendations to all types of investors. In this regard, we offer two types of portfolios to our paid clients.
The Macro Butler Long/Short Portfolio is a dynamic and trading portfolio designed to invest in individual securities, aligning with our strategic and tactical investment recommendations.
The Macro Butler Strategic Portfolio consists of 20 ETFs (long only) and serves as the foundation for a multi-asset portfolio that reflects our long-term macro views.
Investors interested in obtaining more information about the Macro Butler Long/Short and Strategic portfolios can contact us at info@themacrobutler.com.
Unlock Your Financial Success with the Macro Butler!
Disclaimer
The content provided in this newsletter is for general information purposes only. No information, materials, services, and other content provided in this post constitute solicitation, recommendation, endorsement or any financial, investment, or other advice.
Seek independent professional consultation in the form of legal, financial, and fiscal advice before making any investment decisions.
Always perform your own due diligence.
















Fascinating article and well researched.
From a layman's standpoint, not good. Don't believe the hype about the Inflation Reduction Act. The government's out of control spending, printing money, is hurting the American people's pocket book.