

European Debt Trap Ahead!


THE WEEK THAT IT WAS...
The first week of the second quarter of 2024 was all about PMI data as well as the health of the US job market with the report of the March non-farm payroll.
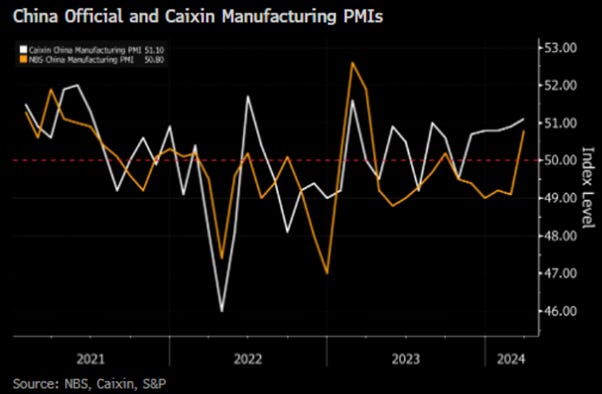
The China’s official and Caixin manufacturing PMI rose above expectations as improvement was driven by both production and demand sides with the output and new orders components rising further in expansionary territory. While this are encouraging signs for the Chinese economy, the key question is the sustainability of this ‘spring rebound’.
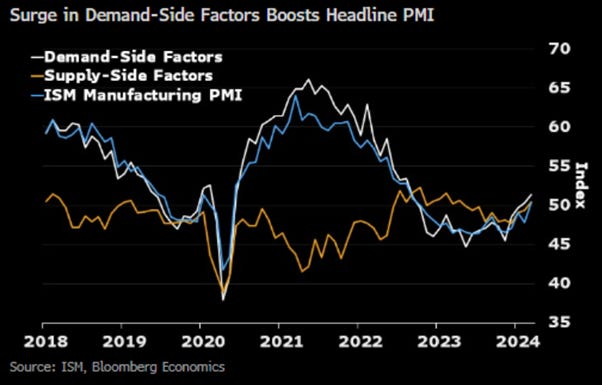
This was also not an April Fool's joke, but the ISM's manufacturing PMI surprised to the upside, rising from 47.8 to 50.3, better than the expected 48.4 and breaking a 15-month streak below 50.
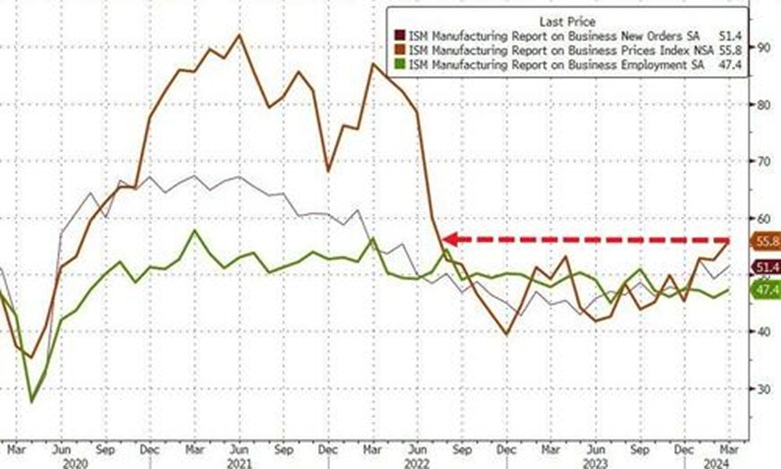
More importantly, for those who still dream of further immaculate disinflation ahead, the survey noted that higher oil and raw material costs, along with increased transportation rates, reportedly added to cost burdens at the end of the first quarter. Additionally, the impact of rising labour costs was mentioned as a factor pushing up selling prices at a number of manufacturers. While employment remains in contraction for the sixth straight month, Prices Paid surged to their highest level since July 2022.
While both the US Services PMI and US ISM services indices fell short of expectations at the headline level, the ISM services price paid decreased to its lowest level since March 2020. This is despite increasing wages and higher input prices associated with elevated commodity and transportation costs. This data added to the ‘Forward Confusion’ as consumers as well as investors know how expensive it is nowadays to go out for a drink or a bite in the US and elsewhere in the so-called developed world.

March delivered another robust US job report, with payrolls growing by 303k, surpassing consensus estimates of 214k. Government added 71k jobs, while the private sector contributed 232k jobs. However, despite being a major contributor to job gains, the government also saw the bulk of layoff announcements, hinting at a potential slowdown in government hiring. Health care added 72k jobs, leisure and hospitality saw a rise of 49k jobs, returning to pre-pandemic levels. Overall, employment in most other sectors remained largely unchanged. The unemployment rate fell to 3.8%, reflecting a rise in the labour force and a decrease in the number of unemployed individuals. Notably, part-time jobs increased significantly, while full-time jobs experienced a slight decline.

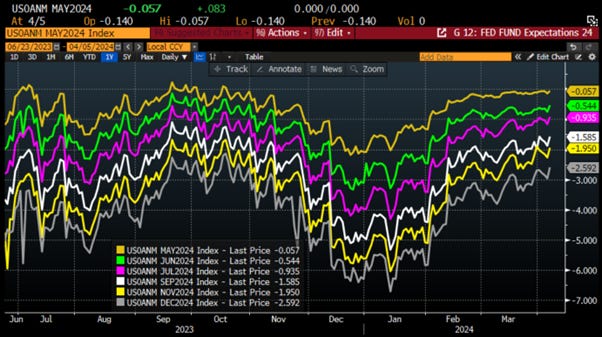
In a speech at Stanford Business School, Powell emphasized the new FED message that rate cuts are on the horizon but not imminent, citing uncertainty in the outlook as ‘’it is too soon to say whether the recent readings represent more than just a bump’’. Indeed, uncertainty looms large, especially in the aftermath of supply chain disruptions at the port of Baltimore and the recent earthquake in Taiwan, which has impacted semiconductor facilities. In the meantime, 'Forward Confusion', has led to declining expectations for rate cuts. With just about 50% probability of a 25-bps cut in June now priced by the market, the consensus starts to acknowledge the challenge the FED faces with potential inflation reacceleration by summer.
The more realistic scenario remains that the FED will, at best, only be able to keep interest rates unchanged for the year, as stagflation rather than a soft landing emerges by the summer with wars and social unrest adding to the long list of catalyst of stickier for longer inflation. If not for political considerations, the FED should raise interest rates to combat the incoming stagflation driven by the side effects of ‘Bidenomics’. The question remains: for how long will the consensus continue chasing the infamous pivot, especially when Wall Street has been wrong on that matter for almost 2 years?

Despite Powell keeping his politically correct stance of 'Forward Confusion' ahead of the US presidential election, the USD index formed a Golden Cross just post the FOMC meeting. Over the past year, we have observed two significant golden crosses, with one having a substantial positive impact on the dollar.
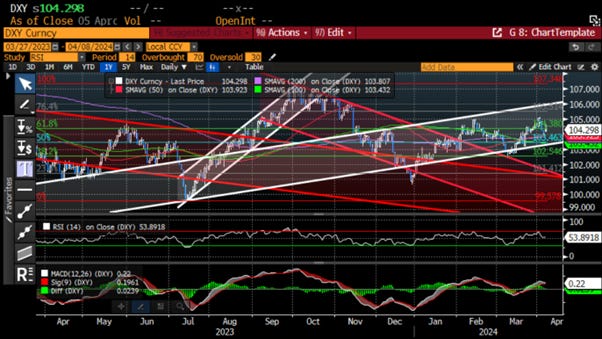
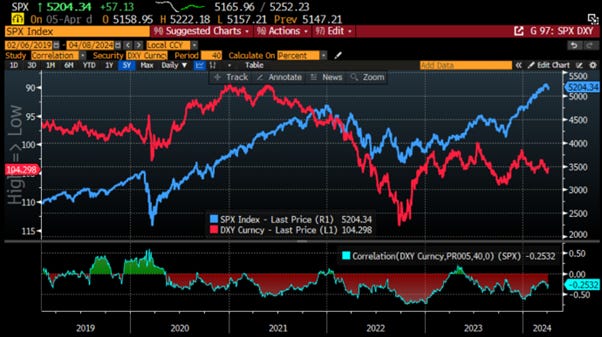
A stronger dollar has seldom been good news for equities due to the negative correlation between the two assets.
S&P 500 index (blue line); USD Index (axis inverted; red line) & Correlation.
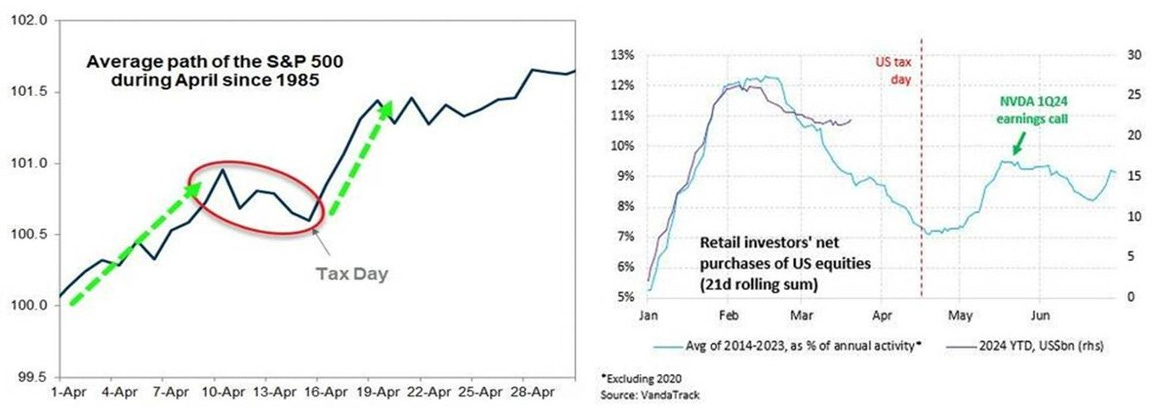
This will contribute to the seasonal selling pressure, as the retail community often sells stocks into the US Tax Day (April 15th) to raise cash for these payments. However, retail flows are expected to recover by the beginning of May – just in time for Nvidia’s 1Q24 earnings call.
For bond investors, a stronger USD is also seldom a good thing, as the 10-Year Yield and DXY index have been steadily positively correlated.
S&P 500 index (blue line); US 10-Year Yield (red line) & correlation.

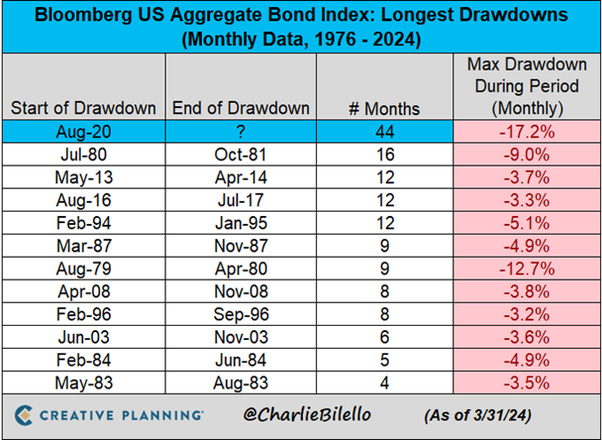
While Wall Street consensus is still trumpeting that the bear steepener is dead, the US Bond Market has now been in a drawdown for 44 months, by far the longest bond bear market in history. This should already remind investors that in an ‘inflationary bust’ which is ahead for the US economy, government bonds will NOT be the antifragile asset of their portfolio.
Investors' attention has rightly been on the US fiscal deficit, but rising tensions between Russia and Europe suggest that the fiscal situations of European governments may trigger a European sovereign crisis 2.0 sooner than in the US. A flashback to February 1992 and the notorious Maastricht Treaty is necessary. This treaty, which laid the foundation for the European Union and the euro, established four rules:
Deficit rule: A country is compliant if its general government budget balance is equal to or larger than -3% of GDP, or if any breach of the -3% threshold remains small (maximum 0.5% of GDP) and limited to one year.
Debt rule: A country is compliant if its general government debt-to-GDP ratio is below 60%, or if any excess above 60% of GDP has been decreasing by 1/20 on average over the past three years.
Structural balance rule: A country is compliant if its structural budget balance is at or above the medium-term objective (MTO), or if progress towards the MTO is sufficient (annual improvement of the structural balance equal to or greater than 0.5% of GDP, or the remaining distance to the MTO is less than 0.5% of GDP).
Expenditure rule: A country is compliant if the annual growth rate of primary government expenditure, net of discretionary revenue measures and one-offs, is at or below the 10-year average of the nominal rate of potential output growth minus the convergence margin necessary for adjusting the structural budget deficit in line with the structural balance rule.
Fast forward to 2024, France and Italy are major disasters in terms of the budget deficit rule. France currently has a budget deficit of 7%, while Italy's stands at 5%. France needs to reduce its deficit by a significant 4% of GDP. Neither Italy nor Greece should have been allowed in the EMU (European Monetary Union – Eurozone) originally. Greece's debt-to-GDP ratio sits at 170%, far surpassing the 60% target. Only the Scandinavian countries are currently in compliance.

On February 10th, away from the media spotlight as usual when it is about talking fiscal policies, the EU agreed to "Looser Fiscal rules to cut debt, boost investments." The revised rules permit countries with excessive borrowing to reduce their debt by an average of 1% per year if it exceeds 90% of gross domestic product (GDP), and by 0.5% per year on average if the debt is between 60% and 90% of GDP. Countries with a deficit exceeding 3% of GDP are mandated to halve it to 1.5% during periods of growth, establishing a safety buffer for anticipated challenges. Defense spending will now be factored into the Commission's assessment of a country's high deficit, a response triggered by Russia's invasion of Ukraine. Under the new rules, countries have seven years, extended from four previously, to reduce debt and deficit starting from 2025.

Fifteen or so years after the Euro area’s sovereign debt crisis, Europe faces another financial turmoil. France and Italy's high budget deficits for 2024, over 7% and 5% respectively, are warning signs. But these figures are symptoms of deeper economic stagnation. Germany, despite differing fiscal policies, also grapples with similar challenges. The collapse of Nicolae Ceaucescu's repressive but debt-free regime in Romania serves as a poignant reminder that the volume of debt alone does not determine sustainability. Rather, it is a state's ability to provide welfare and contentment while remaining financially stable. Politics, therefore, becomes the art of balancing these aspects continuously. Historically, the European model relied on oligopolistic industrial firms, heavily supported by favourable regulations and state-backed services. These firms, like those in the German automotive sector, enjoyed high profit margins and dominated the economy. This setup also shaped social policies, ensuring equitable distribution of benefits through fiscal transfers and labour market interventions. However, European companies now struggle to sustain profits and fund research. While government intervention historically fostered industries, prioritizing incumbents, the new digital revolution has also changed the nature of economic growth. With the lack of access to "cheap energy" since the start of the conflict between Russia and Ukraine, the German business model, relying on cheap energy to manufacture goods, has been structurally broken. In a nutshell, the growth engine of the European Union is broken and the weaker satellite like France and Italy will be first in line to pay the pay price of this new industrial reality.
Germany Industrial Production.

Zooming in, France is poised to be at the epicentre of the impending European Ice Age, as its fundamentals have been deteriorating since the 2008 Global Financial Crisis. With a government spending to tax revenue ratio of 0.5, France has persistently lived beyond its means, and the looming recession is expected to worsen this situation, potentially pushing the ratio even lower than during the peak of the Covid pandemic.
France: Ratio of government spending to tax revenue.

In a "bureaucratic communist" country like France, where the government plays a dominant role in generating GDP, investors would be wise to focus on the ratio of government debt to the GDP generated by the private sector, representing real economic activity. At 198%, the French government's debt-to-private-sector-GDP ratio has reached levels comparable to those seen in Argentina before experiencing a collapse of their sovereign debt.
France: Ratio of government debt to GDP generated by the private sector.

This rings particularly true when considering the inflation rate for everyday people, often referred to in France as the "Gilets Jaunes" in reference to the 2018 social unrest sparked by working-class individuals. This inflation index encompasses energy, food, and housing costs which are the costs that matter for the average employee. Since the onset of the Covid pandemic, the rising prices of these three basic necessities have surpassed the average wage increase for French workers. Consequently, the quality of life for the average French worker has significantly deteriorated since the pandemic's onset whatever the ambient narrative prevailing among the elites.
Average wage per capita in France (black line); ‘Gilets Jaunes’ Inflation Index (1/3 Food; 1/3 energy; 1/3 housing) (red line).

France faces the challenge of refinancing EUR273 billion in 2024, EUR262 billion in 2025, and EUR278 billion in 2026, totalling EUR813 billion of its EUR2.766 trillion debt over the next 36 months. The current weighted average coupon of the French debt is 1.61% compared to the French 10-OAT yielding at 2.9%. Given the current fiscal situation, smooth refinancing seems unlikely.

So, France, like many European countries grappling with deregulated immigration are on the brink of a social revolution. Additionally, France is entering a dire ‘debt trap’. As a matter of fact, France is in a more precarious situation than Italy in the impending sovereign debt crisis, one can examine the spread between Italian and French 10-year yields, which is at its lowest level since 2015. This suggests that Macron may have recognized the need to divert financial markets' attention from the dire state of the French economy by adopting a more aggressive stance among NATO leaders. Historically, wars have often been a catalyst for governments to default on their debt.
Spread between Italy and France 10-Year Yield.

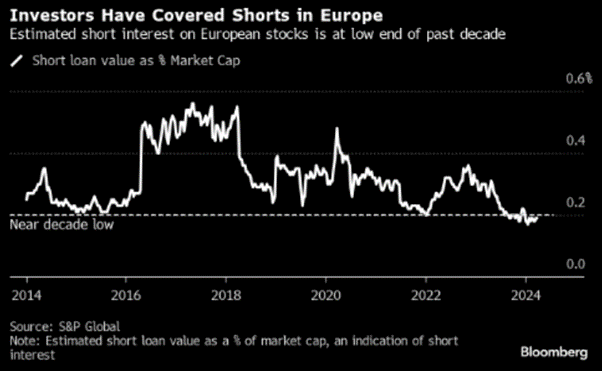
Currently, the financial markets are not pricing in the risk of a sovereign debt crisis in France or Italy, evident from near-decade-low CDS spreads. However, a reassessment of "European government risk" would likely trigger capital outflows from the region and significantly weaken the EUR/USD forex rate.
France CDS (blue line); Italy CDS (green line); Spain CDS (purple line) & EUR/USD FX rate (axis inverted; red line).

On March 21st, the European Council President urged Europe to transition to a war economy, emphasizing job creation as a significant benefit. Charles Michel's endorsement reflects Europe's extensive history of conflict, with the Russia/Ukraine NATO war being just one of many, marking the 487th military conflict in Europe over the past 2000 years. Europe's increasing reliance on China and the US for security, coupled with its dependency on Russia for energy, suggests that capital outflows are likely to intensify in the coming months as geopolitical tensions escalate on the ground. Consequently, Europe may be tempted to impose capital controls, as most Emerging Markets have done during previous financial crises.
Rates ALWAYS rise during war because governments print money like never before, and inflation skyrockets, forcing them to put capital controls, wage controls, price controls, and rationing in place. This time will not be different, and Europe is moving first in this direction.

In this context, given the Eurozone's bureaucratic tendencies, it's no surprise that it has begun tightening regulations on cryptocurrency. This move primarily targets private wallets, aligning with the ECB's preparations to launch a CBDC. This initiative likely forms part of the European Union's strategy to increase taxes for financing defense efforts and to implement capital controls more efficiently than emerging markets have done in the past. The ECB's presentation from March 2024 outlines a timetable for the Digital Euro, with development and implementation set to begin in November 2025 after the legislative process is completed. This aligns with the EU's plan to issue digital identity cards to all residents by 2030 for government identification and citizen tracking.

From an investment perspective, it's impossible for this catastrophe to have no repercussions for various economic actors. However, as always, these effects will take time to manifest. Insurance companies, for instance, guarantee future risks and maintain reserves to cover them, typically invested in government bonds, real estate, and minimally in stocks. With real estate also declining due to rising interest rates, they've incurred a 40% loss on these reserves. Meanwhile, the costs of the risks they've insured have risen due to inflation, prompting them to significantly increase prices. This will reduce the profitability of insured businesses and lower individuals' standards of living, exacerbating the impending recession. Commercial banks, much like insurance companies, have their mandatory reserves heavily invested in government bonds. With these bonds declining, along with their capacity to absorb defaults, banks are likely to halt lending. Already, there's a virtual freeze on new loans, particularly in real estate. Pension funds, which cater to complementary pensions, typically allocate about 50% of their reserves to various investments.
Investors should not be swayed by the prevailing narrative suggesting that all is well for the European banking system, as indicated by the current state of CDS. Instead, it's crucial to recognize that the banking system, especially in France, is poised to endure substantial losses from the impending sovereign debt crisis in the region.

Taking a closer look behind the curtain, at loans provided by Monetary Financial Institutions (MFIs) to Euro area financial corporations other than MFIs and ICPFs (Insurance Corporations and Pension Funds), which essentially encompass loans made by Euro area banks to non-banks, including investment funds and securitization structures, reveals an intriguing trend. While there has been an overall decrease in loans across the European banking system in recent years, this specific category of loans tends to rise during periods of heightened liquidity and economic financial circumstances.
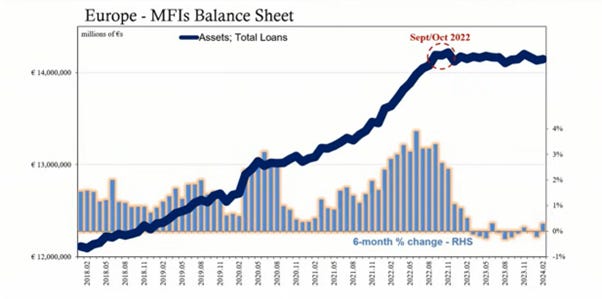
Recent history provides ample evidence of this phenomenon. For instance, in early 2007, as the world began to grapple with the unfolding subprime mortgage crisis, there was a notable increase in loans provided by Euro area banks to non-bank financial corporations. Similarly, a similar trend was observed in December 2009, preceding the onset of the Greek debt crisis.

Indeed, history repeats itself, and we witnessed similar events once again in January 2018, when dollar funding became scarce, leading to liquidity issues worldwide. This trend resurfaced in February 2022, following Russia's invasion of Ukraine and the resulting disruptions to energy supplies, which impacted the European economy. Therefore, the increase in loans from European banks to non-banks serves as a reliable canary in the coal mine, signalling the looming possibility of a credit event brewing behind the scene.
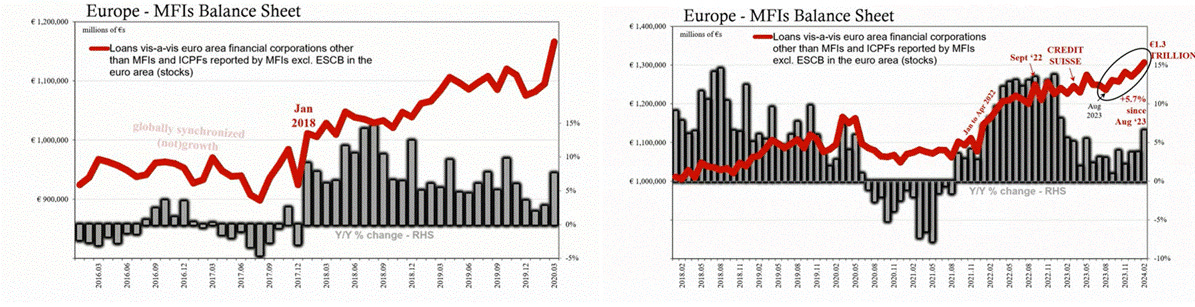
To provide context, the current value of loans from European banks to non-banks stands at EUR 1.3 trillion, a significant sum within the global banking sector. This represents a 5.7% increase since August 2023. Conversely, loans from banks to households have either remained stagnant or decreased, reflecting tightened liquidity and a pessimistic economic environment.

This trend serves as a warning sign that a crisis may be looming beneath the surface in Europe. While the exact reason for the increase in loans to non-banks is not definitively known, clues suggest a potential connection to the commercial real estate problem in Europe. The latest Financial Stability Review from the ECB has highlighted this issue, indicating that it may be contributing to the uptick in loans to non-banks.

In its 2023 annual report released two weeks ago, UBS highlighted the downturn in commercial real estate as one of its "top and emerging risks." This concern arises from high interest rates and a decline in demand for office space, impacting the sector. UBS expressed apprehension about adverse effects on valuations due to higher interest rates and the structural decline in demand for office and retail space. The bank emphasized the potential broader impacts stemming from material balance sheet exposure to the sector by both bank and non-bank lenders. The bank defines "top and emerging risks" as those with the potential to materialize within one year and significantly affect the group. Other risks highlighted in the report include inflation and geopolitics. Notably, commercial real estate did not feature among its top risks in the previous annual report.

Lagarde has already been quite clear that the first interest rate reduction will come in June, as she mentioned at the latest ECB meeting on March 20th. This view has been widely endorsed by many members of the Governing Council, including the most hawkish among them.

With stagflation already present and the banking system facing uncertainty, it's unsurprising that the ECB has adopted a more dovish stance compared to the ‘politically correct’ FED. Given the ECB's heightened political sensitivity compared to the FED, it's anticipated that the ECB will be compelled to cut rates ahead of the June European election to lure electors to support the war agenda of current heads of states and to avoid dealing with rising nationalist parties. This prospect is likely to serve as another catalyst for the EUR to weaken against the USD in the months ahead.
Spead between FED & ECB interest rate cut probability (blue line); EUR/USD FX rate (axis inverted; red line).

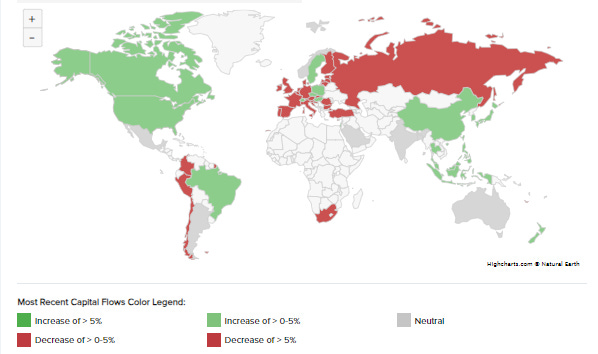
It should not be a surprise to anyone that the smart money has been flowing out of Europe to the US over the past month, and more will come as the old continent falls into its debt trap.
Global Capital Flows Heat Map.
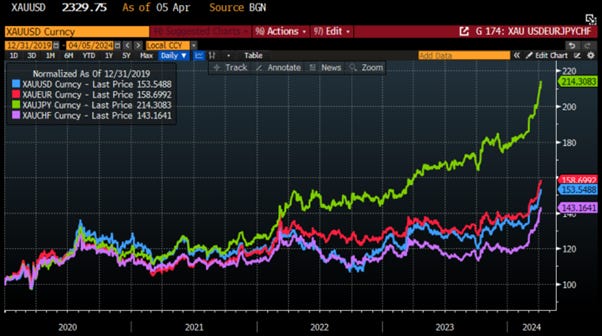
Smart investors understand that owning physical gold serves as a hedge against government risks, not inflation. Therefore, it's no surprise that since the COVID pandemic and the onset of the 'forward confusion' narrative by central bankers and governments, the performance of physical gold has been strongest in terms of JPY and EUR among DM fiat currencies. These two currencies carry the highest risks of falling into a debt trap in the foreseeable future.
Gold price in USD terms (blue line); EUR terms (red line); JPY terms (green line) and CHF (purple line) rebased at 100 as of 31/12/2019.
As always should always follow the smart money and in this context, the outlook for European stocks appears particularly bleak. A combination of a banking crisis alongside an impending sovereign debt crisis, which is anticipated to begin in France, should deter investors from European stocks overall, and European banks in particular. Similar to the situation in the US, financials are expected to continue underperforming their respective equity markets as liquidity and credit crises are projected to disproportionately impact this sector.
Relative performance of S&P 500 Financials to the S&P 500 index (blue line); Relative performance of Eurostoxx 50 financials to the Eurostoxx 50 (red line) (rebased at 100 as of December 31st 1989).

Interestingly, investors have chosen to overlook the impending European Ice Age, even if the Eurostsoxx index's % year-to-date gain in USD is lagging behind the US equity market. This year-to-date gain lacks the wow factor typically observed during a positive first quarter, as seen on average since 2000. However, the remarkable aspect lies in the fact that the benchmark has not experienced a 2% down day for more than 180 days, marking the best streak since 2017 and the fourth longest since its inception in 1998.

This development occurs concurrently with hedge funds covering their shorts in Europe and asset managers like Blackrock, who are not typically client-focused, recommending an overweight position in European equities over US equities for the second quarter.
WHAT’S ON THE AGENDA NEXT WEEK?
The second week of the second quarter will once again focus on inflation, with the release of key economic indicators. Wednesday will see the US March CPI, followed by the US PPI on Thursday, along with China's CPI and PPI reports. The macro week will conclude with the release of the University of Michigan's consumer inflation expectations. The ECB meeting on Thursday may provide further clues on how soon the ECB will have to cut rates to avoid the Eurozone from falling into its inevitable debt trap. Additionally, the Q1 2024 earnings season will kick off, featuring reports from Blackrock on Thursday and JP Morgan, Citigroup, and Wells Fargo on Friday.

KEY TAKEWAYS.
As the second quarter of the year starts, here are the key takeaways:
The ISM Manufacturing data provided further evidence that the era of immaculate disinflation is behind us.
The March Non-farm payroll masks evidence of a two-track economy, where part-time jobs have become the norm.
Government deficits in the Euro area, even less sustainable than in the US, signal an imminent sovereign debt crisis in Europe as the continent transitions to a 'war economy'.
The increase in loans to non-banks in the Euro area serves as the typical ‘canary in the coal mine’ for global liquidity stress. While the crisis may take several more months to fully materialize, it indicates that a significant crisis is brewing in Europe.
With the economy weaponized and the Eurozone at the epicenter of a debt trap, the European banking sector teeters on the brink of a systemic credit event.
As European governments approach the debt trap, smart money will flow from Europe to the US and physical gold, leading to new highs for the greenback and the barbaric relic.
Rates ALWAYS rise during war because governments print money like never before, and inflation skyrockets, forcing them to put capital controls, wage controls, price controls, and rationing in place.
For fixed income investors chasing the duration trade, more pain awaits as long-dated yields must reflect the new reality of stagflation.
For equity investors, with an inflationary bust ahead, the best way to protect their wealth is to own the equity barbell portfolio made of Tech and Energy and Physical Gold.
As stagflation rather than recession materializes in the next few months, investors should prepare their portfolios for HIGHER volatility.
In this context, investors should also remain prepared for dull inflation-adjusted returns in the foreseeable future.
HOW TO TRADE IT?
The first week of the second quarter of the year saw extreme market swings, and while the post-NFP rally on Friday spared investors from their worst week since 2022, it capped a week of rising volatility. Rather than recession anxiety, the culprit was geopolitical tensions in the Middle East, which pushed oil prices higher, finally raising doubts about whether the Fed has room to cut rates this year.
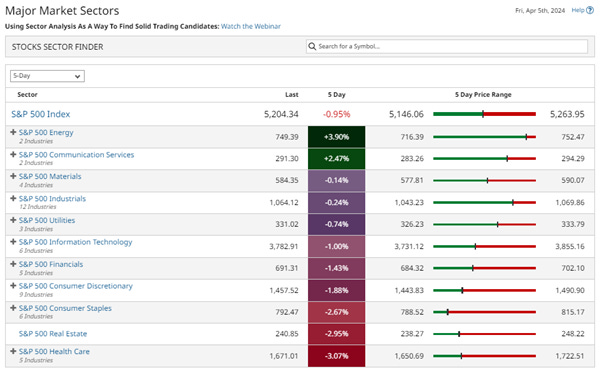
In this environment, it is no surprise that energy outperformed again, while defensive and rate-sensitive sectors like consumer staples, real estate, and healthcare lagged behind.
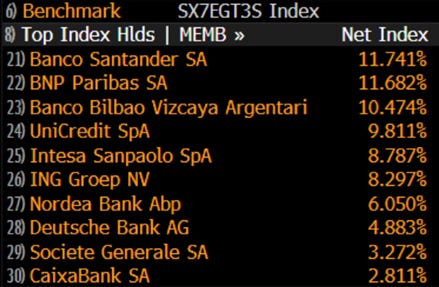
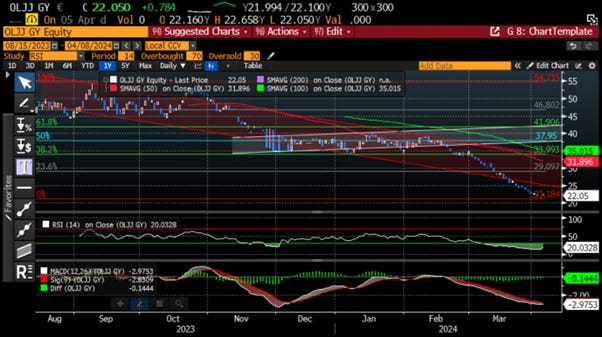
For investors with a risk appetite and who anticipate that Europe's descent into a debt trap may lead to another banking crisis, they may consider the WisdomTree EuroStoxx Banks 3x Daily Short ETTF (OLJJ GY). This fully collateralized, UCITS eligible Exchange Traded Product aims to offer investors leveraged short exposure to the EURO STOXX Banks. The ETP tracks the EURO STOXX Banks Daily Short 3 EUR Gross Return Index (SX7EGT3S), delivering a total return equivalent to -3 times the daily performance of the EURO STOXX Banks EUR Gross Return Index.
The recent 52-week low at EUR21.42 provides a solid support level for entering this ETF. It's suitable for investors willing to tolerate the volatility associated with a leveraged inverse ETF, which inherently entails speculative investment.
At The Macro Butler, our mission is to leverage our macro views to provide actionable and investable recommendations to all types of investors. In this regard, we offer two types of portfolios to our paid clients.
The Macro Butler Long/Short Portfolio is a dynamic and trading portfolio designed to invest in individual securities, aligning with our strategic and tactical investment recommendations.
The Macro Butler Strategic Portfolio consists of 20 ETFs (long only) and serves as the foundation for a multi-asset portfolio that reflects our long-term macro views.
Investors interested in obtaining more information about the Macro Butler Long/Short and Strategic portfolios can contact us at info@themacrobutler.com.
Unlock Your Financial Success with the Macro Butler!

Disclaimer
The content provided in this newsletter is for general information purposes only. No information, materials, services, and other content provided in this post constitute solicitation, recommendation, endorsement or any financial, investment, or other advice.
Seek independent professional consultation in the form of legal, financial, and fiscal advice before making any investment decisions.
Always perform your own due diligence.