


From Too Big To Fail To Too Big To Rescue?


THE WEEK THAT IT WAS...
Apart from cutting traditional mooncakes, the Mid-Autumn Festival week in China brought investors' focus back to central bank masquerades, with the FOMC meeting and the Bank of Japan being the most significant events of the week. Investors also had a chance to once again gauge the impact of inflation-driven misery on the health of the US consumer with the release of pre-back-to-school retail sales data.
In Japan, the August CPI rising to +2.8% YoY and +2.0% on a Supercore basis is another sign that the Land of the Rising Sun is facing a second wave of inflation. The weak yen continues to fuel unwanted inflation in a country where most consumers are retired and unwelcoming of higher prices.

In this context, while the Bank of Japan has kept its policy unchanged, it's only a matter of time, probably sooner rather than later, before it will be forced to hike rates again, as hotter-than-expected inflation will compel Ueda to act. The consequences will ultimately escalate the inevitable financial doom loop, impacting not only Japanese investors but also those still relying on Miss Watanabe to help keep long-dated US yields in check.
Japan Holding of US Treasury (blue line); Spread between US 10-Year Yield and Japanese (red line); JPY/USD FX rate (green line).

In the US, in another dystopian display of data spreading ‘Forward Confusion and Illusion’ about the real state of the economy, pre-back-to-school retail sales beat expectations, rising 0.1% MoM, above the expected -0.2%, while July was revised upward from +1.0% to +1.1%. This increase was driven by non-store retailers. Indeed, under the surface, motor vehicle and electronic appliance sales contracted, while non-store (online) retailers surged.
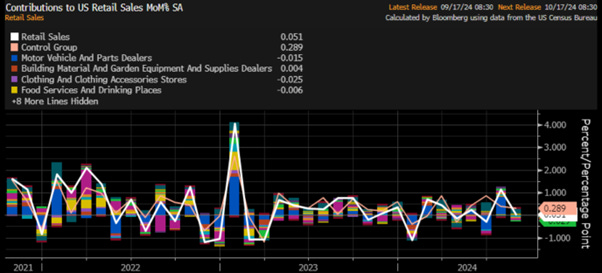
On a YoY basis, due to the base effect, retail sales printed at +2.1% YoY. However, core retail sales (excluding autos) rose by +3.9%.

As a reminder to anyone who still believes the US consumer isn't feeling the harsh effects of inflationary misery, retail sales data is nominal. A simple CPI adjustment reveals that real retail sales, adjusted to inflation, have been declining since April 2021, while misery has been spreading across United Socialist America.
US Retail Sales Adjusted to inflation (i.e. CPI) (blue line); US Misery Index (axis inverted; red line); Correlations and US Recessions.

Regardless of what Wall Street analysts and their echo chambers may claim, the main point of the September 18, 2024, FOMC meeting is not the partisan and politically driven decision to cut rates but the fact that the FOMC has decided to abandon its 2% inflation target at least until the end of 2025.

As the 2% inflation target has shifted from being a ceiling (as it was between 2009 and 2020) and an average (as it was between 1994 and 2008) to now being a floor, the FED's Summary of Economic Projections suggests that the PCE is expected to be around 2.5% in the foreseeable future. Given that the CPI is typically 40+ basis points above the PCE, the FED is effectively aiming for a minimum inflation level of 2.4% or higher. Based on simple math, if the FED meets this new target, the average inflation rate for the next 12 months will likely be around 2.9% at best as the base effect reverse.
US CPI YoY Change (blue line); US 10-Year Yield (red line); US Core PCE YoY Change (green line).

Since all financial assets are still priced based on a 2% CPI, the bond market is on the verge of a massive repricing due to the FED's new inflation target assumptions.

The second dire implication for the bond market is that, with massive tax and fiscal stimulus and an escalation in the war cycle, both expected in different scales regardless of who occupies the White House, the projected 3.4% FED Funds Rate by the end of 2025 seems phantasmagorical and unrealistically low. Moreover, the consensus expectation of a 2.86% FED Funds Rate by that time appears to be an unachievable dream, implying that not only will the FED be unable to cut rates, as it becomes increasingly impotent and irrelevant under ‘Kamunism’ or ‘Trumponomics 2.0.’

In layman's terms, this means Wall Street is likely to be disappointed by the pace at which interest rates declines if it declines at all after the political masks are down.

For bonds, the FED's confirmed actions and statements add to a 'supply-driven' bearish outlook for US Treasuries in a world where USD assets have been weaponized. In this context, the US 10-year yield hit a floor on the same day as the infamous FED pivot, with 3.5% now being the new floor and resistance expected between 5.0% and 6.0%, likely to be reached once the political circus around the White House is settled.
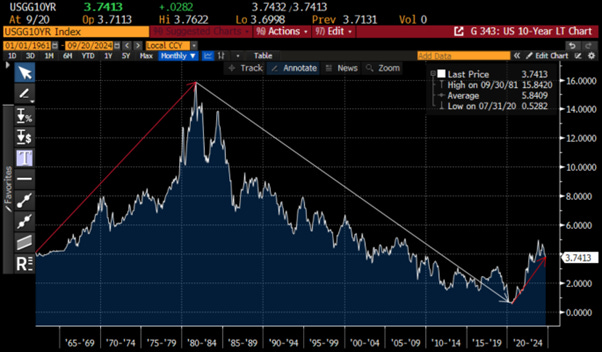
While last Thursday was the first time 10-year yield rose after a 50-bps cut since Lehman, some may call it a coincidence, but those who understand history know that nothing happens by chance in this world and that everything in life is governed by cycles, just as night follows day, the economy follows a business cycle. Therefore, it should come as no surprise that it was on September 18, 2007, that the FED, under Chairman Ben Bernanke, initiated the interest rate cut cycle that ultimately marked the onset of what has been historically referred to as the Global Financial Crisis.
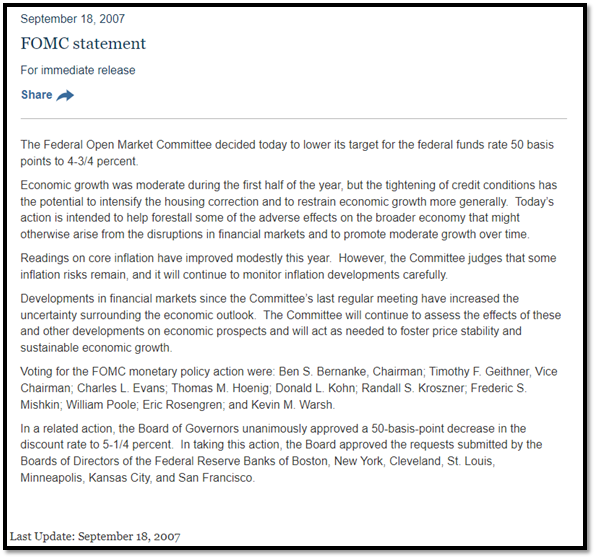
https://www.federalreserve.gov/newsevents/pressreleases/monetary20070918a.htm
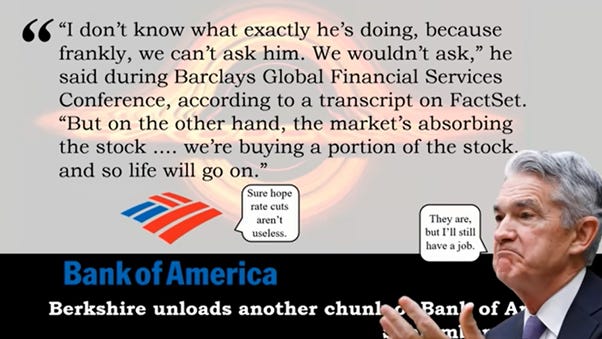
Indeed, outside the unfolding political circus surrounding the race for the next four-year tenancy of the White House, and the heated debates to become the 47th president of the 'United Socialist America,' the third quarter will likely be remembered in financial history as the period of a multi-month selling spree of Bank of America shares by one of the most seasoned investors in recent financial history, Warren Buffett. Based on the latest SEC filings, Berkshire Hathaway has sold almost 197 million shares since the start of the third quarter for a record amount of approximately $8.0 billion.

After selling more than 197 million shares, Berkshire remains the largest shareholder, with 10.8% of the bank's stock, or about 836 million shares, worth approximately $34.0 billion. This means that total proceeds from share disposals since mid-July, combined with dividends earned (excluding taxes) since 2011, have surpassed the $14.6 billion the Oracle of Omaha spent to build its stake in the second-largest US retail bank.

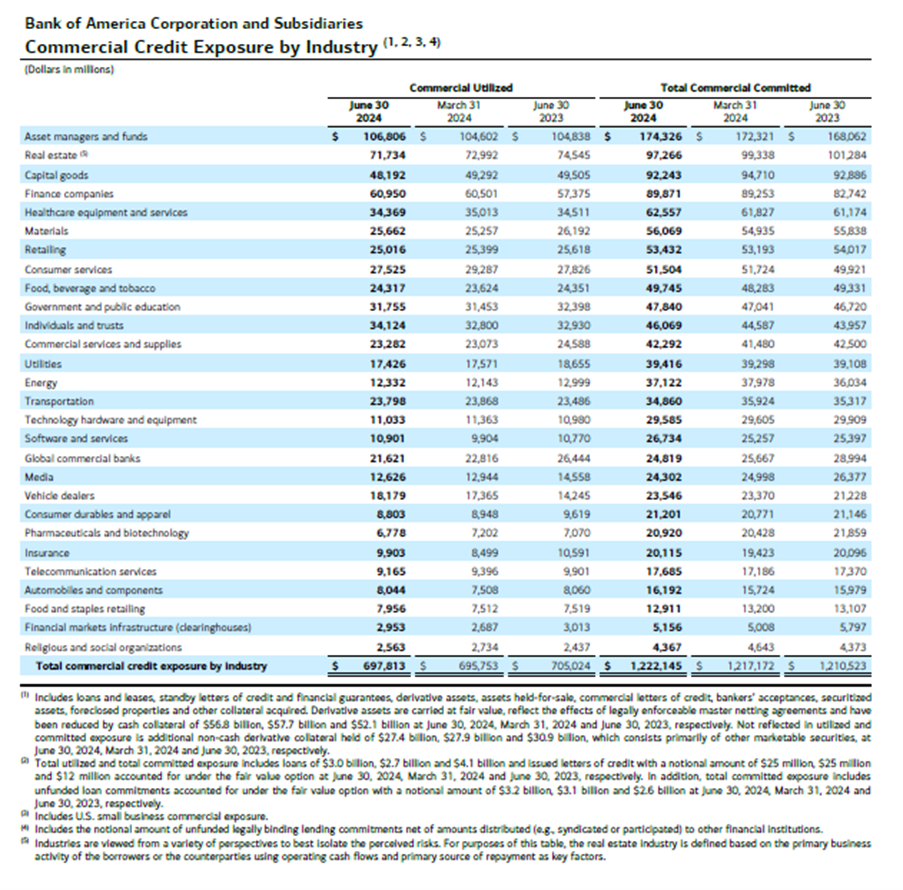
There are likely multiple reasons why Warren Buffett has been selling Bank of America shares over the past few weeks, including the fact that the US economy is not doing as great as those negating the reality of the inflationary bust pretend for a political reason. However, Bank of America (BAC) published its last quarterly financial earnings on July 16. During the second quarter, BAC's Agency MBS holdings decreased from $457.8 billion to $448.5 billion, while the ‘paper losses’ on these holdings increased from approximately $88.5 billion to around $90 billion. This means that losses on the principal increased from 19.33% to 20%. BAC's US Treasury holdings remained stable at approximately $121.6 billion, with around $19.6 billion of mark-to-market (MTM) losses, equivalent to about 16% losses on the principal. Comparing these two points, it becomes quite evident that the value of BAC’s Agency MBS holdings is deteriorating beyond what changes in interest rates would suggest. In this context, despite efforts to obscure its troubles, if BAC’s conditions are deteriorating so significantly from an external perspective, investors can only imagine how grim the picture must look from an insider's viewpoint, like Warren’s.
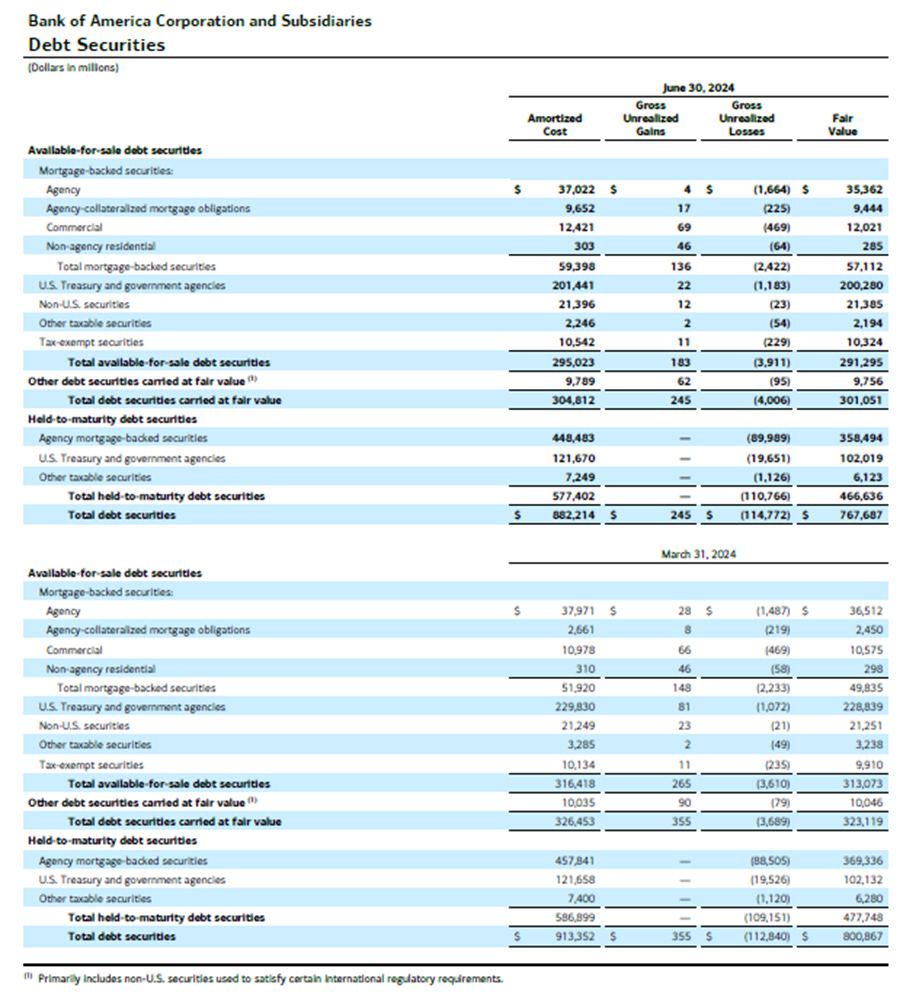
As of the end of Q2 2024, Bank of America NON-AGENCY GUARANTEED REAL ESTATE PORTFOLIO WAS WORTH MUCH MORE THAN THE ONE SECURED BY THE US GOVERNMENT.

So, while BAC is carrying a 20% Mark to Market ‘paper losses on its Agency MBS holdings (that are government-guaranteed): BAC’s Allowance for Credit Losses (ACL) for Residential Real Estate Mortgages is 0.12% against 227.5bn$ of assets and BAC’s ACL for Commercial Real Estate Mortgages is 1.82% against 71.3bn$ of assets. Would the same ‘Mark to Market’ process applied across all BAC Real Estate exposures, bearing in mind it will still be an underestimation since the government guarantee won’t apply to all we will get the following results:
BAC Agency MBS: ~$90 billion of ‘Paper Losses’.
BAC Residential Real Estate Mortgages: ~$45.5 billion of ‘Paper Losses’.
BAC Commercial Real Estate Mortgages: ~$14.3 billion of ‘Paper Losses’
This results in an estimated total of paper losses of $149.76 billion, compared to BAC’s total tangible common shareholders’ equity of $194.5 billion at the end of Q2 2024. While this should already scare most investors, there are other concerns that are even more troubling. First, real estate is not BAC’s biggest commercial credit exposure; Asset Managers, Hedge Funds, and Private Equities are. Additionally, BAC’s consumer lending losses are starting to accumulate, with credit card ACL already equivalent to 7.38% of the total exposure the bank carries. On top of the ~$700 billion in assets BAC has already deployed, the bank is committed to lending ~$500 billion more. As seen in March 2020, this can happen on short notice if market conditions deteriorate. How BAC can meet these commitments without turning ‘paper losses’ into ‘real losses’ by selling deep underwater assets is likely the question Warren Buffett and his team have been asking themselves, which may have triggered their decision to unload their stake in the banking giant.
When asked about Warren Buffett's stock sales at a Barclays conference on September 10th, Bank of America’s CEO candidly told CNBC, ‘I don’t know what exactly he’s doing because, frankly, we can’t ask him, and we wouldn’t ask him. But on the other hand, the market's absorbing the stock we’re buying a portion of, and so life will go on…’
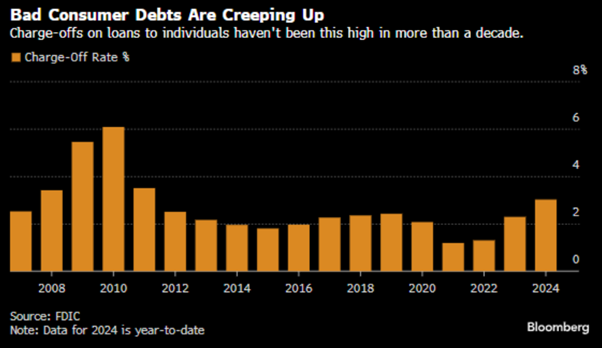
It’s not only Bank of America making news among US financial institutions recently. On September 10th , Ally Financials’ CFO, speaking at a banking conference in New York, announced that delinquency in the auto loan sector has been rising even before a significant spike in the unemployment rate and further inflation-driven hardship spreads across ‘United Socialist America.’ According to Ally's CFO, borrowers are struggling not only with the high cost of living but also with rising unemployment.

For the record, Ally's late-stage delinquent loans rose 12 bps above the five-year average in 2Q, pointing to potential charge-offs as loans advance through delinquency stages. While delinquency is seasonal, worsening trends align with management’s warning of escalating pressure in the coming months.
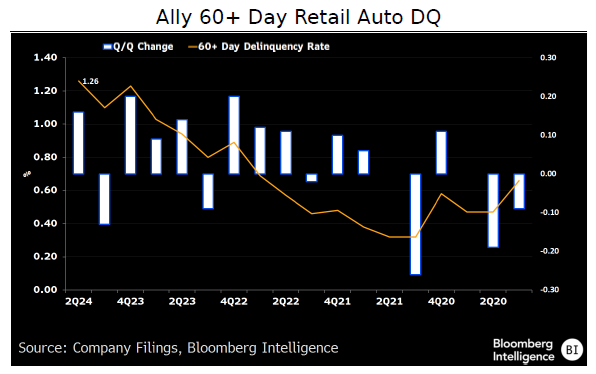
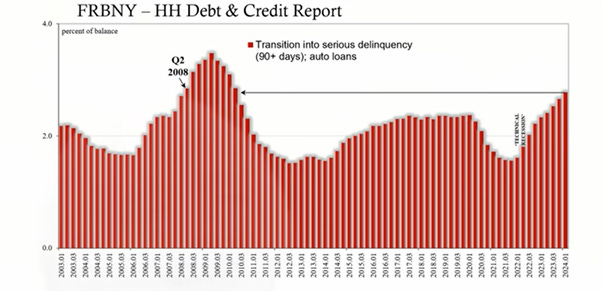
According to Ally's CFO, borrowers are struggling with both rising living costs and increasing unemployment. This issue extends beyond Ally and highlights a systemic problem linked to the broader macro environment, which is veering away from a soft-landing narrative. It’s a wake-up call for many, including bank executives. However, the Federal Reserve Bank of New York’s Q2 household debt report already revealed rising delinquency rates, particularly in auto loans and credit cards. Delinquencies for both are now at their highest levels since Q4 2010, following a similar rising pace not seen since Q2 2008, just before the Global Financial Crisis.
The other macroeconomic sensitive part of credit and lending and the burst of bubbles associated with it is the situation in the commercial real estate market which has moved out of the front of financial mass media despite that the crisis has been far from being solved and magically fixed. Indeed, banks are quietly offloading assets and loans, but challenges persist. For instance, Deutsche Bank is trying to sell up to $1 billion in US commercial property loans to alleviate capital constraints due to falling asset values. This move highlights the pressure on banks to manage balance sheet risks amid rising interest rates. Similarly, US banks have struggled to reduce their commercial real estate loans, with Federal Reserve data showing a $10 billion decrease since May.

It’s not just Ally or Bank of America; Citigroup recently noted that credit losses are increasing as US consumers adjust their spending. Net credit losses have also risen in its large cards business, signalling broader financial strain.

Even JPMorgan has suggested that the current NII estimate of $89.5 billion is unrealistic and that analysts clinging to the phantasmagorical 'soft landing' narrative will need to revise their expectations. In plain English, the largest US bank, and one of the largest globally, has issued a politically correct profit warning.

Another bank that was at the epicenter of the Global Financial Crisis and adopted the status of a consumer bank in 2008 to be bailed out by the US government, thanks to its ongoing revolving door of placing employees within the government, ‘Government Sachs,’ aka Goldman Sachs, has announced a staggering pre-tax loss of $6.0 billion since the beginning of 2020 ‘on a significant portion of its consumer-lending businesses, including its credit cards.’ Several factors contribute to Goldman’s massive losses associated with the Apple Card, including lax underwriting standards and resulting charge-off rates that are nearly double those of other credit cards. In this context, it comes as no surprise that the former master of the banking universe was highlighted in the latest FED stress test as having the second worst, subprime credit card portfolio among all US banks; only to Ally Bank, whose was also in the news again for its credit quality issues, ranks worse. ‘Government Sachs’ is therefore desperately looking to exit its partnership with Apple, which includes the Apple Card and Apple Card Savings Account. Currently, Apple Card credit balances total $17 billion. The Wall Street Journal reports that GS could face even bigger losses when it offloads the Apple partnership. Behind the scenes, Goldman has been in talks with American Express and Synchrony Financial about taking over the Apple Card business.

On the other side of the pond, while last week, the suntanned ECB president was not very talkative about the potential cross-border banking merger between Commerzbank and UniCredit, it is clear to everyone with a minimum of common sense that combining two national champions with feet of clay will only create a Euro colossus with feet of clay.

However, the real games of smoke and mirrors is happening right now around the mountains of the Swiss Alps and is being played by UBS. When the Swiss banking giant with the magical keys published its Q2 2024 results on August 14, it reported a net profit more than double what Wall Street analysts expected. This was enough to generate jubilant headlines and fuel trading algorithms, which helped the stock rise throughout the day with barely a hint of volatility.

However, what looked like ‘too good to be true’ results included around $95 million in credit loss expenses for the quarter. No, this is not a typo; UBS reported just $95 million in credit losses, while other major banks are reporting losses in the hundreds of millions, if not billions. The real question that not a single ‘braindead’ analyst asked at the time is how UBS could perform so well with negligible credit losses if it doesn’t make money from its core banking operations.
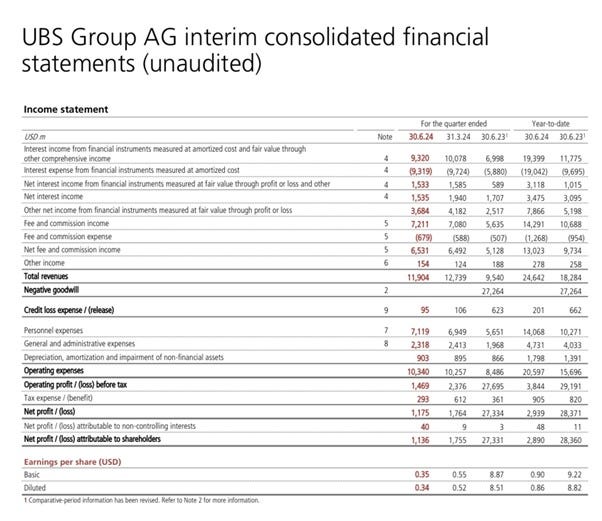
A quick look at the first two lines of UBS’s consolidated financial statement reveals something unusual to anyone with a basic knowledge of finance. In the last quarter, UBS earned approximately $9.32 billion in interest income from loans and fixed-income securities that are not marked to market, while it paid around $9.32 billion in funding costs. As a result, UBS ended up with just $2 million in net interest income on $1.5 trillion worth of assets in the relevant accounting category and $1.081 trillion in liabilities measured at amortized cost. In a nutshell:
UBS earned $9.32 billion out of $1.5 Trillion of assets.
UBS paid $9.32 billion out of $1.08 Trillion of liabilities.
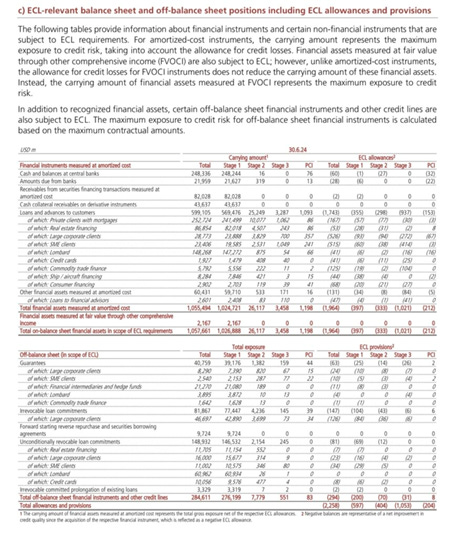
Now let’s consider what’s obviously happening: UBS borrowers aren’t paying interest as they should, but the bank is trying to obscure this. When a bank categorizes an asset as non-performing, it triggers a series of consequences, ultimately leading to the need for allowances for credit losses and a direct hit to its net income. Not surprisingly, as shown in the section below, UBS has only a small fraction of assets categorized in Stage 2 and Stage 3.
Now, let’s have some Algebra fun.
Assuming UBS earns the same percentage of interest between its assets and liabilities of the same nature, even though logically speaking, UBS should earn a higher yield on its assets:
9.32/1080 = 0.86%
0.86%*1500 = $12.9 billion.
$12.9 billion – $9.32 billion = ~$3.58 billion.
Assuming UBS lends at the same rate it borrows, there are $3.58 billion in interest revenues missing, which is equivalent to 27.7% of the total interest income related to those assets. Let emphasize that this simple algebra is using very conservative assumptions to somewhat favour UBS.
Anyone with a basic under understand know it impossible financially impossible for UBS to report $95 million in provisions for credit losses for the quarter while $3.58 billion in revenues are missing. Indeed, it’s clear that the bank should report significantly higher provisions for credit losses given the poor performance of its investments. Anyone who dig a little deeper into UBS’s numbers, we find even more ‘Stranger Things.’

Having a look at the first line ‘Interest Income from loans and deposits’ where the bank reports 8.4bn$ in revenues has a small (2) note attached to it which says:
‘Consists of interest income from cash and balances at central banks, amounts due from banks, and cash collateral receivables on derivative instruments as well as negative interest on amounts due to banks, customer deposits and cash collateral payables on derivative instruments’
These are literally UBS's words, and from what anyone can understand, this means that the $8.4 billion amount isn’t entirely equivalent to interest earned on loans. Doesn’t this imply that UBS is earning even less on its loans? Furthermore, doesn’t it suggest that UBS is being supported by central banks and other banks to fill the growing gaps in its balance sheet? At this point, it is so obvious that the 95m$ amount earmarked for expected credit losses is simply ridiculous. However, there is even more juice if we dig a little deeper.
In the last quarter, UBS reported in its revenues ‘Other Net Income from Financial Instruments Measured at Fair Value Through Profit or Loss And Other’ equivalent to ~$3.6 billion.

Isn’t this the approximate same amount of interest ‘missing’ that a simple algebra operation revealed, and that none of the Wall Street analysts pointed out in their comments on the supposed ‘better-than-expected results’? Does UBS provide any details about the source of these revenues in the 107 pages of its Q2 2024 financial statements? Nope, zero.
In this context anyone with common sense will have a strong gut feeling that UBS used an accounting trick to fake its financial statements. Those who are old enough will remember that this accounting trick is something like the infamous Lehman REPO 105 book the bank was using to cover a ~$50 billion hole in its balance sheet during the GFC.
To conclude, the math clearly doesn’t add up. When UBS’s revenues from fees, commissions, and trading (supposedly the bank's main sources of income) aren’t enough to cover the losses in its toxic books, it’s evident the bank is using an elaborate accounting scheme to give the market the impression that ‘everything is fine’ and that the Credit Suisse merger is going smoothly. In reality, the numbers paint a picture of a bank increasingly on the verge of failure.
Moving further east, Norinchukin Bank (Nochu in short) has been making headlines since the spring as the potential epicentre of a banking collapse that could contribute to Japan’s financial doom loop. A few weeks ago, Norinchukin released its latest earnings report, revealing 1,855.5 billion JPY in unrealized losses within its investment portfolio. However, it is clear that this figure is actually much larger.
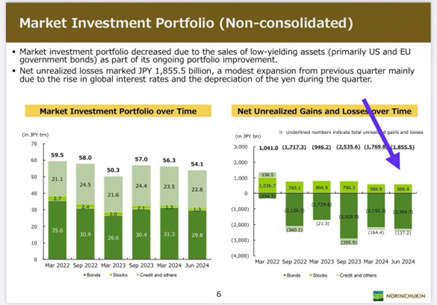
No one needs a PhD in accounting or finance to see from the latest balance sheet snapshot that Norinchukin sold approximately 1 trillion JPY worth of securities last quarter, incurring a loss of 181.3 billion JPY from these sales.

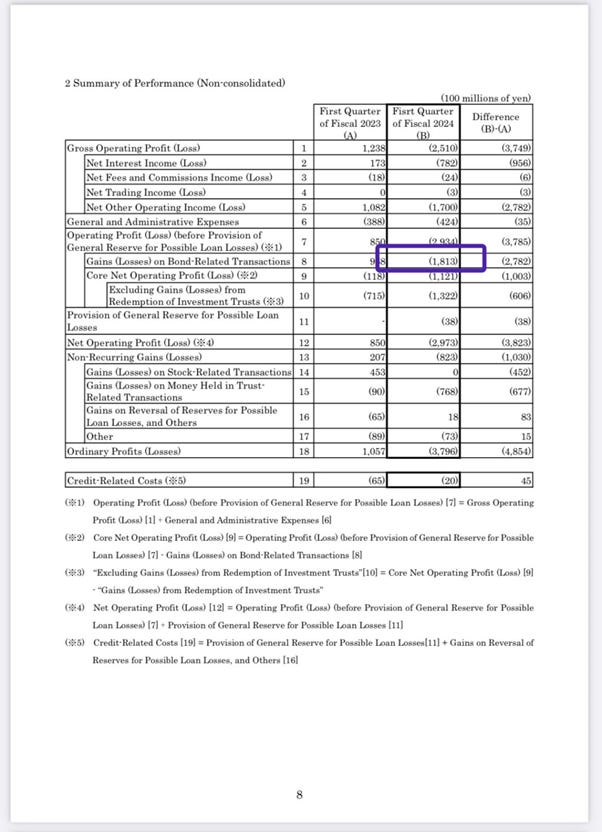
Applying some very easy math, everyone can quickly calculate that Norinchukin lost ~18% in principal in the process of unloading those assets. Logically, they sold the most liquid assets, meaning losses on the rest of the portfolio, which is more illiquid, are likely worse. Even if it is conservatively assumed an 18% loss on the remaining ~43 trillion JPY of securities, that equates to ~7.74 trillion JPY in unrealized losses. With only 5.7 trillion JPY in shareholders' equity, the bank is effectively bankrupt. Though, for the time being, insolvent Norinchukin remains operational due to liquidity. However, with 60 trillion JPY in deposits against ~18 trillion JPY in cash and ~10 trillion JPY in money held in trust, any upcoming and inevitable liquidity crisis would trigger an inevitable collapse.

In this context, it shouldn’t come as a surprise anymore that in the last quarter some wise customers pulled out 2.5 trillion JPY from Norinchukin already. If the picture wasn’t dire already, besides deposits, Norinchukin is also heavily relying on other forms of very short-term funding that can disappear quickly:
~12 trillion JPY in Net payables REPO
~ 2 trillion JPY in Certificate of Deposits
~4 trillion JPY in Short-Term Entrusted funds
~3 trillion JPY in Guarantees
Given the incredibly dire shape of Nochu’s balance sheet the main question should be why hasn’t there been a run on Norinchukin Bank? The fact is that most of its deposits are held by smaller regional banks, which are also its major shareholders. This creates a ‘prisoner’s dilemma’ where pulling deposits could bankrupt many regional banks, sparking financial chaos in Japan. How long can the BOJ (and the FED as last December, behind the curtain, Norinchukin's New York Branch was accepted as one of the only 25 banks allowed to use the New York FED Standing Repo Facility) keep rescuing everyone like in 2008? It's hard to say, but the longer it drags on, the more fragile the situation becomes.
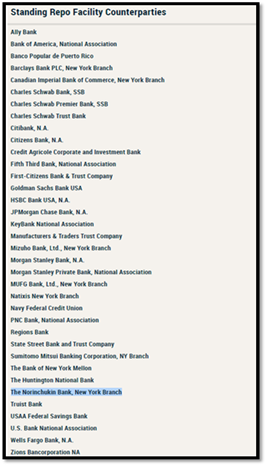
https://www.newyorkfed.org/markets/standing-repo-facility-counterparties
In this context, it should come as a surprise anymore that in the past 3 months Norinchukin has been unsuccessful in raising fresh capital to stay afloat, perhaps those who received the pitch deck didn’t need much effort to see the bank stands little chance to survive and putting any more money in will be equivalent to throwing it into a bonfire. In the meantime the bank is still rated A by major rating agencies which have decided like for Lehman and other previous banking scandal to put their heads in the sands to an inevitable outcome which is a bankruptcy.

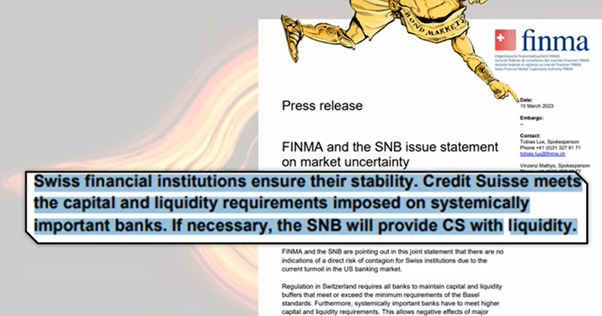
The recent failure of Credit Suisse has shown that credit agencies and regulators have been unable to anticipate or fully understand how a bank fails. Liquidity ratios monitored by these institutions barely reflect the complexity of banks, which have become ‘bookkeepers’ of Kafkaesque operations beyond what these ratios are designed to account for.
On a side note, investors will also note that Temasek, one of the best contrarian indicators alongside Jim Cramer, teamed up with Norinchukin in February this year to establish a Green Agri Fund worth an estimated $173 million. As both investors follow the 'Climate Change scam narrative' promoted by the WEF, it's no surprise that this fund aims to invest in companies focused on decarbonizing the food and agriculture industries across the Asia-Pacific region.

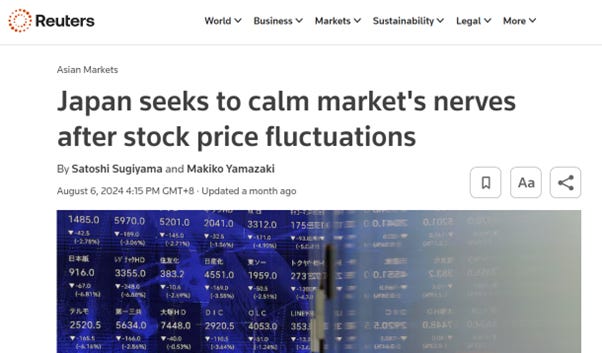
Beyond the known distress among major banks in the US, Europe, and Japan, the ‘known unknowns’ from the Yen Carry Trade tantrum on August 5th remain unresolved. It's hard to believe that no lender incurred significant losses from this event. Regulators have stayed silent, likely to prevent a repeat of the bank runs seen in the spring of 2023. The key question is: Who lost money in the stock market crash triggered by the Yen Carry Trade Tantrum? A critical but often overlooked aspect is the settlement process within the financial system's plumbing. When shares of stock, or other securities, are bought or sold, both buyer and seller must fulfil their obligations to complete the transaction. During the settlement period, the buyer must pay for the shares, and the seller must deliver the shares. On the last day of the settlement period, the buyer becomes the holder of record of the security. In the case of Japanese securities, the settlement period take 2 days starting from the trade date.
So, what happens if after 2 days either one of the parties isn’t in a position to deliver the cash or the securities agreed? A ‘Settlement Failure’ process is initiated. If the buyer can't finalize the transaction, in the case of the Japanese stock exchange, they face a cash penalty of ~15% interest per annum for each day of delay, increasing to ~22% after five days. If the seller fails to deliver securities within 24 hours of the settlement date, the JASDEC DVP Clearing Corporation (JDCC) initiates a ‘buy-in’ process, sourcing the securities from the market, with all costs and price differences charged to the seller. If, after postponement, a counterpart still can't meet obligations, it results in a default. The Japanese market crash started on Friday August 2nd (although like in 1987 stocks were already in a correction process well before that), which means all trades for that day were due to be settled by 2 pm JST on the 6th of August. Given this information, was it merely coincidental that the BOJ and MOF held an emergency meeting at 2 p.m. JST on August 6th, despite the Nikkei rebounding by ~12%? It’s likely they discussed potential settlement issues. The significant market drop occurred on Monday, with transactions due to settle on August 7th by 2 p.m. JST. Thus, if a credit event was triggered on Monday, we should have seen its effects in the hours following. If the situation is indeed worse than 1987, brokerages and banks could emerge as the dolphin and the whales of the Yen Carry Trade Tantrum and ultimately face defaults and closures sooner rather than later.
Investors should understand that 1-month T-Bills, in the current environment, are effectively better than cash in the bank. T-Bills are considered ‘pristine collateral,’ allowing anyone to borrow their full value in cash. They are segregated on the lender's balance sheet, so if the lender defaults, investor can recover your assets as long as you repay the borrowed cash. Conversely, if the borrower defaults, the lender can sell the T-Bills to recover the cash without involving the bankruptcy estate. However, T-Bills can be re-hypothecated, meaning the lender can use them as collateral to borrow from a third party. This exposes the borrower to the risk of the lender's default and the potential loss of collateral if it isn't properly segregated. While extreme scenarios exist, agreements often include clauses protecting borrowers if the collateral isn't returned to a third-party custodian. In contrast, borrowing against other forms of collateral or without collateral involves higher risks. Holding cash in another institution involves credit risk, as deposits become part of the bankruptcy estate if the institution fails, with FDIC insurance in the US covering only up to $250k.
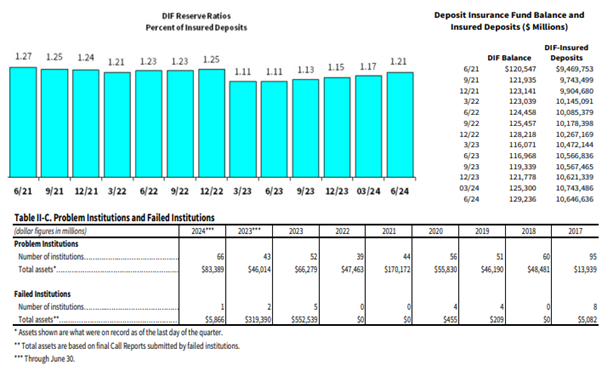
However, the FDIC is notoriously underfunded. On September 5th, the FDIC released its Q2 banking profile report, showing a $7.3 billion (11.4%) increase in net income for FDIC-insured banks, totalling $71.5 billion. This rise was driven by a decline in noninterest expenses, higher noninterest income, and gains on the sale of securities. However, the increase was partly due to nonrecurring items: an estimated $4 billion reduction in FDIC special assessment expenses, around $10 billion in one-time gains from equity security transactions, and a $4.9 billion after-tax gain from selling an insurance division. These gains were partially offset by losses from bond portfolio sales and a $2.7 billion increase in provision expenses.
To illustrate further the fragility of the US banking system, a recent study by Florida Atlantic University found that 94 US banks face a significant risk of bank runs. These banks all have a ratio of uninsured deposits to total deposits of 50% or higher, meaning they lack the hard currency to cover withdrawals in a panic. The University's Liquidity Risk from Exposures to Uninsured Deposits index reveals that BNY Mellon and John Deere Financial have a 100% ratio of uninsured deposits. This is followed by Deutsche Bank Trust Company (97.3%); State Street Bank (92.6%), Sumitomo Mitsui Trust Bank (92.1%) Northern Trust (73.9%), Citibank (72.5%), HSBC Bank (69.8%), JP Morgan Chase (51.7%), and US Bank (50.4%).

Technically, the Federal Deposit Insurance Corporation (FDIC) can shut down a bank before a run occurs, protecting insured deposits up to $250,000. Deposits exceeding this amount, along with mutual funds, annuities, life insurance, bonds, and stocks, are NOT insured. While uninsured depositors have faced only 6% in losses over the past 16 years, the FDIC relies on the Deposit Insurance Fund (DIF), which is supported by Washington. However, if multiple large banks fail and depositors withdraw their money simultaneously, the government may lack sufficient funds to cover all deposits.
https://www.fdic.gov/system/files/2024-09/qbp.pdf#page=1
To understand how concentrated the profits among insured FDIC financial institutions are, JPMorgan Chase Bank, N.A. alone earned $11.7 billion in net income, accounting for 18% of the total profit among all 4,568 FDIC-insured banks in the US. No other bank comes close to this percentage. Bank of America N.A. reported $6.4 billion, Wells Fargo Bank N.A. $5.36 billion, and Citibank N.A. $3.37 billion in net income. Combined, these four banks earned $26.83 billion, or 42% of the total net income of the remaining 4,564 FDIC-insured banks.

In this context, it should not be surprising that one week after the US banking system fragility was exposed to the public, the FED, through its controversial Vice Chairman for Supervision, Michael Barr, announced a reduction in the planned increase in capital requirements for the largest US banks, from an initial 19% to 9%. This new plan affects Bank of America, Citigroup, JPMorgan, and other large lenders. Banks with less than $250 billion in assets will remain mostly exempt, aside from provisions related to unrealized gains and losses. Mid-sized lenders face a 3-4% increase in capital requirements. Under the 2023 proposal, banks with over $100 billion in assets would have faced a 16% increase in capital requirements, with the largest banks seeing a 19% increase in CET1. The revised plan, however, suggests a 9% increase for the largest banks. Although specifics are still forthcoming, Barr noted changes to the rule’s provisions on operational, market, and credit risk, as well as reduced risk weightings for consumer-facing products like residential real estate.

While Bank of America remains solvent on paper and inflation misery is driving United Socialist America into another financial crisis, it is also understandable why Warren Buffett has been actively and methodically trimming his stake in the bank over the past few weeks. Beyond the specific issues facing Bank of America, Buffett likely anticipated that the FED would have had to surrender to the sound of the Wall Street mermaids for a pivot. As someone who has studied financial history, he knows that interest rate cuts signal an impending recession and that the financial sector typically underperforms during such times as earnings in the financial sector underperformed compared to broader indices like the S&P 500 in such an environment.
Relative 12-month Fwd EPS of S&P 500 Financials sector to 12-month Fwd EPS of S&P 500 index (blue line); FED Fund Rate (red line); Correlations and US Recessions.

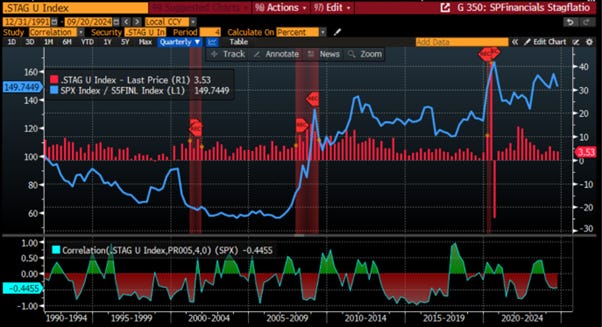
The Oracle of Omaha also understands that, rather than a traditional recession, the US, like much of the Western world under WEF-influenced governments, is heading into stagflation. Given his knowledge of financial history and the looming risk of a 1970s-style inflationary bust, exacerbated by wars, civil unrest, and increased regulation, the financial sector is expected to perform poorly in this stagflationary environment, as it has in the past.
Relative Performance of S&P 500 index to S&P 500 Financials Index (blue line); US Stagflation Proxy Index (red histogram); Correlation and US Recessions.
Last but not least, the recent decline in long-dated Treasury yields may signal an impending banking crisis and the dis-inversion of the 10-Year – 3 Months spread could make the March 2023 ‘bank walk’ and the 2008 Great Financial Crisis seem like a walk in the park.
Spread between US 10-Year Yield & US 3-Month Yield (Histogram); Relative performance of the S&P 500 index to S&P 500 Financials Index (blue line); US recessions.

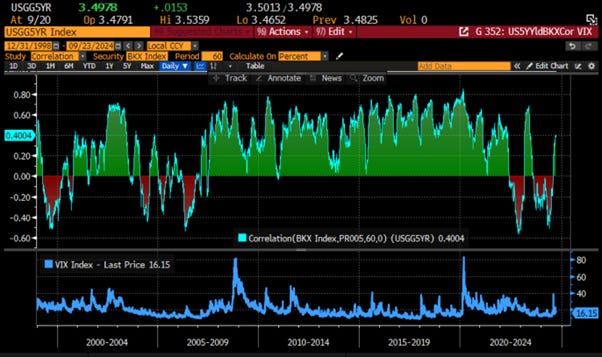
Finally, seasoned investors know than rather than to be lured by Forward confusion and illusion spread by repetitive liars such as Politicians and Wall Street Banksters, numbers never lie and looking at the 60-day correlation between the US 5-year yield and the KBW Bank Index has been on the rise again, meaning that an unfolding ‘Banking Armagedon’ is upon US which will translate into a massive underperformance of banking sector versus the S&P 500. This should keep not only any investors to stay away from the banking sector in general but also to get ready to see much higher volatility in financial markets in the coming weeks.
60-day correlation between US 5-Year Yield and KBW Bank Index (histogram, upper panel); Chicago Board Options Exchange Volatility Index (VIX Index); (blue line; lower panel).
In conclusion, anyone who has studied economics knows that recession and stagflation are detrimental to the credit cycle; it's simply a constant. The balance sheets of Bank of America, statements from Ally Financials’ CFO, and other banking actions reveal that the credit cycle has been deteriorating gradually but steadily, signalling an unfolding banking Armageddon. As we enter the early stages of the economic cycle becoming full-blown stagflation, those who have ignored warning signs in favour of a phantasmagorical ‘soft landing’ narrative are now being forced to confront reality. Meanwhile, they also hold out one last hope that the Federal Reserve will be able to save everyone when history conclusively shows the Federal Reserve, and its rate cuts NEVER save anyone at any time or anywhere…
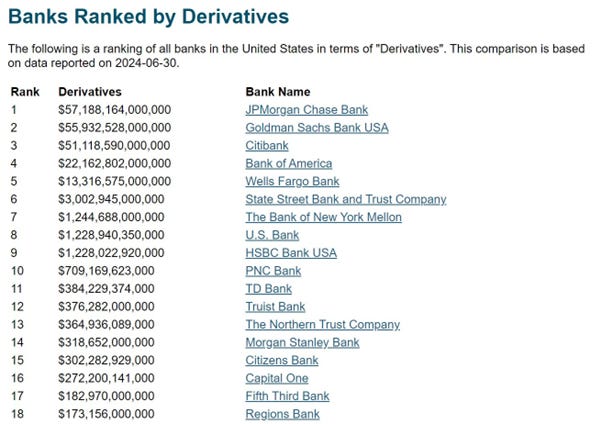
For those who still believe the government can play the role of a superhero in the next banking crisis, they should think twice. As of the end of last June, JPMorgan held over $57 trillion in derivatives, ahead of Goldman Sachs and Citibank, which held $56 trillion and $51 trillion, respectively. A simple addition reveals that the three largest US banks collectively hold approximately $164 trillion in derivatives. To put this number in perspective, that amount is nearly 5.0 times the total US public debt. In a single sentence, the 'Too Big To Fail' have become 'Too Big To Rescue.'
WHAT’S ON THE AGENDA NEXT WEEK?
The last full week of the third quarter will be marked by speeches from FOMC governors, with the most anticipated being FOMC Chair Jay Powell's on Thursday. The week will also feature the release of the flash estimates for the US Manufacturing and Services PMI indices on Monday, along with the latest estimate of second-quarter US GDP. It will conclude with the release of the Core PCE Index and updated estimates of US University of Michigan consumer expectations and sentiment data. Stock pickers will closely follow the results from Costco Wholesale and Micron.

KEY TAKEWAYS.
As Japan celebrates the Autumn equinox, here are the key takeaways:
In Japan, as the second wave of inflation gains momentum, it's only a matter of time before the Bank of Japan is forced to hike interest rates again, accelerating the financial doom loop and pushing the country toward an inevitable sovereign debt crisis.
While rising in nominal terms, the surprising rebound in US retail sales failed to mask the reality that, on an inflation-adjusted basis, retail sales have been declining since April 2021.
The politically driven and partisan FED chair's decision to cut rates by 50 bps and abandon the 2% inflation target on September 18, 2024, signals a move toward worsening stagflation, with misguided Wall Street bankers wrongly expecting rate cuts to solve problems under ongoing 'kleptocratic' and 'kakistocratic' leadership.
Even in the phantasmagorical scenario of 92 basis points rate cuts over the next 3 months, as expected by the illiterate Wall Street consensus, reckless Keynesian government spending will still lead to a higher interest burden, pushing toward yield curve control and financial repression. This will harm investors who continue to chase the ‘duration trade’ and believe that the ‘once upon a time risk-free’ U.S. Treasury remains free of risk.
Nobody needs to be a stock market legend or guru to understand what is really motivating the Oracle of Omaha to methodically unload his gargantuan stake in Bank of America.
While still solvent on paper, the reality behind Bank of America’s numbers is that the bank is effectively worthless, much like other banks were when the Global Financial Crisis emerged in 2008.
It’s not just Bank of America; other US financial institutions like Ally Financial, Citigroup, and even JPMorgan have signalled to those paying attention that the ongoing inflationary bust will have devastating impacts on the financial sector.
Around the Swiss Alps, UBS has already been employing accounting practices similar to those that led to Lehman's collapse in 2008.
In the country of the rising sun, it is Norinchukin Bank which is in the epicentre of a ‘prisoner dilemma’ which will add to the inevitable Japanese financial doom loop.
Savers who believe the FDIC and other regulators will protect their savings in the event of a ‘bank walk’ should understand that, with the rise of Keynesian communism, they are more likely to face a 'bail-in' rather than a 'bailout,' as occurred during the Icelandic financial crisis in 2008.
The consensus may still hope that the Federal Reserve will save everyone, yet history clearly shows that the Federal Reserve and its rate cuts have never saved anyone, anywhere, at any time.
Like in Iceland in 2008, investors should prepare for the implementation of capital controls and bail-ins in countries governed by WEF-sponsored governments promoting the 'You Will Own Nothing & Be Happy' narrative.
To make it simple, the 'Too Big To Fail' have become 'Too Big To Rescue.'
Under 'Kamunism' and with the war cycle advancing to a new stage, investors will once again need to focus on the Return OF Capital rather than the Return ON Capital, as stagflation spreads and a misery-driven recession loom.
To surf ‘Kamunism’, investors should focus even more on companies with low-leveraged balance sheets and strong business moats and avoid direct exposure to the financial sector.
Physical gold remains THE ONLY reliable hedge against reckless and untrustworthy governments and bankers.
Gold remains an insurance to hedge against 'collective stupidity' and government’ hegemony which are in great abundance everywhere in the world.
With continued decline in trust in public institutions, particularly in the Western world, investors are expected to move even more into assets with no counterparty risk which are non-confiscable, like physical Gold and Silver.
Long dated US Treasuries are an ‘un-investable return-less' asset class which have also lost their rationale for being part of a diversified portfolio.
In such an environment, the risky part of the portfolio has moved to fixed income and therefore rather than chasing long-dated government bonds, fixed income investors should focus on USD investment-grade US corporate bonds with a duration not longer than 12 months to manage their cash.
In this context, investors should also be prepared for much higher volatility as well as dull inflation-adjusted returns in the foreseeable future.
HOW TO TRADE IT?
After another eventful week, as Wall Street bankers and parrots continue to claim that everything is so great that the FED, just like in 2007, had to begin its interest rate cutting cycle with a crisis-like 50-bps cut to keep it that way, the S&P 500 and Dow Jones ended the week near a new all-time high, reached just a day after the FED meeting. Rather than reflecting the actual economy, the outperformance of the Dow Jones during the week, with the Nasdaq still well below its all-time high, indicates that US equities are being driven by foreign inflows.
As inflation is bottoming out and the US is already in an inflationary bust (i.e., stagflation), with central bank masquerade reaching a new level as well as the warfare across the world, investors should be on high alert. As here comes October, they should brace for a significant downside move and increased volatility, which could push equity markets back to their August 5th lows first and even lower as we near the ‘D-Day’ of the year of political hell. Despite a sharp rebound over the past month, the Nasdaq is once again testing the upper end of its recent downtrend, while the S&P 500 and Dow Jones, despite reaching new highs last week, have remained within a tight 10% range over the past two months.

In this context, it’s no surprise that Energy and Communications Services led the market following the FED pivot, while Consumer Staples and Real Estate lagged behind over the past week.

It's easy to understand that one doesn’t need to be a stock market guru or legendary economist to grasp that the unfolding inflationary bust in countries following the Keynesian policies advocated by the WEF will lead to a banking Armageddon. The first decision anyone must make is to choose wisely where to custodize their assets, not just in terms of countries, but also in terms of the banking institutions they select for business and investments. Anyone with common sense will diversify their banking relationships across countries and institutions to limit the risk of becoming collateral damage in the unfolding banking crisis. As Miguel de Cervantes famously said in Don Quixote: ‘It is the part of a wise man to keep himself today for tomorrow, and not venture all his eggs in one basket.’ This is more relevant than ever given the transformative period we are living through.

In this context, investors are advised to custodian assets across multiple countries, including those outside the sphere of influence of the World Economic Forum, which promotes the ‘You will Own Nothing and Be Happy’ narrative. To preserve financial freedom from government control, it is wise to custodize some assets in mercantilist Global South countries and nations joining the BRICS bloc. Investors should also understand that, as seen in Iceland and Cyprus, the next banking crisis, which will picture the Global Financial Crisis as a walk in the part, will unfold alongside a sovereign debt crisis in the so called Western democracies. This will not only lead to bank bail-ins instead of bailouts, but also the inevitable introduction of capital controls, starting in Europe and Japan before reaching the shores of the ‘United Socialist America’ under ‘Kamunism.’

Once investors have chosen the geographical location of their assets, they must also carefully select the banking institutions they wish to work with. As noted earlier, credit rating agencies, regulators, and the financial press cannot reliably indicate which banks are at risk of failure. In this context, ‘big’ doesn't always mean ‘safe and beautiful’. A wiser choice may be to establish banking relationships with family-owned banks that have a long history, often spanning centuries, and have successfully navigated past sovereign and financial crises. Many such institutions exist across continents, with strong reputations built through enduring difficult times, even though they may not be publicly listed entities.
Finally, anyone with common sense and financial knowledge should already realize that holding cash in a bank account is not safe and owning 1-month T-bills could also be at risk in the current environment. Investors should actively manage their cash by diversifying into a portfolio of short-dated USD investment-grade papers (maturing within 12 months) from companies with low-leverage balance sheets and strong economic moats. These companies are more likely to navigate the anticipated upcoming 4-year stagflation period with relative stability and will be safe from any reckless financial decisions taken by totalitarian governments.

To navigate increased regulation and the rising risks of social unrest and chaos both domestically and abroad, investors are also advised to hold a significant portion of their wealth in assets with no counterparty risks. This will help preserve their wealth against reckless actions by increasingly tyrannical governments. In this context, owning 20% to 40% of one's portfolio in physical gold, silver, and possibly platinum, stored outside the financial system and in jurisdictions less likely to succumb to the WEF narrative, is the way to navigate the upcoming financial thunderstorms which lie ahead of all of us. Ultimately, nobody should ever forget that the real problem is the government with its reckless spending and that taxes are only there to allow the plutocrats in power to spend more to enrich the kleptocracy (a government ruled by thieves) and the kakistocracy (a government run by unprincipled career politicians, corporations, and thieves that panders to the worst vices in human nature and has little regard for the rights of the citizens) prevailing in those countries who have been rallying to the WEF narrative.

Passive investors who understand that all indicators are screaming danger as loud, and it can and as it always did will avoid having any direct exposure to the financial sector by looking at the S&P 500 ex Financial rather than the S&P 500. As recent and long-term history has shown; by avoiding exposure to the financial sector, passive investors have been able to deliver not only a structural Alpha but also reduce the Beta of their portfolio as it has been the case since the start of the Covid pandemic.

As the ‘Too Big To Fail’ banks are now ‘Too Big To Rescue,’ the only way to protect the US economy and ensure the financial stability of the nation’s banking system is to break up the megabanks by reinstating the Glass-Steagall Act, which would separate Wall Street’s global trading houses from federally insured banks. Without this, megabanks will continue to dictate government policy, regulate their own regulators, and set the stage for the next destabilizing Wall Street and banking collapse and bring the country into more ‘forever bankers ‘wars’.
In this context, it is crucial for investors to remain humble and not let their serenity be disturbed by the noise spread by Wall Street banksters, reckless politicians, and sensationalist financial journalists. These entities aim to spread ‘Forward Confusion’ and ‘Illusion’ to expand their influence over those who are unprepared for the financial Armageddon that will wipe out the wealth of those not ready to face this environment.

Finally, investors should remember that in this environment volatility can only go one way (UP) and will increase significantly after November 5th, as neither side contesting the White House will ever accept the election results, it is important to stay hedged and prepared for a significant sling shot in the coming weeks. In this context, those who followed the recommendation earlier this month to buy a 507 Put on the S&P 500 ETF (SPY Index) expiring on November 29th can continue to hold this position and may even use this week's market rebound to add to the trade, as the premium for protecting against such a downside remains highly attractive.

If this report has inspired you to invest in gold and silver, consider Hard Assets Alliance to buy your physical gold:
https://hardassetsalliance.com/?aff=TMB
At The Macro Butler, our mission is to leverage our macro views to provide actionable and investable recommendations to all types of investors. In this regard, we offer two types of portfolios to our paid clients.
The Macro Butler Long/Short Portfolio is a dynamic and trading portfolio designed to invest in individual securities, aligning with our strategic and tactical investment recommendations.
The Macro Butler Strategic Portfolio consists of 20 ETFs (long only) and serves as the foundation for a multi-asset portfolio that reflects our long-term macro views.
Investors interested in obtaining more information about the Macro Butler Long/Short and Strategic portfolios can contact us at info@themacrobutler.com.
Unlock Your Financial Success with the Macro Butler!

If this report has inspired you to invest in gold and silver, consider Hard Assets Alliance to buy your physical gold:
https://hardassetsalliance.com/?aff=TMB
Disclaimer
The content provided in this newsletter is for general information purposes only. No information, materials, services, and other content provided in this post constitute solicitation, recommendation, endorsement or any financial, investment, or other advice.
Seek independent professional consultation in the form of legal, financial, and fiscal advice before making any investment decisions.
Always perform your own due diligence.