


Just A Disinflationary Illusion…


What’s behind the numbers?
Following the cooling of inflation pressures over the last 3 months, July’s headline CPI was broadly in line with expectations, rising 0.2% MoM. Year-over-year, the headline CPI rose by 2.9%, below the consensus of +3.0% and lower than the +3.0% YoY change in June, the lowest since March 2021.
Under the hood, the food index increased 0.2% over the past year. The shelter index rose 0.4% MoM and accounted for 90% of the monthly increase, while used car prices and airfare were deflationary. In general, goods deflation continues to drag the overall CPI lower.

The core CPI also rose by +0.2% MoM, in line with expectations and one tick higher than in June. On a YoY basis, due to a favourable base effect, core CPI rose 3.2%, slowing from +3.3% in June and marking the slowest pace since April 2021. While the core CPI is slowing YoY, core goods deflation appears to have stalled.

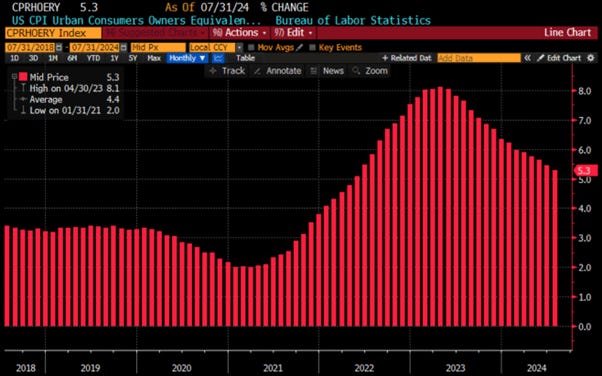
Owners' Equivalent Rent (OER) rose by 0.36%, reaccelerating from the 0.27% increase in June, suggesting that the June drop could be an anomaly in the statistical series. On a positive note, this 0.36% increase is still below levels observed since the start of the COVID pandemic, and due to the base effect, the YoY change is now at 5.3%, the lowest since May 2022.
A data point that will undoubtedly please Wall Street bankers who are still daydreaming about the FED pivot is the Super Core CPI. While it also rose by 0.2% MoM, it decelerated to 4.73% YoY from 4.9%, thanks to a favourable base effect. However, it remains at the most elevated level since May 2023 and well above the 2% inflation target.

Market reactions.
Stocks were mixed on Wednesday after the CPI failed to match the hallucinatory dovish tone of the PPI report from Tuesday. Although the CPI was in line with expectations, the report suggested some signs of an illusory disinflation in the months ahead. Despite this, all US indices ended in the green, with the Dow outperforming both the S&P 500 and the Nasdaq.

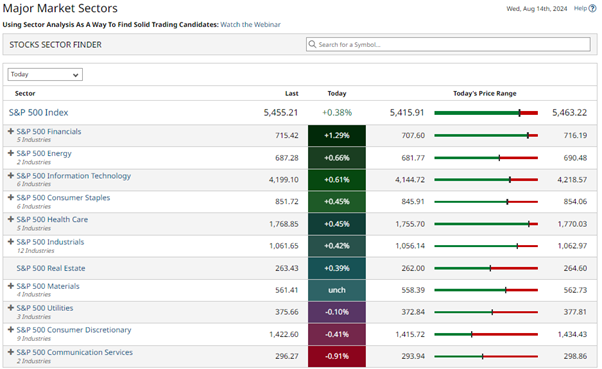
Sectors were very mixed, with growth sectors such as Communication, and Discretionary lagging, while Financials and Energy outperformed.
In money markets, while the consensus still believes the FED might initiate its much-anticipated and still phantasmagorical pivot in September, the probability of an even more unlikely 50-basis point cut on September 18th has declined to 39%. Despite this, Wall Street continues to anticipate that the FED will cut rates by a total of 100 basis points over the final three meetings of the year.

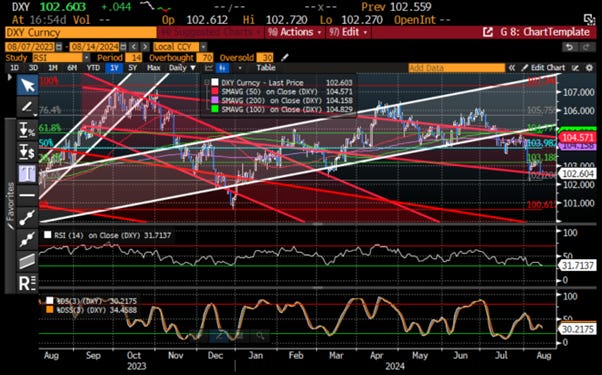
The Dollar was volatile in response to the US CPI data, which was mostly as expected, leading to initial weakness and a drop in the dollar index to 102.26 before losses reversed, with the CAD, Cable, and Yen also weakening.
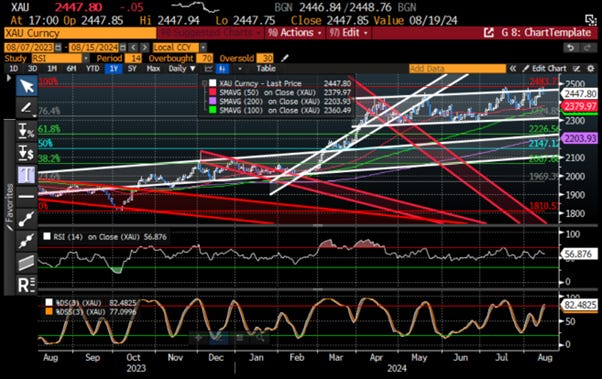
Gold failed to capitalize on the USD weakness and pulled back from Tuesday’s bounce, as technicals remain tight in the short term.
Treasuries were almost unchanged on the day, as the consensus remains lured by the once upon a time safe haven status of US Treasuries and the illusion of immaculate disinflation in the months ahead.

Thoughts.
After a series of hot CPI prints in Q1 2024 and cooling CPI in the second quarter, the third quarter started with a reacceleration at the headline and core levels, as widely expected by the consensus. While some may still believe in the information delivered by the ‘CP-Lie’ and do not understand the concept of base effect, the reality is that the rate of CPI increase over the past four years is on track to match a decade-long rise not seen since the 1970s and 1980s.

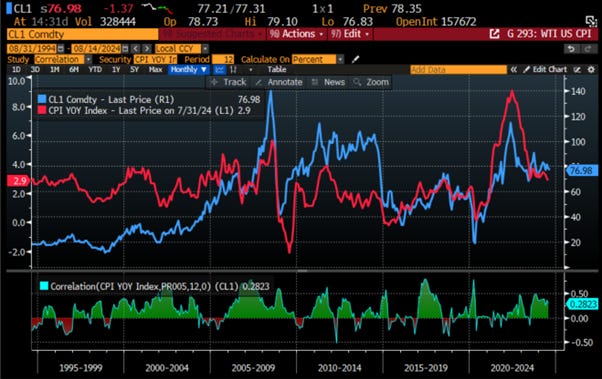
With oil prices rebounding by more than 10% over the past week and showing no signs of peaking as geopolitical tensions in the Middle East and Eastern Europe are unlikely to ease, investors should expect HIGHER CPI data before the end of the year of political hell.
WTI Price (blue line); US CPI YoY Change (red line) & Correlation.
Instead of spreading the illusion that the 2% target is achievable sooner rather than later, investors with a basic understanding of mathematics will arrive at three simple conclusions:
A return to 2.0% is almost impossible in 2024. Even if the CPI prints a 0.0% MoM for the rest of the year, the YoY change will end at 2.54%.
If a 0.1% MoM change comes back for the rest of the year, as it was in Q2, the CPI YoY change will end 2024 at 3.05%.
If the MoM change reaches 0.2% or higher, which has been the case in July and could happen easily if oil and commodity prices rebound further and supply chains constraints spread to the US, the YoY change will end the year between 3.6% and 5.1%.

Looking ahead, investors should not expect inflation in the US or elsewhere in the Western world to return to the 2% target anytime soon. Since the start of the Covid pandemic, there have been structural shifts that are inflationary rather than deflationary. Key factors contributing to this structurally higher inflation environment include:
Deglobalization: With rising polarization around the world, trade blocs have replaced global competition, pushing inflation structurally higher.
Protectionism: Tariffs and trade barriers have increased imported prices in the US and Europe for the foreseeable future.
Monopolistic Technology: Although the AI revolution is still largely hyped, it is driven by oligopolies rather than disruptors. This makes AI likely less deflationary compared to the Internet and PCs in their early days.
Demographics: With fewer producers and more consumers, the power has shifted from capital to labour.
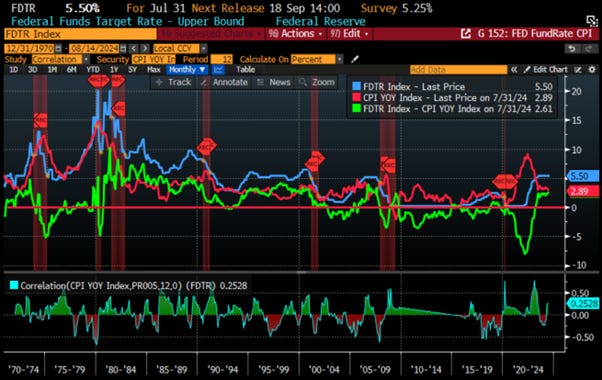
In this context, in the US, the 2% target is now at best a floor rather than a ceiling or average. This means that in a 3%-4% inflation environment, a 5% interest rate is not restrictive.
FED Fund Rate (blue line); US CPI YoY change (red line); Spread between FED Fund Rate & US CPI YoY Change (green line) and correlation.
At the end of the day, before popping the champagne and declaring inflation a thing of the past, investors must remember that historically, inflation moves in waves. The 2020s resemble the 1940s and 1970s, with geopolitical unrest (i.e., wars) and structural inflation related to tighter regulations (associated with the climate change scam and the ludicrous Diversity, Equity, and Inclusion narrative) that are constraining supply.

In this context, the FED has reached a ‘fork in the road’ in its fight against inflation. Choosing the high road and cutting rates in September would mean that the 2% inflation era has ended. If the FED remains committed to its 2% inflation target, given the persistent inflation ahead, it will likely disappoint Wall Street’s expectations of a rate cut on September 18th. This is particularly true because, regardless of who occupies the White House in January 2025, fiscal dominance rather than fiscal profligacy will characterize the next four years. For the bond market, this means that long-dated Treasury yields, even without considering the issues related to reckless fiscal policy, are too low, and the term premium has only one way to go: up.
US CPI YoY change (blue line); US 10-Year Yield (red line); US Term Premium on a 10-Year Zero Coupon (green line).

For equity investors, what ultimately matters, is the ability of corporates to pass through higher costs to end consumers. The spread between core CPI and core PPI is a leading indicator of corporate margins and a catalyst for higher equity valuations.
12-months forward P/E (blue line); Spread between US core CPI & PPI (red line) & Correlation.

At the end of the day, the recent disinflation has a flavour of ‘déjà vu all over again’ because if the FED capitulates on its 2% inflation target and embraces the political and Wall Street narrative that a rate cut is now needed in September, the US will most likely see inflation reaccelerate just like in the 1980s, and Jerome Powell will be remembered as the Arthur Burns of the 21st century. This second wave will push the US into the 'inflationary bust' phase of the business cycle (i.e. stagflation), if it is not already the case. This means that people will buy even less for even more and this environment will be painful for those who are still blindly following the 'Forward Confusion' narrative of Wall Street.

Bottom line: It is far too early to declare that we have seen the trough in US CPI. While the pace of inflation has come down, it is still growing, and consumers in some regions of the US, like New York or Dallas, are still dealing with inflation in excess of 4.0%. Additionally, with geopolitical and social unrest both domestically and abroad, stagflation is anticipated in the coming months. Similar to the 1940s and 1970s, marked by geopolitical turmoil and wars, holding equities and hard assets (physical gold) in limited supply, rather than long-dated bonds, appears to be the most effective strategy for safeguarding investors' purchasing power.
Key takeaways.
After hot CPI prints in Q1 and cooler data in Q2, Q3 started with a MoM rebound, which was widely expected. The data continue to highlight the erratic process of reining in the inflation genie. As mentioned by the FED chairman and some FOMC governors, this should not yet be sufficient to ease the monetary policy the FED is well aware that wars will trigger the upcoming second inflation wave.
Ongoing supply chain disruptions triggered by geopolitical tensions in the Middle East and elsewhere and further regulation related to the climate change scam in the US ahead of the presidential election are yet to start fuelling additional upward pressure on goods inflation in the coming months.
With services unlikely to moderate and election-related uncertainties impacting growth, the path forward in the US appears to lead to stagflation, marked by inflationary pressures and economic stagnation.
In a stagflationary environment, investors need to understand that protecting their wealth involves avoiding long-dated government bonds and focusing on a combination of equities from companies that can maintain pricing power with strong balance sheets and robust business models and physical gold as THE antifragile asset.
As stagflation rather than recession materializes in the next few months, investors should prepare their portfolios for HIGHER volatility.
In this context, investors should also remain prepared for dull inflation-adjusted returns in the foreseeable future.
Bottom line:
The latest CPI and PPI data will keep the FED between a rock and a paradox. Some may argue that the last 3 months of cooler-than-expected CPI are enough for the FED to pull the pivot trigger. However, with the September meeting only seven weeks away from the culmination of the year of political hell (November 5th election), a cut in September would put Jerome Powell in the political spotlight, something he likely wants to avoid, even it is an open secret that he is in favour of another 4 years for the current Keynesian plutocrats in power in Washington. In the context of a weaponized economy, with rising risks of shortages due to supply chain disruptions, climate change, and DEI-related regulations, as well as a massive fiscal deficit that is unlikely to end regardless of the next president, Powell is unlikely to act too early as he knows he could end up like Arthur Burns in Wall Street history books.
To navigate the rise of volatility in the weeks ahead, investors should continue to prioritize investments in low-leverage companies capable of sustaining EPS and FCF growth amid economic weakness. This mostly includes sectors like Energy and Tech with quasi-monopolistic positions. In fixed income, investors should steer clear of long-dated bonds, particularly government bonds with a maturity of more than six months. If they truly want a fixed income allocation, they should consider investment-grade corporate issuers with maturities no longer than 12 months. Long-dated fixed income investments should be replaced by physical gold; silver and other hard commodities, comprising between 20% and 40% of the portfolio, depending on the investors’ risk profile. These new antifragile assets will benefit from a scarcity premium during times of war and the rising risks of an upcoming sovereign debt crisis, first in Japan and Europe and then in the US.
If this report has inspired you to invest in gold and silver, consider Hard Assets Alliance to buy your physical gold:
https://hardassetsalliance.com/?aff=TMB
At The Macro Butler, our mission is to leverage our macro views to provide actionable and investable recommendations to all types of investors. In this regard, we offer two types of portfolios to our paid clients.
The Macro Butler Long/Short Portfolio is a dynamic and trading portfolio designed to invest in individual securities, aligning with our strategic and tactical investment recommendations.
The Macro Butler Strategic Portfolio consists of 20 ETFs (long only) and serves as the foundation for a multi-asset portfolio that reflects our long-term macro views.
Investors interested in obtaining more information about the Macro Butler Long/Short and Strategic portfolios can contact us at info@themacrobutler.com.
Unlock Your Financial Success with the Macro Butler!

If this report has inspired you to invest in gold and silver, consider Hard Assets Alliance to buy your physical gold:
https://hardassetsalliance.com/?aff=TMB
Disclaimer
The content provided in this newsletter is for general information purposes only. No information, materials, services, and other content provided in this post constitute solicitation, recommendation, endorsement or any financial, investment, or other advice.
Seek independent professional consultation in the form of legal, financial, and fiscal advice before making any investment decisions.
Always perform your own due diligence.
As I say in my weekly Smart Money commentary: Expect the unexpected. There are no coincidences. Just events.
It seems as if, just as the housing shortage has become structural, so has inflation - at least in the practical sense, like grocery bills and rents, which is what most people deal with on a frequent basis. It may not get worse, but a tangible lowering isn't going to happen soon. Good summary!