
Monetary Illusion


THE WEEK THAT IT WAS...
The final week of January marked both the Lunar New Year and a critical period for investors, as attention shifted to central bank meetings. The FOMC, ECB, and Bank of Canada convened on Wednesday and Thursday. Additionally, the earnings season for the Magnificent 7 began, with Tesla, Meta, Microsoft, and Apple set to report their results, along with 102 other S&P 500 companies.
The first major economic data of 2025, marking the end of the Year of the Wood Dragon, revealed alarmingly weak Chinese manufacturing and non-manufacturing PMIs, highlighting that recent stimulus failed to boost entrepreneur optimism. The manufacturing PMI fell to 49.1 in January from 50.1 in December, entering contraction and missing forecasts, including our 49.7 estimate and the 50.1 consensus. The non-manufacturing PMI dropped sharply to 50.2 from 52.2, barely above the 50 threshold and below the 52.2 consensus. Services declined to 50.3 from 52.0, while construction plummeted to 49.3 from 53.2, signalling a broad slowdown beyond typical Lunar New Year seasonal weakness.


As widely expected, the increasingly political and partisan ECB cut rates by 25bps, marking its fifth consecutive cut since launching its easing cycle in June 2024. The deposit facility, main refinancing operations, and marginal lending facility rates will decrease to 2.75%, 2.90%, and 3.15%, respectively, effective February 5, 2025. Repeating its usual stance, the ECB reiterated in its policy statement and press conference that it is not pre-committing to a specific rate path but remains committed to stabilizing inflation at 2%. The central bank stated that the disinflationary process is on track and expects inflation to return to 2% this year.
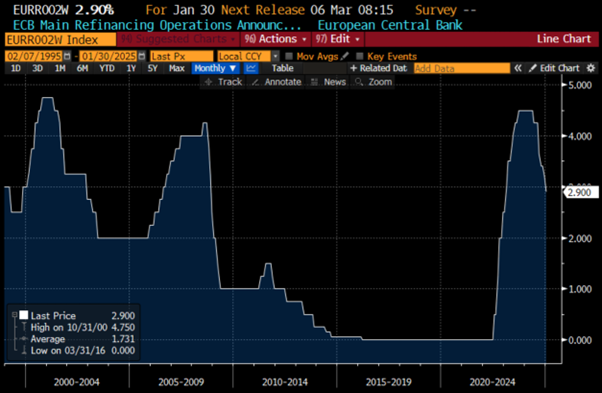
While the ECB still calls its monetary policy “restrictive” despite January’s cut, signaling further easing ahead, anyone analysing the business cycle through market data rather than political propaganda knows the eurozone remains in an inflationary environment. Indeed, an inevitable inflationary bust looms as U.S. tariffs on European goods take effect and the Ukraine-Russia war escalates, further straining an economy governed by reckless Keynesian leaders.

The January FOMC meeting, the first one since the 47th US president took office, was largely a language cleanup. As expected, the Fed held rates at 4.25%–4.5% after a 100-bps cut in late 2024. Officials acknowledged inflation remains “somewhat elevated” but removed references to progress toward 2%. They also noted unemployment has “stabilized at a low level,” a shift from previous language suggesting labor market easing. Powell downplayed any policy shift, reiterating the Fed’s commitment to 2% inflation and stating it’s too early to assess the impact of tariffs and immigration.

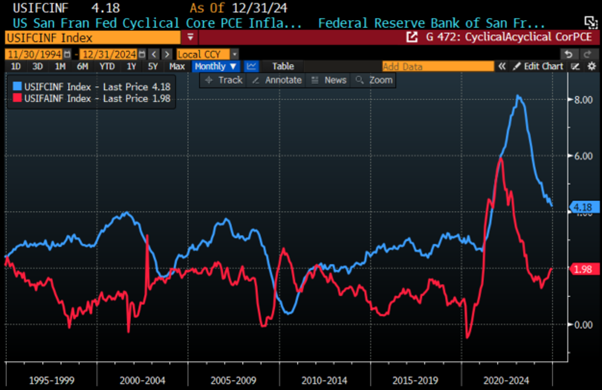
The FED's (old) favourite inflation indicator (until they changed their minds because it didn't fit the narrative), Core PCE, printed at +2.8% YoY (flat from the prior month), in line with market expectations, as it is simply derived from core CPI and PPI. The so-called SuperCore inflation remains persistently high at +3.49% YoY, well above the FED's mandate. While Cyclical PCE continues to decline but is still sticking above 4.0%, Acyclical inflation, the segment the FED cannot effectively 'manage', keeps rising, making the slow-burn reflation an increasing challenge in the months ahead.
US San Francisco FED Cyclical Core PCE (blue line); US San Francisco FED Acyclical Core PCE (red line).
In this context, Wall Street bankers and their parrots are once again deluding themselves into believing that the increasingly impotent FED will continue cutting rates, even as the 47th U.S. president implements tariffs and tighter immigration policies that will fuel both inflation and stagflation. While the FED's dot plots still project two rate cuts this year, the consensus assigns a 87% probability, with the first expected in June and the second in December, well past the first 100 days of the new presidency. By then, the U.S. economy will likely be in an inflationary bust, forcing the FED to raise rates if it remains committed to combating inflation for the benefit of American citizens.

Investors who analyse the financial world through the lens of the business cycle and use market ratios to allocate their portfolios among the four asset classes of the Permanent Brown Portfolio understand that, beyond the constant noise generated by Wall Street and its parrots, there are two key financial ratios that shape the business cycle across its four quadrants. Additionally, one ratio has historically served as a leading indicator of shifts between economic booms and busts over time: the valuation of a country's stock market relative to the price of gold, measured against its 7-year moving average. This ratio, often referred to as the indicator of monetary illusion, provides critical insights into the economy's health and direction.
Monetary illusion occurs when individuals perceive their wealth, income, or purchasing power based solely on nominal values, disregarding the effects of inflation or deflation. This cognitive bias can lead to flawed financial decisions, such as mistaking nominal wage increases for real gains in purchasing power, even when inflation erodes actual income. On a broader scale, monetary illusion influences economic behaviour, affecting consumption, savings, and investment patterns. For example, during inflationary periods, consumers may feel wealthier due to higher nominal wages or asset prices, even if there is no real increase in economic value. Similarly, businesses might misinterpret rising revenues as improved performance without accounting for inflation-adjusted profitability. Policymakers may also exploit this illusion by implementing inflationary measures to stimulate spending, masking the long-term erosion of purchasing power.

The best example of monetary illusion happened in 2024 when all major equity markets in the world recorded positive performance in their local currency while it is clear to anyone who can understand that these returns was only illusions as when measured in gold terms, these performances were negative.

As January 2025 is now in the history books, media highlights the apparent strength of European equity markets, with the UK FTSE hitting new highs in local currency. However, measuring performance in local currencies is misleading. To accurately gauge market performance, returns should be assessed in a common currency, such as the US dollar or gold, which accounts for global value and strips away distortions like currency fluctuations and inflation. Without this perspective, nominal gains can create an illusion of prosperity, masking the true international value of investments.
For enthusiasts of luxury branded cars, the Ferrari 308, particularly the GTB and GTS models, was a highly desirable sports car during the 1980s. Between 1985 and 1988, the price of a new Ferrari 308 in the UK typically ranged from £25,000 to £35,000, depending on the model, optional features, and market conditions. In 1985, a new Ferrari 308 GTB or GTS might have cost around £25,000 to £28,000 in London, while in New York, it was priced between $35,000 and $40,000. This implied a "red Ferrari exchange rate" (GBP/USD) of roughly 1.14, compared to the actual average exchange rate of 1 GBP = 1.30 USD at the time. The Ferrari 308 gained popularity in the U.S. partly due to its appearance in the TV show Magnum, P.I., which enhanced its cultural appeal. However, it remained a luxury item, with prices reflecting its status as a high-performance, exotic sports car. By 1988, the price of a new Ferrari 308 in London remained relatively stable at £30,000 to £35,000, while in New York, prices rose to $45,000 to $50,000. This implied a GBP/USD exchange rate of 1.42, compared to the actual average rate of 1 GBP = 1.80 USD that year. While the Ferrari 308's price in London saw little change between 1985 and 1988, it increased by 25% in New York. Many at the time believed the car itself had appreciated in value, while in reality it was largely a currency-driven phenomenon. Without considering currency fluctuations, the true picture was missed entirely as it is nowadays in financial markets.
GBP/USD FX Rate between December 31st 1984 and December 31st 1988.

Returning to financial markets, one doesn’t need a PhD in technical analysis to understand that the performance of the FTSE index differs significantly when expressed in local currencies versus USD. As the USD rallies, UK share prices appear cheaper, much like the Ferrari 308 did between 1985 and 1988. In this context, nobody will be surprised that while the FTSE 100 has reached new highs in pounds, it has not achieved new highs in USD since October 2007. This discrepancy highlights the importance of evaluating market performance in a common currency to gain a clearer, more accurate perspective, free from the distortions of exchange rate fluctuations.
Performance of the FTSE 100 Index in local currency rebased at 100 as of December ,29th, 1995.

Performance of the FTSE 100 Index in USD, rebased at 100 as of December 29th, 1995.

Savvy investors understand that the definition of a bull market is an asset or an index that rallies in terms of all key currencies. When it rises only in local currency terms, it reflects a domestic shift rather than genuine international strength. Examining the FTSE 100's performance in gold terms makes it clear to anyone who can read a chart that the UK equity market is not in a bull market as some in Canary Wharf try to pretend but has been in a bear market since December 1999. This perspective underscores the importance of measuring performance against stable, universal benchmarks to avoid the distortions of currency fluctuations and monetary illusion.
Performance of the FTSE 100 Index in GBP (Blue line) in Gold terms (red line), rebased at 100 as of December 29th ,1995.

"Follow the money, and you will find the culprit," as the adage goes. This time, it’s not money but gold leaving the UK in anticipation of capital controls and a sovereign debt crisis on that side of the pond.

https://www.ft.com/content/86a5fafd-603e-4ee1-9620-39b5f4465f53
Since the U.S. election in November, gold traders and financial institutions have moved 393 metric tonnes into Comex vaults, pushing inventories up nearly 75% to 926 tonnes, the highest since August 2022. This month alone, Comex gold inventories have surged 36%, with 244 metric tonnes of inflows, the largest monthly increase since May 2020.

This raises a critical question for investors: what single store of value can measure global asset performance without bias from monetary illusion? First, what defines a store of value? It is an asset, currency, or commodity that preserves purchasing power over time, resisting depreciation and remaining stable or appreciating relative to inflation and economic shifts. Its effectiveness hinges on scarcity, durability, and broad acceptance. Crucially, a store of value differs from money, which facilitates exchange but fluctuates with economic cycles. History shows that no system, whether gold, fiat, or Bitcoin, can eliminate the business cycle. As former Federal Reserve Chairman Arthur Burns acknowledged, the business cycle always prevails. Supply and demand drive everything; nothing is immune to fluctuation, not even gold.

Consider 1985, when the pound fell to $1.03. Americans bought British assets as if they were on sale, while Brits thought they were overpaying. Yet, prices soared afterward. Why? Because value is relative, and markets are driven by cycles, not static measures. The illusion of stability is just that, an illusion.
In this context, claiming that Bitcoin, gold, or any asset is a ‘store of wealth’ is either misleading or ignorant. Take, for example, the price of an average house in the U.S. measured in both USD and gold terms. Over the past 50 years, its value has fluctuated significantly, ranging from 113 ounces of gold to over 800 ounces at the peak of the housing bubble in March 2001. In USD terms, the same house rose from less than $200,000 in 1963 to over $500,000 by the end of September 2024. When measured in Dow Jones units, the value of the average U.S. house peaked in June 1982 at over 105 units, only to hit a historical low of less than 12 units by the end of September 2024. These fluctuations demonstrate that no asset is immune to volatility, undermining the notion of a static "store of wealth."
Price of an average US house in Gold (blue line); Dow Jones (red line); USD (green line) since 1963.

What investors must understand is that nothing is a store of value across history because EVERYTHING will rise, and fall based on supply and demand.

There is significant confusion about modern money, with many assuming governments create it directly, as in ancient times. After 600 BC, states minted coins for trade but soon exploited "seigniorage," profiting by declaring currency value higher than its metal content. Today, money is virtual, existing as electronic entries. For instance, when a foreign investor converts currency to buy domestic real estate, they expand the money supply through book entries, not central bank action. Similarly, banking leverages deposits; $1,000 deposits can result in two accounts reflecting $1,000 each, even though no new physical money is created. This virtual nature means bank panics can occur if everyone withdraws funds loaned elsewhere. Clearly, money is no longer a store of value, as its purchasing power fluctuates with economic cycles. Since governments monetized profit creation centuries ago, wealth preservation now depends on tangible assets, not money itself.

For those who believe the recent surge in Bitcoin signals it will replace the USD as the world’s reserve currency, such belief amounts to propaganda. Bitcoin is simply a trading vehicle which has been created to facilitate money laundering, not a currency. While this may be an unpopular view, investors should remember that much speculation surrounds its origins. Bitcoin (BTC) was created on January 3, 2009, by the mysterious figure or group known as Satoshi Nakamoto, who has been absent since 2011. Yet, 1 million Bitcoins remain untouched in their original account. Valued at over $70 billion at the time of writing, this wallet represents 3% of all mined Bitcoin, making its owner, if an individual, one of the top 15 richest people globally.

https://bitinfocharts.com/top-100-richest-bitcoin-addresses.html
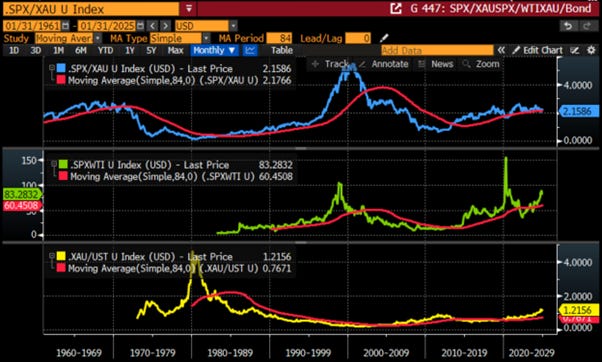
Bitcoin’s price volatility mirrors the 1966 mutual fund bubble, where funds were listed and traded at premiums to net asset value (NAV). When the bubble burst, investors lost heavily, as funds crashed 70-90% despite the Dow dropping only 26.5%. This led to mutual funds being delisted and traded solely at NAV. Similarly, Bitcoin’s value fluctuates at 10x the volatility of the dollar, making it an ‘hazardous store of wealth’ and purely a speculative trading vehicle, akin to commodities like wheat or cattle. While profits can be made, Bitcoin is not a stable store of value, it rises and falls like any other asset. The idea of Bitcoin replacing the dollar misunderstands what defines a reserve currency. Once the S&P 500-to-Oil ratio falls below its 7-year moving average, signalling an economic bust, Bitcoin will once again depreciate against gold, further undermining its role as a reliable value reserve. In a nutshell, Bitcoin is a high-volatility asset class, neither a stable currency nor a store of value.
S&P 500/Oil ratio (blue line); 84 months Moving Average of the S&P 500/Oil ratio (red line); Bitcoin to Gold ratio (yellow line).

This brings us back to how investors should allocate their portfolios in the current phase of the business cycle. Given that the U.S. is the only major economy still in an inflationary boom, it should come as no surprise that the U.S. equity market will continue to outperform the other major equity markets of the G4 economies (U.S., China, Eurozone, and Japan) when measured in a common unit of valuation such as gold.
Performance of S&P 500 Index (blue line); CSI 300 Index (red line); EuroStoxx 50 (green line); Nikkei 225 (yellow) in Gold terms rebased at 100 since December 31st 2019.

Those familiar with the Permanent Browne Portfolio know it can be divided into contracts on one side (i.e., cash and bonds) and properties on the other (i.e., equity and gold). According to Keynesian theory, contracts like cash and bonds are seen as stores of value, with governments acting as economic guarantors of safety for their citizens. However, this view overlooks the fact that governments can default on their obligations and arbitrarily redefine what constitutes cash. A closer look at government bond indices across the G4 economies (i.e., the U.S., China, Europe, and Japan) reveals that, when measured in gold terms, these bond markets have been poor stores of value since the start of the decade. This challenges the Keynesian assumption and highlights the limitations of relying solely on government-backed contracts for wealth preservation.
Performance of US Treasury Index (blue line); China Government bond index (red line); German Bond Index (green line); Japan Government Bond Index (yellow) in Gold terms rebased at 100 since December 31st 2019.

Investors understand that markets are ultimately driven by liquidity, so it should come as no surprise that the rate of change in the USD liquidity proxy index is closely correlated with the rate of change in the S&P 500 to Gold ratio and its movement around the 7-year moving average. Since October 2024, shadow liquidity has been tightening and turned negative on a yearly basis, reinforcing the downtrend that began after the ratio peaked in February 2024. This trend will likely lead to a break below the 7-year moving average in the coming months—a development that has historically been a poor omen for the U.S. economy and equity markets. History shows that elevated risk assets tend to underperform following significant liquidity spikes, and with gold outpacing the S&P 500's total return since 2021, this may signal an imminent economic bust in the U.S.
Upper Panel: USD Liquidity Proxy 12-month rate of change (yellow histogram); Lower Panel: S&P 500 to Gold ratio (blue line); 7-year Moving Average of the S&P 500 to Gold ratio (red line).

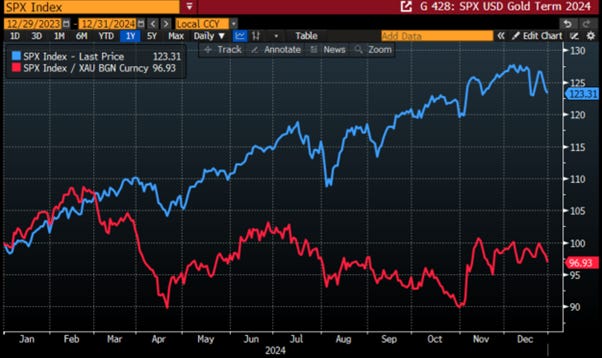
In this context, the misleadingly called barbaric rock appears on track to beat stocks again in 2025, as it did in 2024.
2024 Performance of S&P 500 index in USD (blue line); Performance of S&P 500 index in Gold terms (red line) (rebased at 100 as of December 29th, 2023).
As every savvy investor knows, a profitable company will eventually redistribute part of its earnings as dividends, and these dividends tend to increase over time for well-managed businesses. Examining the aggregate annual dividend of S&P 500 companies in USD terms, it has risen from $0.72 in December 1936 to $73.80 as of December 2024. While the S&P 500's dividend has increased more than 100-fold in USD terms over the past 88 years, when measured in grams of gold, it has fluctuated between 2.5 and 0.25 over the same period—consistently reverting to its historical mean of around 1 gram. This trend can be explained by the fact that investors can always choose between two approaches:
Sell 1 gram of gold annually to generate income as a rentier.
Relying on the dividends paid by the 500 largest U.S. companies to live off their returns.
Both strategies achieve the same goal, with the key difference being that the second approach preserves the investor’s capital (aside from market fluctuations), while the first gradually consumes it, allowing one to live a peaceful life under a tree, spending 1/100 of their capital each year. So, the "deal" offered by the U.S. stock market seems to be the following: entrust it with your capital, and you'll receive the same income as if you had held onto your gold over the long term. However, unlike gold, you can recover your full capital at any time by selling the S&P.
Historically, it has been more favourable to choose the S&P 500 over gold when the index's dividend yield was trading at one standard deviation below its historical average (0.54 grams). Conversely, owning gold over the S&P 500 was preferable when the dividend yield traded above one standard deviation above its historical average (1.57 grams). At 0.7874 grams as of the end of December 2024, the S&P 500 dividend appears undervalued relative to gold, a trend that could reverse either through rising dividends over the next 12 months or a decline in the gold price relative to the S&P 500 dividend with the former more likely to happen than the later.
Dividend per share of S&P 500 index in USD (blue line); Dividend per share of the S&P 500 index expressed in grams of gold (red line).

Simply put, the market offers rentiers the opportunity to "rent out" their capital for an income equivalent to what they would earn annually if they gradually liquidated their gold holdings. This dynamic encourages passive rentiers to become entrepreneurs while minimizing risk by focusing on companies with a strong track record of dividend growth. And when you think of all the technocrats whose sole objective is to seize investors' wealth, one can't help but appreciate the generosity of the market, which enables investors to live off their income without eroding their capital. You know what? Long live the market, down with the technocrats.

As tariffs are increasingly used as tools of negotiations or even to ignite more forever kinetic bankers’ wars, it’s clear the world is heading toward a depression for some nations, driven by an impending sovereign debt crisis. Meanwhile, the US, leveraging its monetary hegemony, will enter what history may recall as the ‘Trump stagflation.’ Trump and his administration, enamoured with its newfound power, believes it can dictate economic outcomes. However, the global business cycle, evident since the Panic of 1857, cannot be altered, regardless of who sits in the Oval Office. Trump’s outdated tariff strategy, aimed at reducing trade deficits, will backfire, even harming the US economy. Rather than spreading peace, as he mentioned during his inauguration speech, the 47th U.S. president risks following in the footsteps of Woodrow Wilson in 1913, potentially igniting the next global conflict. Indeed, higher tariffs will deepen recessions outside the US, reduce US exports, and trigger a global economic contagion that will eventually engulf the US economy. While Trump may achieve short-term gains through 2026, the broader crisis, rooted in global economic interdependence, will intensify. The political system’s flaws will persist until post-2032 reforms establish a better framework. In a nutshell, the business cycle will unfold as it always has, indifferent to political leadership.

To weather the upcoming storms, holding physical gold, the only antifragile asset with no counterparty risk, alongside a portfolio of short-dated investment-grade (IG) USD bonds with maturities of less than 12 months and Treasury bills (T-bills) with maturities not exceeding 3 months, will provide stability as Trump’s economic decisions lead to ‘Trump Stagflation.’ As savvy investors know, during periods of inflation, it is essential to remain underweight in the contracts of the Browne Portfolio (i.e., cash and bonds) and overweight in the properties of the same portfolio (i.e., stocks and gold), with a particular emphasis on physical gold as the US economy transitions from the current inflationary boom to an inflationary bust.
Among equities, the best way to navigate the upcoming inflationary bust in the US is to invest in what can be termed the "Smart Defence Portfolio," comprising IT, Energy, and Aerospace Defence stocks. Preference should be given to Energy and Aerospace Defence as the economic cycle transitions from an inflationary boom to an inflationary bust.
By doing this, investors will continue to prioritize the RETURN OF CAPITAL over the RETURN ON CAPITAL, enjoying both peace of mind and preserved wealth.
WHAT’S ON THE AGENDA NEXT WEEK?
The first week of the second month of the jubilee year will focus investors on U.S. Manufacturing and Non-Manufacturing PMI data, as well as the January Non-Farm Payroll report on Friday. It also marks the second leg of earnings season for the Magnificent 7, with Alphabet and Amazon reporting alongside 126 other S&P 500 companies.

KEY TAKEWAYS.
As the second month of the jubilee year starts, the key takeaways are:
China’s January 2025 PMI data revealed alarming weakness, signalling that ‘Make China Great Again’ remains a phantasmagoria, as the broad economic slowdown extended far beyond seasonal trends.
The ECB's latest rate cut underscores its ongoing easing cycle, but with persistent inflation, impending U.S. tariffs, and geopolitical risks, the eurozone faces an inevitable inflationary bust.
The FED held rates at 4.25%–4.5%, stressing it's too early to assess tariffs and immigration while remaining politically data-dependent but economically irrelevant.
The Core PCE inflation held steady at 2.8% YoY, but stubbornly high SuperCore and rising Acyclical inflation signal a slow burn reflation ahead.
Monetary illusion distorts financial decisions by focusing on nominal values, ignoring inflation, leading to misinterpreted gains and eroded purchasing power.
A store of value is scarce, durable, and widely accepted and preserves purchasing power over time
Money facilitates exchange but fluctuates with economic cycles and doesn’t preserve purchasing power over time.
Bitcoin is neither a store of value nor money, but a trading tool created to facilitate money laundering and cater to the speculative interests of certain investors.
As volatility is expected to rise, investors should favour antifragile assets like gold over bonds, as gold offers low equity correlation, stability, and resilience against currency debasement.
In such environment, investors will once again need to focus on the Return OF Capital rather than the Return ON Capital, as stagflation spreads.
Physical gold remains THE ONLY reliable hedge against reckless and untrustworthy governments and bankers.
Gold remains an insurance to hedge against 'collective stupidity' and government’ hegemony which are in great abundance everywhere in the world.
With continued decline in trust in public institutions, particularly in the Western world, investors are expected to move even more into assets with no counterparty risk which are non-confiscable, like physical Gold and Silver.
Long dated US Treasuries and Bonds are an ‘un-investable return-less' asset class which have also lost their rationale for being part of a diversified portfolio.
Unequivocally, the risky part of the portfolio has moved to fixed income and therefore rather than chasing long-dated government bonds, fixed income investors should focus on USD investment-grade US corporate bonds with a duration not longer than 12 months to manage their cash.
In this context, investors should also be prepared for much higher volatility as well as dull inflation-adjusted returns in the foreseeable future.
HOW TO TRADE IT?
The last week of the first month of the jubilee year was another volatile one, with equity markets swinging between lows and highs, driven by continued hopes for a perpetual Goldilocks macro environment and the threat of tariffs. Notably, the Dow Jones was the only one of the three major indices to end the week in the green, once again outperforming the Magnificent 7, the S&P 500, and the Nasdaq. This week’s trend mirrored the broader pattern since the start of the year, with the Dow Jones recording its best start since 2019, while the S&P 500 and Nasdaq lagged. As of January 31, 2025, all three major U.S. indices, Dow, S&P 500, and Nasdaq, remain in bullish daily reversals, but the Nasdaq’s relative weakness to the Dow highlights an ongoing rotation from growth stocks to more value-oriented stocks, reflecting the U.S. economy’s gradual shift from an inflationary boom to an inflationary bust.
In this context, it is not surprising that Communication Services and Consumer Staples outperformed, while Energy and IT lagged behind.

As of January 31st , 2025, the US remains in an inflationary boom, but with the S&P 500 to Gold ratio ending the first month of the year below its 7-year moving average, an inflationary bust will materialize much sooner than Wall Street pundits and their parrots are eager to tell their clients. In this context, investors should stay calm, disciplined, and use market data tools to anticipate changes in the business cycle, rather than fall into the forward confusion and illusion spread by Wall Street.
In an environment of monetary illusion, fueled by additional tariffs that will inevitably push the world from an inflationary boom to an inflationary bust, the USD and physical gold will rise against all fiat currencies, as it has been the case in recent history.
Upper Panel: S&P 500 to Gold ratio (blue line); 7-year Moving average of the S&P 500 to Gold ratio (red line); Second Panel: Gold to Bonds ratio (green line); 7-year Moving average of the Gold to Bonds ratio (red line); Third Panel: 12-month rate of change of Gold price in USD (yellow histogram); Lower Panel: 12-month rate of change of USD Index (green histogram).

For equity investors, it is clear that monetary illusion and rising geopolitical tensions will funnel more capital into the U.S. stock market, prolonging American exceptionalism far beyond most investors' expectations.
Upper Panel: S&P 500 to Gold ratio (blue line); 7-year Moving average of the S&P 500 to Gold ratio (red line); Second Panel: Gold to Bonds ratio (green line); 7-year Moving average of the Gold to Bonds ratio (red line); Third Panel: Relative Performance of MSCI World ex US to S&P 500 Index (purple line); Lower Panel: 12-month rate of change of MSCI World ex US to S&P 500 Index ratio (yellow histogram).

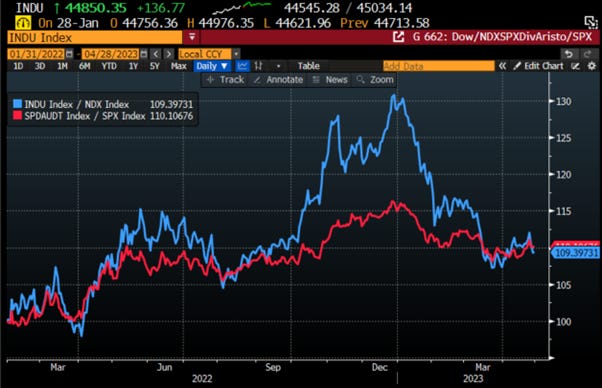
As the monetary illusion ultimately accelerates the shift of the U.S. economy from the current inflationary boom to an inflationary bust, investors will sooner rather than later rediscover the importance of dividends in investing. Historically, the Nasdaq tends to outperform the Dow during an inflationary boom, while the reverse holds true during an inflationary bust. Similarly, the S&P 500 Dividend Aristocrats outperform the broader S&P 500 index when the U.S. economy transitions into an inflationary bust, as demonstrated between January 2022 and April 2023.
Relative performance of Dow Jones to Nasdaq (blue line); S&P 500 Dividend Aristocrat to S&P 500 index (red line) between January 2022 and April 2023.
Investors who prefer single stocks should focus on companies with a strong track record of growing EPS, sales, dividends, and FCF, a net debt-to-equity ratio below 50%, and a current dividend yield above 3%. As of the end of January 2025, only six companies in the S&P 500 meet these criteria, most of which are in the energy sector.

A backtest of this systematic and disciplined quantitative approach has delivered a total return of 72.8% since the start of the decade, outperforming the S&P 500 Dividend Aristocrats by more than 23% over the past four years.

As the global economy, including the U.S., transitions into an inflationary bust, gold remains the ultimate antifragile asset, outperforming government bonds, cash and Bitcoin. Fixed-income assets, once a staple of the Permanent Browne Portfolio, are now more "pipe dream" than reliable. Savvy investors have learned that once the economy is in an inflationary bust, they will have to focus exclusively on energy producers, aerospace defence, and energy infrastructure equities to secure returns and navigate this challenging period. In the years ahead, wealth preservation will depend on physical gold and disciplined equity selection, not on fleeting Wall Street recommendations but based on a disciplined and unbiased quantitative process. This strategy provides a shield against wars, reckless government policies, and the looming spectre of ‘Trump Stagflation.’ which will lead into World War 3.

If this report has inspired you to invest in gold, consider Hard Assets Alliance to buy your physical gold:
https://www.hardassetsalliance.com/?aff=TMB

Disclaimer
The content provided in this newsletter is for general information purposes only. No information, materials, services, and other content provided in this post constitute solicitation, recommendation, endorsement or any financial, investment, or other advice.
Seek independent professional consultation in the form of legal, financial, and fiscal advice before making any investment decisions.
Always perform your own due diligence.
https://open.substack.com/pub/maxkern/p/the-moral-compass?r=3bp1hq&utm_campaign=post&utm_medium=web&showWelcomeOnShare=false
I agree that tarrifs should be inflatory for the US and that the inflation is underreported in EU, as everywhere, most of the time...
but if Trumps enacts significant tarrifs for EU exporters, I would expect to be deflationary for the EU ... already now, "growth" is poor in the EU, but if would be discounted with "real inflation" it is already negative even now ....
What do you think?