
Pipe It UP...


THE WEEK THAT IT WAS...
The second full week of 2025 shifted investors' focus back to consumer health in the US and China, with the release of December retail sales data. In the US, attention was also on the final CPI report before the 47th President-elect’s inauguration. Additionally, the week marked the official start of the Q4 2024 earnings season, with reports from 21 S&P 500 companies, including JPMorgan, BlackRock, Goldman Sachs, Citigroup, and UnitedHealth.
Unsurprisingly, China met its 5% GDP growth target for 2024, but weak consumption and decelerating investment signal underlying challenges. Q4 growth accelerated to 5.4%, driven by industrial production and retail sales, but the lack of recovery momentum after the first wave of stimulus raises concerns, especially with potential tariff increases under US President-elect Trump. Stimulus and fiscal policy clarity could be expected at the March’s National People’s Congress.

In a rare sequence, the US PPI was released before the CPI this month. While analysts correctly predicted reflation, they overestimated its magnitude, as the PPI rose 0.2% MoM (+0.4% expected), lifting the YoY PPI to +3.3% from +3.0% prior (though below the +3.5% expectation), but the highest level since February 2023. The PPI surge was driven by the largest MoM increase in energy costs since February, partially offset by a significant decline in food prices, which returned to MoM deflation. Core PPI remained flat MoM, keeping the YoY Core PPI steady at +3.5%.

The final U.S. CPI data for the year rose by 0.4% MoM, matching expectations and up from November's 0.3%, while the YoY increase climbed to 2.9% from 2.7%. Energy prices, though deflationary YoY, accounted for 40% of the increase due to a 4.4% gasoline surge, while food inflation hit its highest YoY rate since January 2024. Core CPI rose 0.2% MoM and 3.2% YoY, slightly below expectations, with core services slowing to 3.37% YoY and core goods remaining deflationary. Marking 55 consecutive months of MoM core CPI gains, this data challenges the feasibility of achieving the FED's 2% inflation target by 2025 or even beyond. Returning to 2% would require sub-0.2% monthly CPI increases throughout 2025, a near impossibility given anticipated tariff-driven inflation under the new administration. If monthly inflation averages 0.3% or higher, YoY CPI could reach 3.7% to 6.0%, most likely forcing the FED to confront policy missteps amid an ongoing inflationary boom.

U.S. retail sales for the holiday season rose 0.4% MoM on a non-inflation-adjusted basis, falling short of the expected +0.6% MoM. Ten of the report's 13 categories showed increases, including gains at furniture and sporting goods stores. Auto sales advanced by 0.7% after robust gains in the prior two months, driven by President-elect Donald Trump’s threat to end tax credits for electric vehicles, along with lower interest rates and greater manufacturer incentives. Receipts at gasoline service stations also increased, reflecting higher prices at the pump.

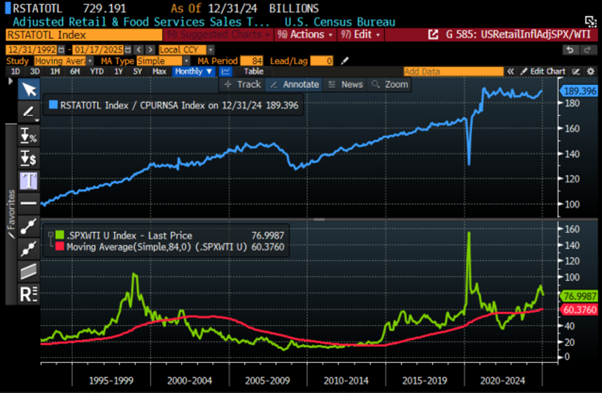
Although the headline figure suggests a robust economic environment, investors should note that retail sales are reported in nominal terms (not adjusted for inflation). When adjusted for inflation, U.S. retail sales peaked in April 2021, underscoring the undeniable trend that the U.S. economy is heading toward an inflationary bust sooner than most Wall Street analysts predict.
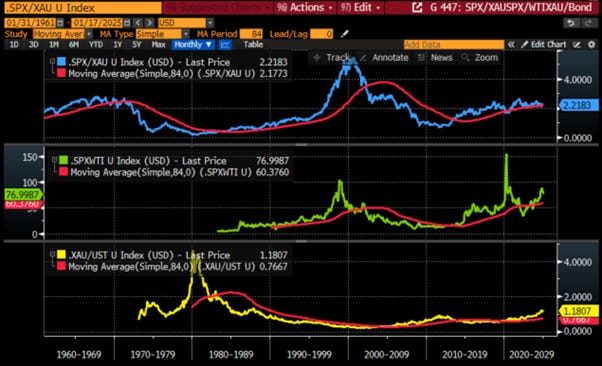
US Retail Sales Adjusted to inflation (i.e. CPI) (blue line); S&P 500 to WTI ratio (green line); 84-months Moving Average of the S&P 500 to WTI ratio (red line).
In this context, Wall Street bankers and their supporters are once again deluding themselves into believing that the now impotent FED will continue cutting rates, even as the 47th U.S. president implements tariffs and tighter immigration policies that will fuel both inflation and stagflation. While the FED's dot plots still project two rate cuts this year, the consensus assigns a 50% probability, with the first expected in July and the second in December, well past the first 100 days of the new presidency. By then, the U.S. economy will likely be in an inflationary bust, forcing the FED to raise rates if it remains committed to combating inflation for the benefit of American citizens.

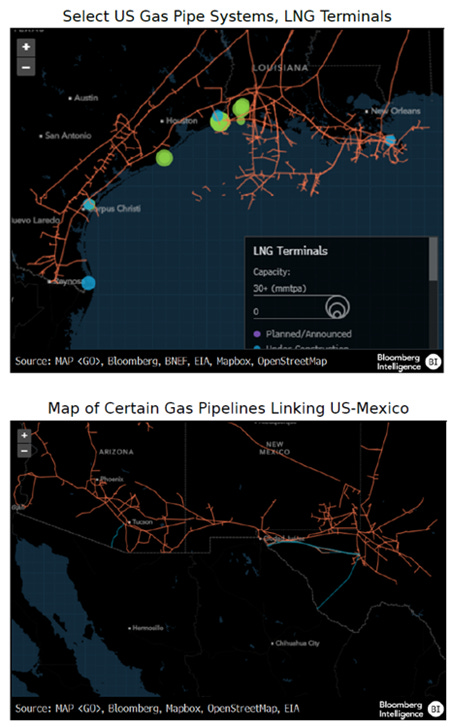
Investors familiar with the business cycle and the Permanent Browne Portfolio understand the pivotal role of energy prices, particularly oil, in driving economic shifts between boom and bust, and ultimately between inflation and deflation as energy costs indirectly influence whether the bond market serves as a reliable store of value. Securing abundant and affordable energy should, therefore, be a top priority for governments worldwide. While energy prices are widely recognized as critical, the often-overlooked challenge lies in ensuring access. The 47th U.S. president-elect's ‘Drill Baby Drill’ agenda emphasizes easing regulations to boost production over the next four years. However, this overlooks a key reality: affordable energy depends as much on robust infrastructure to deliver energy from production to consumption as on regulatory freedom to drill.
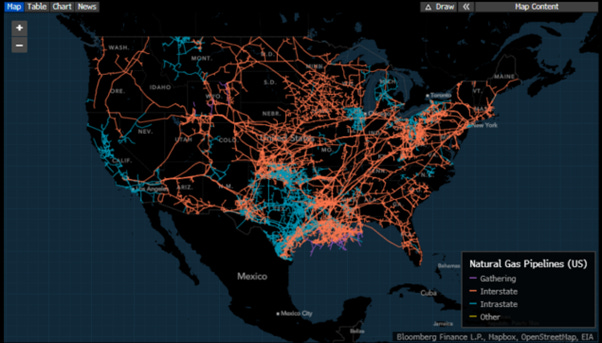
The U.S. energy infrastructure, largely privately owned, is vital for economic and national security, delivering electricity, oil, and natural gas. The U.S. oil and gas infrastructure, one of the world's most extensive systems, includes over 2.6 million miles of pipelines, refineries, storage facilities, and export terminals. Pipelines form its backbone, efficiently transporting crude oil, natural gas, and refined products nationwide. Refineries, especially along the Gulf Coast, support domestic and export markets by processing crude into fuels and petrochemicals. Investments in liquefied natural gas (LNG) export terminals have solidified the U.S. as a global LNG leader. However, aging infrastructure, regulatory hurdles, and geopolitical risks threaten reliability and growth The Bipartisan Infrastructure Deal dedicates $62 billion to upgrading clean energy systems, boosting manufacturing, and strengthening supply chains.
Outside of its strategic and critical role in the well-functioning of the US economy, the US oil and gas infrastructure sector offers an interesting diversification from fixed income assets for income investors who understand the impact of currency debasement (i.e., inflation), on the return of the contract parts of the Browne Permanent Portfolio. In this context, it should come as no surprise to anyone with a modicum of knowledge about portfolio allocation in an inflationary environment that the Alerian MLP Infrastructure Index, a market-cap-weighted index of companies earning the majority of their cash from midstream energy and commodity activities, has outperformed the contracts within the Browne portfolio (i.e., the Bloomberg US Treasury Index and the Bloomberg US Treasury Bill Index) when the US economy is in an inflationary phase.
Upper Panel: Gold to Bond ratio (blue line); 84-Month Moving Average of Gold to Bond Ratio (red line); Lower Panel: Relative Performance of the Alerian MLP Infrastructure index to Bloomberg US Treasury Index (green line); Relative Performance of the Alerian MLP Infrastructure index to Bloomberg US Treasury Bill Index (yellow line).

Looking at the relative performance of the energy infrastructure sector versus the contract assets of the Browne Portfolio during an economic bust (i.e., when the S&P 500 to oil ratio is below its 7-year moving average), it's clear that an economic downturn is not necessarily a headwind for the energy infrastructure sector compared to Treasuries and T-bills over the long term. No PhD in finance from Yale or Harvard is needed to understand this dynamic.
Upper Panel: S&P 500 to WTI ratio (blue line); 84-Month Moving Average of S&P 500 to Oil Ratio (red line); Lower Panel: Relative Performance of the Alerian MLP Infrastructure index to Bloomberg US Treasury Index (green line); Relative Performance of the Alerian MLP Infrastructure index to Bloomberg US Treasury Bill Index (yellow line).

As the US economy shifts slowly but surely from an inflationary boom into an inflationary bust, the relative performance of the energy infrastructure sector during the most recent inflationary bust (from January 2022 to October 2023) shows that it has outperformed stocks, bonds, and cash. This indicates that an allocation to the sector has provided alpha to investors able to think outside the box and preserve wealth during an inflationary bust, a period of the business cycle where preserving capital is often more important than achieving returns on capital.
Relative Performance of the Alerian MLP Infrastructure index to S&P 500 index (blue line); Relative Performance of the Alerian MLP Infrastructure index to Bloomberg US Treasury Index (red line); Relative Performance of the Alerian MLP Infrastructure index to Bloomberg US T-Bill Index (green line) between January 2022 and October 2023.

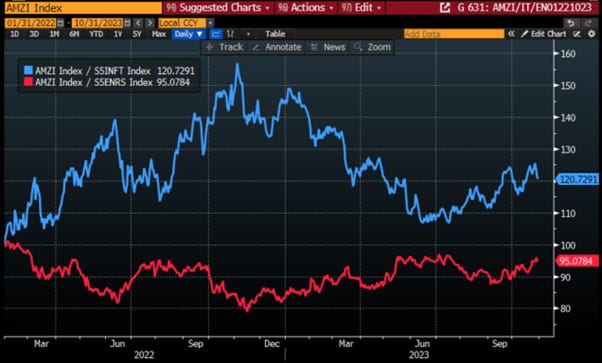
Investors who have taken the time to study how to allocate their equity portfolio in an inflationary bust, unlike the YOLO investors still predominating in the current euphoric market environment, know that in such a phase of the business cycle, they must sell the rallies in stocks of equity consumers (proxied by the IT sector) and buy the dips in equity producers (proxied by the energy sector). Looking at the performance of the energy infrastructure sector versus the IT sector and the energy sector during the most recent inflationary bust (i.e., between January 2022 and October 2023), while the infrastructure sector underperformed the energy sector, it outperformed the IT sector. This suggests that investors should view the energy infrastructure sector as a substitute for the fixed income portion of their portfolio rather than the equity portion during an inflationary bust.
Relative Performance of the Alerian MLP Infrastructure index to S&P 500 IT index (blue line); Relative Performance of the Alerian MLP Infrastructure index to S&P 500 Energy Index (red line) between January 2022 and October 2023.
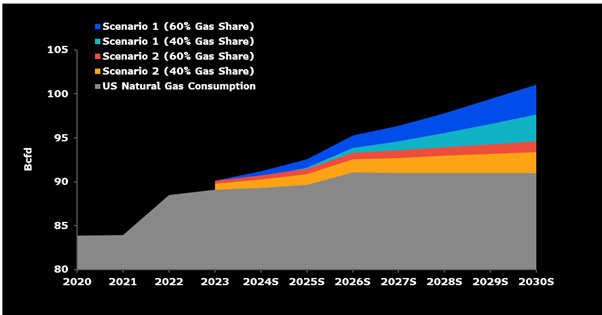
The Energy infrastructure sector is also a growth sector as the rise of artificial intelligence and data centres could add 3–10 billion cubic feet per day (bcfd) to U.S. natural gas demand by 2030, representing 10–30% of current gas-fired power generation and total consumption of about 90 bcfd. This surge, driven by the expansion of data centres and cloud infrastructure, would reshape the gas landscape. Upstream producers like EQT, Range, Southwestern, and Chesapeake are well-positioned to meet this demand, while midstream operators such as Kinder Morgan, TC Energy, and Energy Transfer will play critical roles in connecting supply to key consuming hubs.

Energy infrastructure companies, particularly MLPs, are known to generate steady cash flows as fee-based businesses, offering attractive yields. Unlike other entities, MLPs are not taxed at the entity level, enabling them to distribute more cash as either qualified dividends or return of capital, which can provide tax advantages for investors. In 2025, midstream energy dividend yields remain higher than those of utilities, REITs, and the broader market, offering an alternative to Treasury and investment-grade bond yields.

The midstream sector includes many lower-beta stocks, appealing for their stability and earning’s growth. Among 23 energy infrastructure peers, the average beta is 0.72. Cheniere Energy Partners (0.42), MPLX (0.52), and Enterprise Products Partners (0.54) are the least volatile, supported by low leverage and stable cash flows. TC Energy (0.89) and Antero Midstream (0.88) have the highest betas but remain below 1, indicating relative stability. Lower volatility in midstream stocks help mitigate portfolio risk especially in an environment where bonds have become the real risky asset.

Midstream free cash flow (FCF) is expected to rise in 2025, supported by lower capital spending for some operators and favourable M&A comparisons for others. Consensus estimates suggest the sector’s average FCF yield could exceed 5% in 2024, though market capitalization shifts may affect yields. Distribution increases remain a priority, with excess FCF likely directed toward growth investments, M&A, and opportunistic buybacks.

The average net debt-to-Ebitda ratio of midstream peers is expected to improve to around 3.8x in 2025, following a steady 4x in 2023-24. Strong Ebitda growth will offset modest increases in net debt. After significant deleveraging efforts in 2020-21, many operators now prioritize returning capital to shareholders through distribution hikes and buybacks, while also reinvesting in growth and M&A.

North American midstream capital spending is expected to remain flat in 2025, with declines at companies like TC Energy and Targa offset by increased investments and recent acquisitions by others. Growth projects coming online from 2022-25, along with M&A activity, are driving solid EBITDA expansion, particularly in the Permian and Gulf Coast regions. Blended production growth in North America may be limited to low-single digits, as many publicly traded E&Ps remain disciplined with capital spending amid forecasts of volatile oil prices and uncertain demand. While oil output in the Permian Basin is expected to rise modestly, natural gas prices could increase due to higher power and LNG export demand, benefiting Haynesville production. Infrastructure constraints may limit Appalachia gas output.

From a longer-term perspective, US natural gas demand could grow by at least 14 billion cubic feet per day (13.5%) from 2024-30, driven by rising LNG feedgas needs and pipeline exports to Mexico, boosting midstream EBITDA. This figure excludes industrial and AI-driven data-centre power demand, with LNG being the primary growth driver. Feedgas for US LNG exports is expected to rise by 12 billion cubic feet per day (90%) from 2024-29, driven by projects under construction and potential new terminals. LNG growth will benefit natural gas producers in the Permian, Haynesville, and Eagle Ford, as well as midstream operators like Kinder Morgan, which handles half of all gas to US LNG terminals, and Enbridge, which transports about 15%.

US natural gas exports to Mexico were up 4% in 2024 to 6.5 billion cubic feet per day, with potential for another 2 bcf/day growth by 2030. About 10 new combined-cycle gas plants in Mexico, expected to open by 2025, could require nearly 1 bcf/day of gas. The growing US gas supply, strained Mexican production, nearshoring, and data-center growth are driving cross-border trade. Wood Mackenzie forecasts 3 bcf/day growth in US-Mexico gas pipelines through 2030.

Pipeline operators in Texas and Louisiana, including Kinder Morgan, TC Energy, and Energy Transfer, are well-positioned to benefit from growing feedgas demand for LNG exports. Key projects like DT Midstream's LEAP, Momentum's NG3, and Williams' LEG will boost Haynesville gas to the Gillis Hub, while Energy Transfer’s Gulf Run will supply Golden Pass LNG. Plaquemines LNG will be supplied by Enbridge, Kinder Morgan, and TC Energy. Kinder’s Evangeline Pass projects could add $130 million in annual EBITDA, with Williams’ LEG contributing $80 million. Oneok may build the Saguaro Connector Pipeline if Mexico Pacific's Saguaro Energia LNG moves forward. These companies can capitalize on unused capacity to increase volumes with minimal extra spending, with Kinder Morgan handling about half of US-Mexico gas exports.
As the worst-case scenario of an inflationary bust materializes in market data, investors are reminded that GOLD, NOT BONDS, remains THE ANTIFRAGILE ASSET to hold. However, for investors seeking an income investment strategy, the energy infrastructure sector offers a way to boost returns during an inflationary bust, when the return OF capital must take priority over the return ON capital. By replacing bond allocations with energy infrastructure and using a diversified portfolio of short-dated investment-grade bonds to manage cash actively, investors will be able navigate this challenging period smoothly. Among equities, investors already know they will need to shift from energy-consuming sectors like IT to energy-producing sectors such as oil and gas.
WHAT’S ON THE AGENDA NEXT WEEK?
The week of the 47th U.S. president's inauguration will be another shortened holiday week, beginning with Martin Luther King Jr. Day. Investors will primarily focus on the second week of earnings season, with 50 S&P 500 companies reporting results, including Halliburton, Netflix, Freeport-McMoRan, and American Express. On the macroeconomic front, attention will turn to the University of Michigan’s Consumer Inflation Expectations and the S&P Manufacturing and Services Flash PMI. Outside the U.S., the Bank of Japan meeting will be the key event for global investors.

KEY TAKEWAYS.
As the 47th U.S. president is inaugurated, key takeaways include:
China hit its 5% GDP growth target for 2024, but weak consumption and investment, coupled with potential tariff hikes under Trump, highlight underlying challenges to ‘Make China Great Again.’
The December CPI report shows inflation persisting above target levels, with fading disinflationary effects and upcoming tariff-driven pressures making the Fed's 2% goal by 2025 increasingly phantasmagorical.
US holiday retail sales fell short of expectations, with inflation-adjusted figures highlighting an approaching inflationary bust.
Energy infrastructure, alongside regulatory freedom, is crucial for ensuring affordable energy.
Recent history shows that U.S. oil and gas infrastructure sector provides attractive diversification for income-focused investors, especially in an inflationary environment.
During economic busts, the energy infrastructure sector has proven its resiliency not only versus the S&P 500 index but also versus bonds and cash.
During an inflationary bust, the energy infrastructure sector outperformed energy consuming sector but not energy producing sector, suggesting it should be seen as a substitute for the fixed income portion of a portfolio, rather than the equity portion, in such a phase.
The future growth of energy infrastructure is powered by the growing demand for natural gas to fuel AI and data centres, creating a surge in the need for infrastructure to connect supply with demand.
Energy infrastructure MLPs offer higher, tax-advantaged yields than utilities, REITs, and bonds, making them a return-enhancing alternative to pipe up returns.
As the year to come is expected to be much more volatile, investors should favour antifragile assets like gold over bonds, as gold offers low equity correlation, stability, and resilience against currency debasement.
In such environment, investors will once again need to focus on the Return OF Capital rather than the Return ON Capital, as stagflation spreads.
Physical gold remains THE ONLY reliable hedge against reckless and untrustworthy governments and bankers.
Gold remains an insurance to hedge against 'collective stupidity' and government’ hegemony which are in great abundance everywhere in the world.
With continued decline in trust in public institutions, particularly in the Western world, investors are expected to move even more into assets with no counterparty risk which are non-confiscable, like physical Gold and Silver.
Long dated US Treasuries and Bonds are an ‘un-investable return-less' asset class which have also lost their rationale for being part of a diversified portfolio.
Unequivocally, the risky part of the portfolio has moved to fixed income and therefore rather than chasing long-dated government bonds, fixed income investors should focus on USD investment-grade US corporate bonds with a duration not longer than 12 months to manage their cash.
In this context, investors should also be prepared for much higher volatility as well as dull inflation-adjusted returns in the foreseeable future.
HOW TO TRADE IT?
The second full week of the new year marked the first positive week for U.S. equity markets as the "Trump Trade" reignited ahead of the January 20th inauguration and bank holiday. It was a clear "risk-on" week, though unexpectedly, the Dow outperformed the S&P 500, Nasdaq, and even the Magnificent 7, which lagged in this supposedly "Goldilocks" environment. While all major US indices closed the week above their 50-day moving averages, only the Dow printed a bullish daily reversal, whereas the S&P 500 and Nasdaq remained in the downtrend initiated since their mid-December all-time highs.

The bear steepener, in place since the first rate cut last September, alongside the de-inversion and subsequent steepening of the U.S. 10-year and 2-year yield spread since late October, makes the recent outperformance of the Dow versus the Nasdaq unsurprising to those with even a basic understanding of financial markets. This trend is likely to remain a key investment theme over the next 12 months.

As expected, Energy stocks once again led the gains this week, followed by Financials and Materials, while Communication Services, Consumer Staples, and Healthcare lagged.

Investors who can connect the dots globally recognize that Trump's tariff strategy, intended to reduce the trade deficit and fund the government by eliminating income tax, is flawed. U.S. companies left not because of cheaper overseas labor, but due to high domestic taxes—fix the tax system, and they will return without tariffs. While tariffs may seem appealing, relying on them to fund the government promotes protectionism, retaliatory actions, and harms the global economy and the mandate of the 47th US president will ultimately be remembered as the Trump Stagflation.
As of January 17th, 2025, the U.S. remains in an inflationary boom, but with the S&P 500 to Gold ratio shivering just above its 7-year moving average, an inflationary bust will materialize much sooner than any Wall Street pundits and their parrots are keen to tell to their clients. In this context, investors should stay calm, disciplined, and use market data tools to anticipate changes in the business cycle rather than fall into the Forward Confusion and illusion spread by Wall Street.
As the energy infrastructure sector appears to be a return-enhancing alternative to fixed-income investments in an inflationary boom-and-bust environment, investors must think outside the traditional 60/40 portfolio to navigate the challenging years ahead. This approach not only provides a return OF capital but also a return ON capital above the inflation rate. In this context, investors can access the US Energy Infrastructure sector, which offers higher income than bonds, utilities, and REITs, through various avenues. Energy infrastructure companies are generating strong free cash flow, with lower growth capital spending and enhanced financial flexibility. Over 90% of AMZI constituents have increased dividends in the past year, and many have buyback authorizations. The simplest way to invest is through the Alerian MLP ETF (AMLP US), which tracks the Alerian MLP Infrastructure Index (AMZI), focusing on MLPs that generate most of their cash from midstream activities.

Investors who prefer single stocks can screen the universe of energy infrastructure companies using criteria such as positive free cash flow (FCF) and dividend growth over the past five years, along with a dividend yield of over 5%, to select the top performers in the sector. As of early January 2025, this screening highlights eight companies.

The backtest of this quantitative screening has delivered a 204% total return from December 31, 2020, to December 31, 2024, outperforming the Alerian MLP Infrastructure ETF (AMLP), which posted a total return of 189% over the same period.

As the world, including the US shifts slowly into an inflationary bust, GOLD, rather than government bonds or Bitcoin, remains the ultimate antifragile asset to hold. In this context, everyone must remember that fixed-income assets are ‘pipe dreams’ among the 4 assets classes of the permanent Browne portfolio, making energy infrastructure equities the alternative to ‘pipe returns up’ as a source of recuring inflation adjusted income. Ultimately, in 2025, investors must look beyond the smoke and mirrors, recognizing that wealth preservation lies in owning physical GOLD and equities of energy producers and infrastructure companies, which offer protection against the effects of wars, reckless government policies, and stagflation.
If this report has inspired you to invest in gold, consider Hard Assets Alliance to buy your physical gold:
https://www.hardassetsalliance.com/?aff=TMB

Disclaimer
The content provided in this newsletter is for general information purposes only. No information, materials, services, and other content provided in this post constitute solicitation, recommendation, endorsement or any financial, investment, or other advice.
Seek independent professional consultation in the form of legal, financial, and fiscal advice before making any investment decisions.
Always perform your own due diligence.
Thanks for this, it's always nice when a pro comes to the same conclusion as I have.
Half a yr ago I bought a large position (for me) in ET and Range Resources and they have done spectacularly.
I'm going to look though some of the other pipe line and gas producing companies you recommended and see if I can find any that aren't already at, or near their all time highs.
I agree 100% with you on AU and would be interested in your thoughts on silver.
At an 88+ to 1 ratio I find myself going for the silver when I want to add to my stack.
I'll keep an eye on your work and if you make me money, I'll send some your way.