


Shield Wealth With Smart Defence


THE WEEK THAT IT WAS...
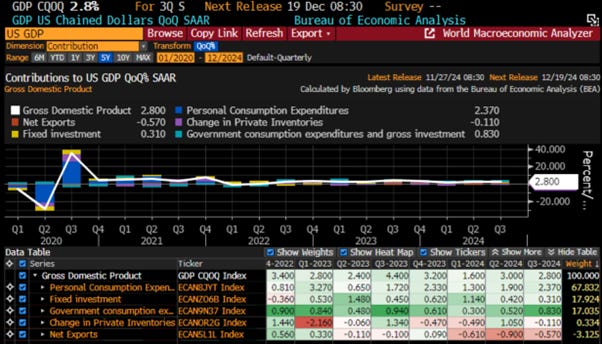
The final week of November was a shortened holiday week in the US, as Americans celebrated Thanksgiving. The only major events were the release of the core PCE index, personal income and spending data for October, and the final estimate of Q3 2024 GDP.
The Q3 2024 US ‘Government Domestic Product’ report provided insight that businesses and consumers were already preparing for a rise in trade barriers on foreign goods. US real imports, indicative of goods stockpiling, and personal consumption expenditures contributed the most to economic growth during the quarter outside rising government spending which were probably used as an additional spending to the ongoing campaign.
Monthly headline PCE inflation held steady at 0.2%, while core PCE rose 0.27% month-over-month, slightly below expectations, with year-over-year core PCE ticking up to 2.8%. Supercore PCE inflation, Chair Powell’s preferred measure, climbed to 0.4%, driven mainly by financial services, with three- and six-month annualized rates rising to 3.5% and 2.9%.

Personal spending grew 0.4% (real spending up 0.1%), while income increased 0.6%, boosted by a 0.5% rise in employee compensation. The personal saving rate improved to 4.4% but remains below pre-pandemic levels.

Bottom line: The October report indicates significant softening in real spending on interest-sensitive durable goods and discretionary services. However, slowing disinflation momentum and rising consumer incomes, which could drive prices higher, call for caution as the US economy is slowly but surely moving into an inflationary bust.
The minutes of the latest FOMC meeting revealed, unsurprisingly, that the pre-election, partisan-driven consensus for cutting rates has shifted, with many governors now suggesting the FED could pause easing and maintain restrictive rates if inflation stays elevated. Notably, Chairman Jerome Powell and other senior officials referred to recent inflationary pressures as a ‘bump’ and anticipate more in the future. Nevertheless, they remain confident inflation will trend toward their 2% target by 2026. Overall, the minutes were slightly less hawkish than the previous month, but this seems almost irrelevant as bond vigilantes now appear to be driving long-term yields.

Bottom line: While even the FED has admitted that there is still a long way to go to reach its mandated 2% inflation target, and with inflation already moving in the wrong direction ahead of the implementation of tariffs, Wall Street, which still discounts a 25 bps cut in December at 66% and expects more than four rate cuts by the end of 2025, needs to realize that the FED has become completely irrelevant to the economy. Bond vigilantes, not the FED, dictate where long-dated yields, and inevitably mortgage rates and the cost of financing and refinancing for Corporate America, will move.

Investors understand how the business cycle and liquidity influence portfolio performance, guiding allocations across the four asset classes of the Permanent Browne Portfolio. Active investors can adjust these allocations dynamically, aiming to exceed the 3%-4% annualized real return the portfolio delivers in peacetime.
As a reminder, each phase of the business cycle favours a specific asset class:
Contracts (government bonds and cash) are the preferred assets during a deflationary boom and bust, respectively.
Properties (equities and physical gold) are favoured during an inflationary boom and bust, respectively.
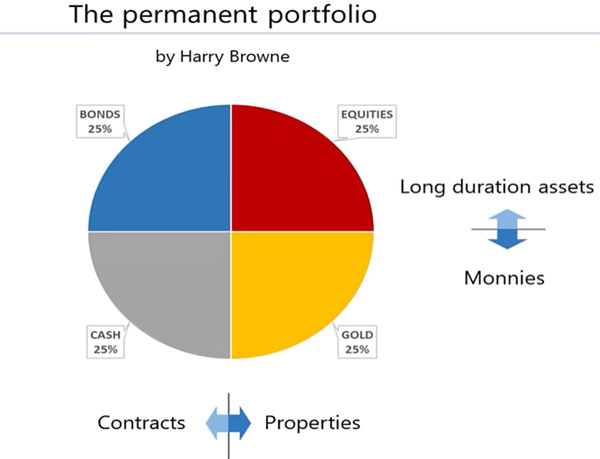
The business cycle can be assessed using indicators like the equity-to-oil price ratio and the gold-to-domestic bonds ratio relative to their seven-year moving averages. Investors should recognize the triggers causing these ratios to cross their averages. The passive, equal-weighted Browne Portfolio typically delivers a 3%-4% real return during peacetime.
The permanent portfolio reflects real wealth creation and remains stable in peacetime. However, during wartime, it falters as centralized assets like government bonds and cash lose value due to defaults and inflation. For instance, French debt securities lost 97% of their real value between 1914 and 1950. Yet, the portfolio never falls to zero, as the 25% allocation to gold preserves a significant portion of its value.

Unfortunately, as recent events in Eastern Europe and the Middle East demonstrate, just as investors cannot change the course of the business cycle but can prepare for it, they also cannot alter the fate of the war cycle. Historically, war intensifies when an empire feels threatened internally, often initiated to maintain its plutocratic cronies in power. War is frequently orchestrated by the elite to avoid addressing the structural issues plaguing a declining republic.

As we close the fourth year of the decade, the world faces an intensifying war cycle. Historically, wars have triggered shifts in the business cycle, moving from inflationary booms to inflationary busts. However, one sector that thrives during wars is Aerospace & Defence.
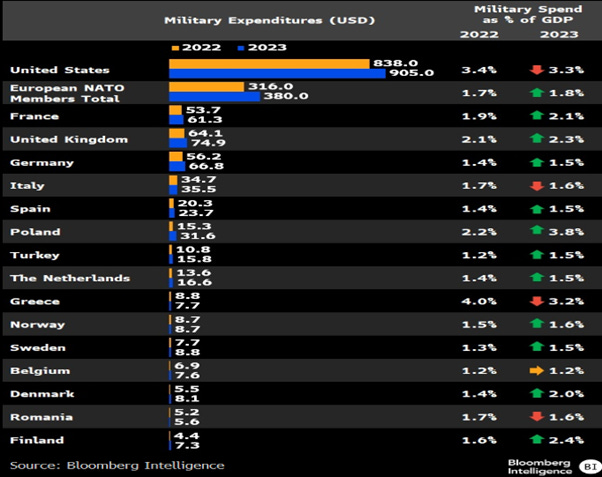
According to the Stockholm International Peace Research Institute (SIPRI), global military expenditure reached $2,443 billion in 2023, a 6.8% increase from 2022. This represents about 2.5% of the 2023 global GDP, still well below the 6%+ of global GDP spent on military expenditures during the Cold War of the 1960s and 1970s.

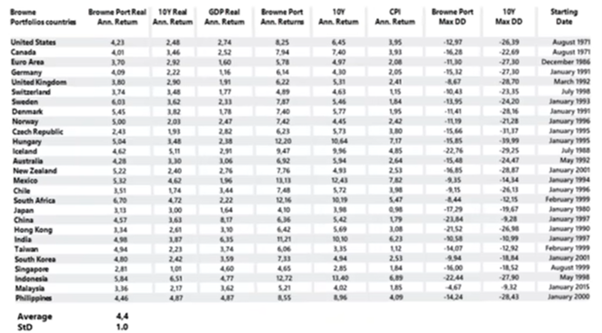
Probably because since World War 2 it has to impose the ‘Pax Americana’ across the world, the United States has long been and remains the largest defence spender, accounting for nearly 40% of global military expenditure. According to SIPRI, China’s defence spending has been growing rapidly, with an annual growth rate of 5.5% from 2014 to 2023. While many countries have increased their defence budgets in recent years due to global tensions, terrorism, and cybersecurity threats, most NATO members still spend less than the 2% of GDP required by the North Atlantic Treaty signed in Washington on April 4, 1949.
Countries with the highest military spending worldwide in 2023 (in billion USD).
Great power competition is driving US defence spending. While past spending focused on wars of terror, it has now shifted to a ‘warmer’ cold war, defined by nations competing for regional and global dominance. For example, the Ukrainian conflict, China's continued expansion, the potential invasion of Taiwan by decade's end, and the Israel–Hamas conflict are recent developments motivating US policymakers to prepare for conflicts on these fronts, contributing to higher defence spending since 2015.
Defence spending in recent decades (% of GDP)

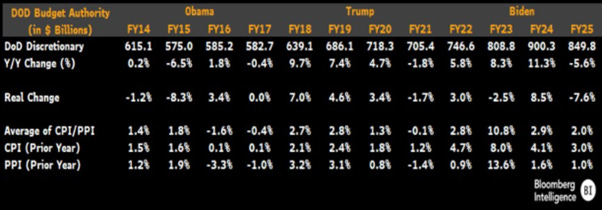
US defence discretionary spending is projected to keep rising even under the 47th US president who is looking via the Department of Government Efficiency (DOGE) to cut $2.0 trillion of federal spending once they take office in January 20th, 2025. The 2025 budget, set under the 45th US president, prioritizes readiness, near-term combat capability, and personnel over modernization, delaying investments in fifth- and sixth-generation fighters, trimming F-35 procurement, and reducing funding for the Air Force's NGAD and the Navy's F/A-XX. Future budgets will need to increase focus on modernization if the US wants to keep spreading ‘Pax Americana’ across the world.

Despite the Pentagon's discretionary budget nearing $1 trillion, defence spending as a percentage of US GDP continues to decline, dropping to 3% in the fiscal 2025 request from 11.4% in 1953. Rising costs for Social Security ($1.55 trillion, 5.3% of GDP), Medicare ($936 billion, 3.2%), and Medicaid ($589 billion, 2%) are squeezing discretionary funding, as tax hikes and debt ceiling increases remain politically difficult. The Office of Management and Budget projects US receipts will average 19.7% of GDP from 2025-34, mostly consumed by mandatory outlays and net interest, leaving little room for defence budget increases without expanding the deficit, unless entitlement reform and national debt management are addressed.

The second Trump administration is likely to renew a US-centric defence strategy, focusing on missile defence, long-range weapons, and strengthening the industrial base, benefiting both existing contractors and new technologies. With increased emphasis on China, calls for European military investment may intensify. Trump's Pentagon budget could outpace inflation over the next four years, with real spending gains supporting modernization, industrial growth, and inventory replenishment. While a wholesale increase is unlikely, a 3% real-term rise seems reasonable. Under Trump's first term, defence discretionary spending grew 13% net of inflation, averaging 3% annually, while Biden's 2022-25 budget saw only 1% real growth due to higher inflation. Under Obama, the budget fell 2% in real terms.
With a Trump White House and Republicans controlling Congress, the upcoming debt-ceiling negotiations may be less contentious, giving Trump more flexibility to increase defence spending. The US debt ceiling will be reinstated on January 2, after being suspended by the 2023 Fiscal Responsibility Act, which capped defence budgets at $842 billion (3% growth) in fiscal 2024 and $850 billion (1%) in 2025. The Congressional Budget Office projects rising deficits could push public debt to 116% of GDP by 2034, up from 99% at the end of 2024. The Trump administration's approach could include lower social spending, but tax cuts and increased military spending may raise deficits.

President-elect Trump has consistently urged NATO members to increase defence spending, advocating for a 3% GDP contribution, up from the previous 2%. While NATO countries have begun raising their defence budgets, Trump is likely to continue pushing for 3%, though he will not advocate for the US to leave NATO due to vital international partnerships, co-development projects, and military collaborations. Despite potential trade tensions, Trump's primary focus will remain on influencing China's role in global markets, rather than engaging with NATO partners.
The election of Trump as the 47th US president, despite his pledge to stop wars in less than 24 hours, will lead to higher defence spending, with a shift towards a more US-centric strategy. Key areas may include strengthening domestic defence capabilities, such as missile-defence systems, interceptors, and hypersonic missiles, with increased focus on the Pacific. This could benefit Navy vessels and Air Force long-range missile systems, as well as boost investment in the US defence manufacturing base for munitions, missiles, and new technologies.

While some are still expecting the Washington swamp to be drained by the DOGE, the Pentagon has failed its seventh consecutive audit, revealing deep financial mismanagement issues. Since audits began in 2018, the Department of Defence has yet to pass, with the latest review citing 28 material weaknesses. Chief Financial Officer Michael McCord admits significant progress is needed to meet the 2028 congressional mandate for a clean audit under the National Defence Authorization Act (NDAA). Critics highlight the Pentagon's inability to account for trillions in untracked funds, an issue dating back to a whistleblower’s claim of $2.3 trillion missing before 9/11. The destruction of WTC7, allegedly housing key audit materials. WTC7, the only building not struck by a plane on 9/11, collapsed in what the government attributed to fire melting steel beams. Notably, it housed the Pentagon audit system. While government employees were evacuated before the attack, civilians in other towers were not as fortunate.
Regardless of who occupies the White House, investors have recognized that the world has shifted from celebrating the ‘peace dividend’, the economic benefits of reduced defence spending, to countries increasing military expenditure. Research shows more NATO members are meeting the 2% of GDP defence spending commitment, with 18 out of 31 countries now meeting this target, up from 7 last year. A 2023 JPMorgan study projects NATO spending could rise by 21% in the near future. European nations like Germany are also pushing toward the 2% threshold. If there is government spending that is agnostic to the state of the business cycle, it is defence spending, which has historically been resilient, often rising during recessions, and is increasingly viewed as a key sector that thrives across the business cycle.
World Defence Spending in USD & US Recessions since 1992.

Since investors cannot control war cycles any more than they can control business cycles, their best option is to understand how war cycles impact the business cycle and adapt their portfolios accordingly. Wars drive capital out of conflict zones into safer environments, creating investment opportunities elsewhere. For example, without World Wars I and II, capital might never have shifted from Europe to America, making New York the global financial capital instead of London. In addition to geopolitical tensions that may intensify inflation pressures, investors should also be wary of the looming great wall of debt. The need to refinance existing debt by issuing new debt in a tightening liquidity environment would ultimately trigger a sovereign debt crisis and capital controls in the economic zone dealing with wars directly like Europe and the Middle East seems to be inevitable.

In a nutshell, the world is on the verge of two sequential crises:
Geopolitical Crisis: This will drive capital out of unstable regions in Europe and the Middle first and Asia later, strengthening the USD and USD assets as investors seek safety.
Sovereign Debt Crisis: Likely beginning in Japan once another proxy war starts on the Korean peninsula and then in Europe as the Ukraine Russia Special Operation spreads outside the current battlefield. This will culminate in a US government default as American citizens realize that the overseas wars have just been a pretext to hold the current plutocracy on life support for much longer while the separation between the blue and the red states are increasingly unable to live together. This means that by the end of the decade the US government will become unable to issue new debt to refinance existing obligations.
Given the combination of wars and the ensuing debt crisis, investors should prepare for capital controls being implemented sooner rather than later, especially in regions already embroiled in proxy wars, such as Europe and the Middle East.

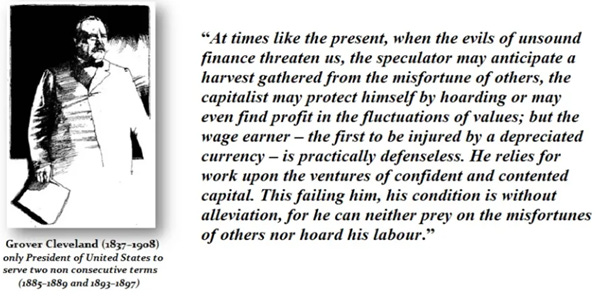
Grover Cleveland was elected as the 22nd and 24th US president, being the only previous president who, like Trump, was elected to non-consecutive terms. Like Donald Trump, he also stood against his own party, expressing this best during the Panic of 1893: capital can flee and move offshore, but it is the middle class that cannot hoard their labour nor move it offshore.
As investors seek to understand how the war cycle impacts the business cycle and recognize that capital flows often precede events, they naturally look for the best investment opportunities. Examining the performance of the S&P 500 and the S&P Aerospace and Defence Sector reveals that exposure to this sector has consistently been a source of alpha for portfolios over the past 25 years.
Performance of $100 invested in S&P 500 index (blue line); S&P Aerospace and Defence Sector (red line) since 31st December 1999; S&P Aerospace and Defence Sector 12-month Rate of Change (yellow histogram); S&P 500 12-months rate of change (green histogram).

In the short term, while largely overlooked by many Wall Street bankers and their media parrots, the S&P Aerospace and Defence sector has outperformed the IT sector since the tragic events of October 7, 2023, which triggered the current war in the Middle East. Notably, it has achieved this with significantly less volatility and drawdown, while substantially outperforming both the S&P 500 and the S&P 500 Energy sector during this period.
Performance of $100 invested in the S&P 500 index (blue line); the S&P Aerospace & Defence Index (red line); the S&P IT sector index (green line) & S&P Energy sector (purple line) since October 7th, 2023.

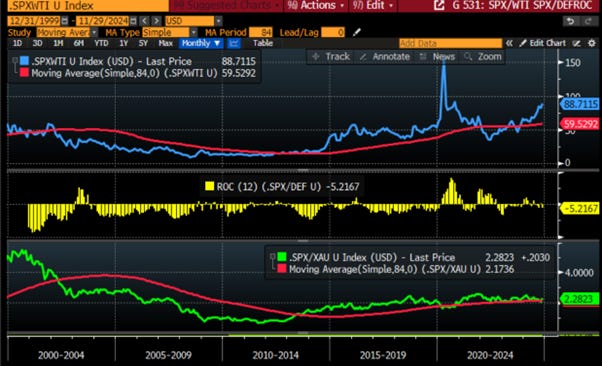
The impact of the war cycle on the business cycle will largely depend on its influence on oil prices and how economic actors adapt to profit from these changes. Over the past 25 years, whenever the 12-month rate of change in the S&P 500 Index relative to the S&P Aerospace and Defence Sector Index turned negative, it preceded the S&P 500 to oil ratio—a measure of the energy efficiency of the US economy, falling below its 7-year moving average within 6 to 9 months. Although less consistent than the S&P to gold ratio crossing below its 7-year moving average, the 12-month outperformance of the Aerospace and Defence sector relative to the S&P 500 can act as an early warning signal, indicating that the US economy shifts from an economic boom to a bust. As of November 29, 2024, the 12-month rate of change in the S&P 500 relative to the Aerospace and Defence sector has turned negative, adding to other market indicators suggesting that the US economy may soon transition from the current inflationary boom to an inflationary bust.
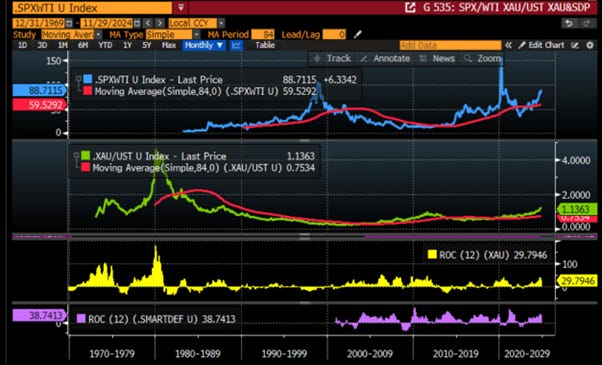
Upper Panel: S&P 500 to oil ratio (blue line); 84 months Moving Average of the S&P 500 to oil ratio (red line); Middle Panel: 12-months rate of change of the S&P to Aerospace Defence Sector (yellow histogram); Lower Panel: S&P 500 to Gold ratio (green line); 84 months Moving Average of the S&P 500 to Gold ratio (red line)
Savvy equity investors are well aware that since the COVID pandemic, a barbell passive equity portfolio equally weighted in the Tech and Energy sectors would have significantly outperformed the S&P 500 with much lower volatility. As wars continue to shape the investment landscape, investors are now encouraged to enhance this strategy by adding the Aerospace & Defence sector, creating a ‘Smart Defence Equity Portfolio.’ Since the tragic event of October 7th, a moment that may ultimately be regarded as the effective start of World War III, as it served as an additional catalyst to the Special Operation in Ukraine and the emergence of a multipolar world, this portfolio has not only outperformed the S&P 500 index and the traditional Barbell Equity Portfolio (50% IT, 50% Energy) but has also delivered superior returns with much lower volatility.
Performance of $100 invested in the S&P 500 index (blue line); the old Barbell Equity Portfolio (50% IT & 50% Energy) (red line); the Smart Defence Portfolio (33.33% IT; 33.33% Energy; 33.33% Aerospace & Defence) (green line) since October 7th, 2023.

Over the past 25 years, the Smart Defence Equity portfolio has been on average historically negatively correlated with the return in the S&P 500 to Oil ratio which means that it is also well equipped to help investors navigating the upcoming transition of the US economy from an inflationary boom into an inflationary bust.

In a nutshell, while the US is still in an inflationary boom, there are increasing risk from the weaponization of the liquidity to the heating up of the war cycle to see the US moving into an inflationary bust in the next 6 to 9 months. Indeed, investors should be increasingly concerned that, despite expected deregulations under the 47th US president and his supposed wishes to stop the wars started under the 46th US president, he could be impotent to deliver on his campaign promises on both the economic and geopolitical fronts as the current inflationary boom could quickly turn into a bust.

If the banking system fails to operate profitably for the benefit of US citizens under tighter, weaponized liquidity, and those pulling the strings behind the scenes stage a false flag to push the US and the rest of the world into inevitable battlefield escalation, it will ultimately lead to GLOBAL STAGFLATION. This stagflation will also be fuelled by a trade war centred on what the 47th US president elect has described as the ‘nicest word ‘in the English dictionary: TARIFFS

Everyone with a modicum of common sense understands that the warmongers in Washington and Brussels have never cared about Ukraine or how many Ukrainians died. They don't even care if Ukraine survives after the conflict. From day one, the goal has been to provoke Russia into a conflict to kill as many Russians as possible, ultimately allowing Wall Street bankers and their plutocrat sponsors to gain control of Ukraine's natural resources, and nothing more.
The same Lindsey Graham doubled down in late November on the claim that Trump will strike ‘a good deal’ with the Ukrainian government to repay the billions spent by U.S. taxpayers. However, those who have orchestrated the so-called ‘good deal’ to exploit the trillions in rare earth minerals and gas reserves in Ukraine are the same bankers who have perpetuated forever wars. These wars socialize the costs onto taxpayers while privatizing the profits for the bankers who spread them across the globe.

https://rumble.com/v5t4e4t-us-senator-lindsey-graham-admits-the-war-in-ukraine-is-about-money.html
In this context, anyone with a modicum of common sense understands that the elites who start wars to enrich their plutocrat allies will never end the forever wars, even if it results in tragedy and the annihilation of an entire population.
https://apnews.com/article/ukraine-war-biden-draft-08e3bad195585b7c3d9662819cc5618f
While global attention remains on Eastern Europe, the Middle East is poised to become the next flashpoint, as concerns grow that Donald Trump’s return to power could embolden Israel to attack Iran. Evangelical leader Mike Evans suggests Trump might support such a strike, potentially targeting Iran’s oil facilities or nuclear sites, to weaken its economy before his inauguration. The timing and outcome of a conflict between Tehran and Jerusalem remain uncertain, but US involvement would trigger a geopolitical storm with far-reaching consequences.

https://www.jns.org/trump-supports-israeli-attack-on-iran-oil-fields-says-us-evangelical-leader/
In conclusion, as the US economy slowly shifts from an inflationary boom to an inflationary bust, driven by weaponized liquidity and escalation in the war cycle, playing ‘smart defence’ becomes key to generating wealth for investors. In this context, gold, not government bonds, is the antifragile asset to hold. Among equities, investors will need to shift from energy-consuming sectors like IT to energy-producing sectors like oil and gas once the S&P 500-to-oil ratio dips below its 7-year average, and also add exposure to the Aerospace & Defence sector. This shift occurs in an environment where investors must increasingly prioritize the Return OF Capital over the Return ON Capital.
At the end of the day, the art of war is knowing your enemy and yourself, and then you need not fear the result of a hundred battles.

WHAT’S ON THE AGENDA NEXT WEEK?
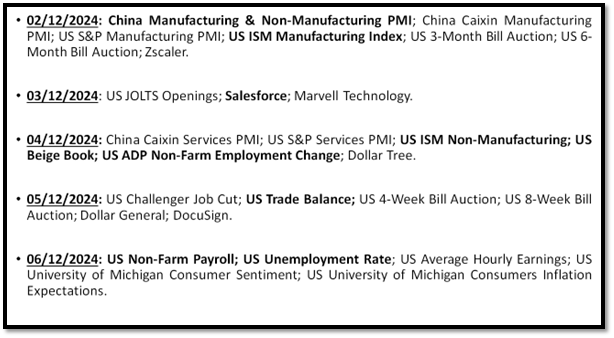
The first week of the final month of the year will shift investors' focus to key macroeconomic indicators, including manufacturing and non-manufacturing data from China and the US. Additionally, investors will receive the latest assessment of the US job market with the release of the November Non-Farm Payroll report, ahead of the year’s final FOMC meeting later in the month. Quarterly earnings reports from Salesforce, Marvell Technology, and retailers like Dollar Tree and Dollar General will also draw attention as the festive season approaches.
KEY TAKEWAYS.
As Americans digest their roasted turkeys, here are the key takeaways:
The October PCE report reveals slowing real spending on durable goods and services alongside rising incomes and inflationary pressures, signalling a cautious path forward as the US economy edges toward an inflationary bust.
The Q3 2024 GDP report revealed that economic growth was driven by goods stockpiling, increased personal consumption, and rising government spending, likely influenced by the ongoing campaign and anticipation of higher trade barriers.
The latest FOMC minutes indicate a shift toward maintaining restrictive rates if inflation persists, but bond vigilantes, not the FED largely dictate long-term yields.
Investors use business cycle phases and liquidity trends to dynamically allocate assets across government bonds, equities, gold, and cash, aiming for a return above the 3%-4% annualized real return of the Browne portfolio during peacetime.
During wartime, the permanent portfolio faces challenges as government bonds and cash lose value. However, its 25% allocation to gold helps preserve much of its value, mitigating the risk of a total loss.
As the war cycle intensifies, global military spending rises, boosting the aerospace and defence sector, with the US, the largest spender, set to increase its defence budget significantly through 2034 despite federal spending cuts.
The second Trump administration is expected to prioritize a US-focused defence strategy, emphasizing missile defence, long-range weapons, industrial growth, and increased spending, while urging NATO members to boost their budgets.
Defence spending is historically resilient, increasing during recessions, and remains unaffected by the business cycle, making it a key sector that performs well in all economic conditions.
Before the end of the decade, investors should brace for two consecutive crises: a geopolitical crisis redirecting capital to safer regions, followed by a sovereign debt crisis, likely beginning in Japan and Europe, leading to a US default and capital controls, especially in war-affected regions.
The outperformance of the S&P Aerospace and Defence sector relative to the S&P 500 indicates a potential shift in the US economy from an inflationary boom to an inflationary bust.
The Smart Defence Equity Portfolio, combining Tech, Energy, and Aerospace & Defence, has outperformed both the S&P 500 and the equity barbell portfolio with lower volatility, positioning it well for the US economy's transition from an inflationary boom to a bust.
With the US still in an inflationary boom, the S&P 500/gold ratio sitting just above its 7-year average, a drop below this level has historically signalled poor outcomes for the economy and equity returns.
In today’s volatile market, investors should favour antifragile assets like gold over bonds, as gold offers low equity correlation, stability, and resilience against currency debasement.
In such environment, investors will once again need to focus on the Return OF Capital rather than the Return ON Capital, as stagflation spreads.
Physical gold remains THE ONLY reliable hedge against reckless and untrustworthy governments and bankers.
Gold remains an insurance to hedge against 'collective stupidity' and government’ hegemony which are in great abundance everywhere in the world.
With continued decline in trust in public institutions, particularly in the Western world, investors are expected to move even more into assets with no counterparty risk which are non-confiscable, like physical Gold and Silver.
Long dated US Treasuries and Bonds are an ‘un-investable return-less' asset class which have also lost their rationale for being part of a diversified portfolio.
Unequivocally, the risky part of the portfolio has moved to fixed income and therefore rather than chasing long-dated government bonds, fixed income investors should focus on USD investment-grade US corporate bonds with a duration not longer than 12 months to manage their cash.
In this context, investors should also be prepared for much higher volatility as well as dull inflation-adjusted returns in the foreseeable future.
HOW TO TRADE IT?
As the penultimate month of the year ended, equity markets rose once again, with the Dow Jones and the S&P 500 indices hitting new intraday all-time highs before the long Thanksgiving weekend. This week once again saw the Dow outperform the S&P 500 and the Nasdaq, underscoring that equity market performance remains driven by inflows into the US as capital continues to leave Europe and the Middle East, where war tensions remain high. While all three indices remain in bullish daily and weekly technical reversal patterns, the Nasdaq has yet to break the all-time high it reached shortly after the US election. This suggests lingering fatigue among US retail investors. In this environment, investors should exercise caution, noting the potential for a yearly top in November and the risk of a pullback to close the November 6th gap before finding support at their respective 50-day moving averages in December.

The recent outperformance of the Dow compared to the Nasdaq, the S&P, and even the Magnificent 7 should alert investors, signalling that the performance is not driven by fundamentals but rather by foreign investors seeking a safe haven for their wealth. This behaviour comes in anticipation of inevitable capital controls in regions to be impacted by the ongoing conflicts in Eastern Europe, the Middle East, and soon, Asia.

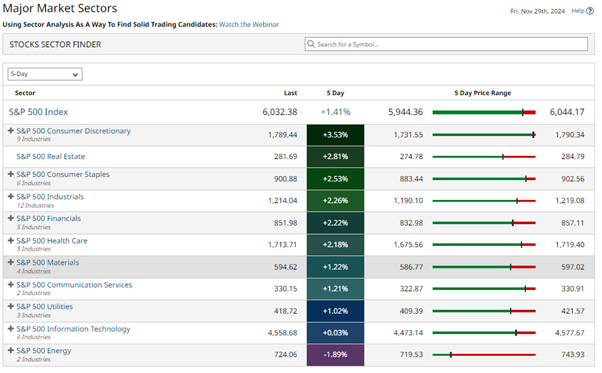
In this context, sector rotation continues, with Consumer Discretionary, Real Estate, and Consumer Staples outperforming, while Utilities, IT, and Energy lag behind.
As governments focus on national security and military modernization, defence stocks stand to benefit from long-term contracts and sustained demand. Investors can gain exposure through ETFs or individual stocks, with the SPDR S&P Aerospace and Defense ETF (XAR US) offering the purest access to this sector. It provides diversified exposure to large, mid, and small-cap American companies in aerospace and defence, with equal-weight investment across the sector.

https://www.ssga.com/us/en/intermediary/etfs/spdr-sp-aerospace-defense-etf-xar
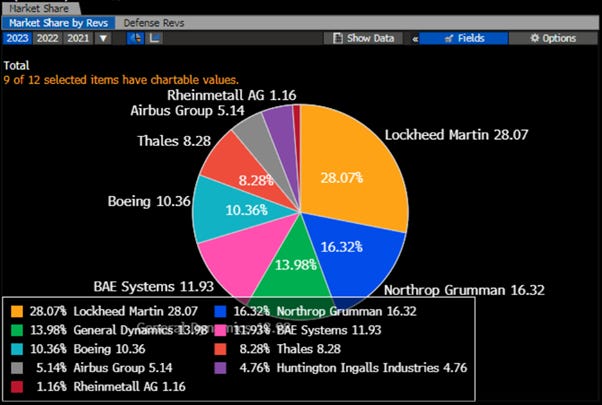
Investors interested in stock picking can focus on companies across the Western world that generate the majority of their revenue from the defense sector. Unsurprisingly, Lockheed Martin, Northrop Grumman, and General Dynamics, which are historically major contractors for the U.S. Army, top this list.
The war in Ukraine and the Middle East has highlighted the growing role of cost-effective, lighter equipment, such as unmanned drones, in modern warfare. For investors seeking exposure to smaller defense companies, Kratos Defense & Security Solutions (KTOS) offers an opportunity. A leader in technology and systems for defense and national security, Kratos develops affordable, cutting-edge solutions, including drones, hypersonic vehicles, and missile systems. Known for its innovation, Kratos focuses on rapid, low-cost production and has a strong track record of partnering with larger system integrators for high-probability contracts.

https://www.kratosdefense.com/technologies
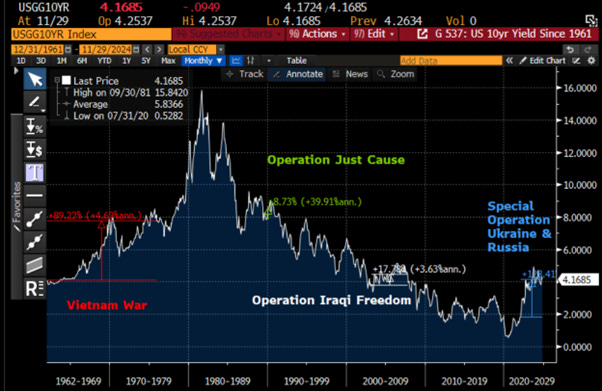
Outside the Smart Defence Equity portfolio, investors know that the ultimate asset to own during wartime is physical gold, as gold is for war. Savvy investors understand that rates rise during war, not decline. While the FED tries to make borrowing cheaper to stimulate growth, history shows that the FED is impotent in wartime, as it only sets short-term rates, not long-term ones, as seen during the Vietnam War (1961-1975). Quantitative easing was a response to this. Therefore, unless there's another round of QE or the implementation of Yield Curve Control, the FED's policy will not be able to stimulate the economy. Holders of long-dated bonds will see their wealth decline, while rates on mortgage and car loans will rise, putting additional strain on consumers and businesses seeking to borrow for growth.
Indeed, over the past century, major conflicts like the Vietnam War and the Second Gulf War saw gold outperform stocks by more than threefold, with lower drawdowns. In the 2020s, gold and equities (S&P 500) have significantly outperformed cash and bonds since the start of the Russian invasion of Ukraine, which, despite NATO's denial, is effectively a US-Russia war.
Performance of $100 invested in Gold (blue line); S&P 500 index (red line); Bloomberg US Treasury Total Return Index (green line); Bloomberg T-bills 1-3 months Index (purple line) since 24th February 2022.

As the US economy remains in an inflationary boom, evidenced by the S&P 500 to Oil and Gold to Bond ratios trading above their respective 7-year moving averages, equity investors can continue enjoying the party on the ‘equity dance floor.’ However, with the 12-month rate of change in shadow liquidity turning negative and the S&P 500 to Gold ratio barely holding above its 7-year moving average, investors should remain close to the exit, which is still wide open as many are captivated by hopes of a better future under the 47th US president. In this context, investors can also play defence by increasing exposure to physical gold on pullbacks as gold returns will only get better once the US economy is effectively in the inflationary bust.
Upper Panel: S&P 500/Oil ratio (blue line); 84 months Moving Average of the S&P 500/Oil ratio (red line); Second Panel: Gold/Bond ratio (yellow line); 84 months Moving Average of the S&P Gold/Bond ratio (red line); Third Panel: Gold price in USD Terms 12-months rate of change; Lower Panel: Smart Defence Portfolio 12-months rate of change.
As the odds of the US and other major economies fluctuating between inflationary booms and busts are high, and in this environment, investors should by now understand that gold, not bonds, will be the antifragile asset to own alongside equities as gold will provide even better risk-adjusted returns for the foreseeable future.
Indeed, with the US economy in the upper right quadrant of the business cycle matrix and the S&P 500 to gold ratio just above its 7-year moving average, holding US equities without a substantial gold hedge, well above the 25% suggested by the Browne Portfolio, has become increasingly risky. Given that equity indexing inherently bets against rising fossil fuel prices, passive equity ETFs are likely a losing equity strategy. In this context, investors should allocate more than 50% of their equity holdings to energy and defence -related stocks and avoid government bonds with maturities over six months while limiting cash to short-dated (maturities not longer than 12 months) Investment Grade corporate paper.
To navigate rising risks of monetary illusion and asset volatility, portfolios should be overweighted into scarce assets like physical gold, silver, and other commodities, which must be stored in a secured location outside the surveillance of the financial system which has been colluding with the reckless governments. Investors must always remember that physical gold and other precious metals have proven their ability to hedge against government risks. Equities of low-leverage companies with economic moats also provide inflation protection, though most gains in the current bull market may be behind us, suggesting caution. In any cases, investors should increasingly get ready to buy the dips in energy producers’ companies but also sell the rips in energy consumers companies. It should be clear to anyone with a modicum of common sense that cash and government bonds should be kept to a minimum (less than the 25% allocation recommended by the Browne Portfolio for these asset classes) and replaced by gold and short-dated US investment-grade paper with an average maturity of less than 12 months.
While we can always hope for the best and prepare for the worst, we must understand that the coming years will be particularly stressful for investors and their families. In this context, investors should focus on factual scientific data rather than propagandistic statements, which ultimately serve no purpose other than enriching those close to those in power, regardless of who they claim to represent.
Just as the business cycle cannot be altered, not even by someone who has survived an assassination attempt, neither can history be changed, nor the future controlled. However, we can each do our best to make an impact and prepare for what lies ahead. No cycle, whether political or economic, can be changed, but by studying the past to anticipate the future, we can protect ourselves and our loved ones by staying prepared and calm.

If this report has inspired you to invest in gold and silver, consider Hard Assets Alliance to buy your physical gold:
https://hardassetsalliance.com/?aff=TMB
At The Macro Butler, our mission is to leverage our macro views to provide actionable and investable recommendations to all types of investors. In this regard, we offer two types of portfolios to our paid clients.
The Macro Butler Long/Short Portfolio is a dynamic and trading portfolio designed to invest in individual securities, aligning with our strategic and tactical investment recommendations.
The Macro Butler Strategic Portfolio consists of 20 ETFs (long only) and serves as the foundation for a multi-asset portfolio that reflects our long-term macro views.
Investors interested in obtaining more information about the Macro Butler Long/Short and Strategic portfolios can contact us at info@themacrobutler.com.
Unlock Your Financial Success with the Macro Butler!

If this report has inspired you to invest in gold and silver, consider Hard Assets Alliance to buy your physical gold:
https://hardassetsalliance.com/?aff=TMB
Disclaimer
The content provided in this newsletter is for general information purposes only. No information, materials, services, and other content provided in this post constitute solicitation, recommendation, endorsement or any financial, investment, or other advice.
Seek independent professional consultation in the form of legal, financial, and fiscal advice before making any investment decisions.
Always perform your own due diligence.