


Skyfall Ahead?


THE WEEK THAT IT WAS...
The last full week of trading for the year brought investors' attention to China, US retail sales, industrial production, and the Core PCE index in the US, which was released two days after the final Federal Open Market Committee (FOMC) and Bank of Japan meetings of the year.
China’s November data shows sluggish economic activity, despite two months of increased stimulus. While the housing market showed some signs of recovery, overall production remained weak, and consumption declined further. Industrial production growth rose slightly to 5.4% YoY from 5.3% in October, in line with expectations. Retail sales growth slumped to 3.0% YoY, below consensus of 4.6%. On a monthly basis, production rose 0.46%, while retail sales growth slowed to just 0.16%.

Japan's November headline CPI rose to +2.9% from +2.3% in October, with core-core CPI (excluding fresh food and energy) at +2.4%. This aligns with expectations and reflects rising inflation, driven partly by higher utility costs after energy subsidies were reduced.

In this context, as expected, the Bank of Japan held its policy rate at 0.25%, with an 8-1 vote as Board Member Naoki Tamura dissented, advocating for a 25-bp hike due to rising inflation risks. With inflation proving stickier, the BoJ is anticipated to raise rates in January, followed by two hikes in 2025, bringing the target rate to 1.0%. The BoJ also released a 200-page policy review, emphasizing the need to avoid the zero lower bound, a step aligned with its aim to secure rate-cutting flexibility for future economic shocks.

The S&P Global Flash December Index highlights a growing economic divergence, with robust growth in services contrasting sharply with a further decline in manufacturing. The US Manufacturing PMI plunged to 48.3 (down from 49.7 and below all expectations), while US Services PMI soared to 58.5 (up from 56.1 and far exceeding expectations). The Services index reached a 38-month high, while Manufacturing Output fell to a 55-month low. December saw raw material prices spike sharply due to supplier-led price increases and higher shipping costs, reflecting busier supply chains ahead of anticipated protectionist policies in the new year. In summary, the manufacturing sector is showing clear signs of an inflationary bust, while services remain in an inflationary boom, hardly a scenario warranting further interest rate cuts.

The US November retail sales rose by a forecast-beating 0.7%, driven by car purchases and online discounts. While consumers cut back on dining out, a key indicator of discretionary service spending, overall spending is on track to grow an impressive 3.0% this quarter. However, this growth appears to be fuelled more by the ‘stock market wealth effect’ and 'buy-in-advance' behaviour than by fundamentals like job creation.

While headline retail sales rose +0.7% MoM, surpassing expectations, core retail sales (excluding autos and gasoline) fell short, increasing by just +0.2% MoM. Although the headline figure suggests a healthy economic environment, investors should remember that retail sales are reported in nominal terms (not adjusted for inflation).
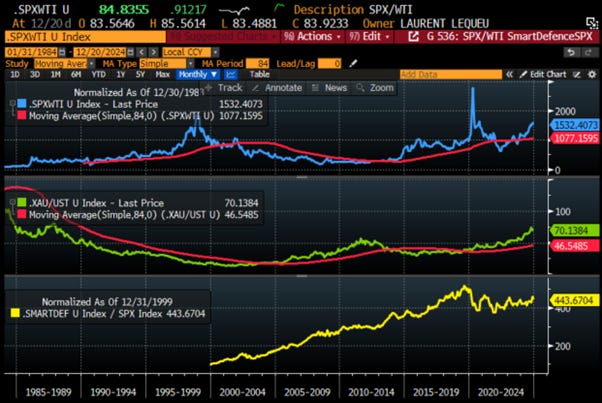
When adjusted for inflation, US retail sales peaked in April 2021, providing further evidence of the undeniable trend that the US economy is heading toward a bust sooner than most Wall Street analysts anticipate.
US Retail Sales Adjusted to inflation (i.e. CPI) (blue line); S&P 500 to WTI ratio (green line); 84-months Moving Average of the S&P 500 to WTI ratio (red line).

After a hotter-than-expected PPI, the FED's favourite inflation indicator, Core PCE, printed cooler than expected for November (+0.1% MoM vs. +0.2% MoM expected), holding steady at +2.8% YoY (below the expected 2.9%) and tied for the highest since April. However, Headline PCE rose to +2.4% from +2.3%, marking its highest level since July. Durable and non-durable goods deflation has nearly disappeared, while core services remained steady at 2.7%, the highest since last May.

Finally, both the cyclical and acyclical components of inflation are on the rise once again (the latter being out of the control of The FED implicitly).
US San Francisco FED Cyclical Core PCE Inflation (blue line); US San Francisco Acyclical Core PCE Inflation (red line).

The final FOMC meeting of the year delivered an irrelevant rate cut and a predictably hawkish tone as the FED begins factoring in tariffs' impact on the U.S. business cycle. Historically, when the S&P 500-to-gold ratio fell below its 7-year moving average; followed by the S&P 500-to-WTI ratio; rate hikes soon followed to combat monetary illusion, triggering economic busts. If Powell and the FED truly aim to preserve the USD's status as a reliable reserve currency and curb inflation, a policy reversal with rate hikes in 2025 appears inevitable.
Upper Panel: S&P 500 to Gold ratio (yellow line); 84-months Moving average of S&P 500 to Gold ratio (red line); FED Fund Rate (axis inverted; green line); Lower Panel: S&P 500 to WTI ratio (blue line); 84-months moving average of S&P 500 to WTI ratio (orange line); FED Fund Rate (axis inverted; green line).

Bottom line: With core PCE above 2.8% YoY and the unemployment rate at just 4.2%, the Taylor Rule, which the FED has used for decades to guide monetary policy and keeps its credibility, suggests the FED Funds rate should currently be 6.03%, not 4.5%.

As tariffs and stricter immigration policies inevitably lead to higher PCE and a tighter job market, those, including FOMC members, who still anticipate two additional rate cuts in 2025 are likely to face major disappointment. By denying the reality of the data, the FED's credibility and relevance will continue to erode, fostering growing distrust in public institutions.

Among the four asset classes that compose the Permanent Brown Portfolio, bonds are probably the least understood by most retail investors, as they have historically been the domain of institutional investors.
A bond is a type of investment security in which an investor lends money to a borrower (typically a corporation or government entity) for a fixed period, known as the bond’s term or maturity. In return, the borrower agrees to pay the investor a fixed rate of interest, called the coupon rate, and to repay the principal amount (face value) upon the bond’s maturity. In a nutshell, bonds are contracts with much longer maturities than cash.

Bonds are fixed-income instruments where investors lend money to governments or corporations to fund various initiatives. As one of the main asset classes, bonds specify loan terms, interest payments (coupon rate), and a maturity date for principal repayment. Issued at par value (typically $1,000), their market price fluctuates with credit quality, time to maturity, and interest rate trends. Bondholders earn returns through interest payments and the principal repayment at maturity.

When aligning the four seasons of the business cycle with the four asset classes of the Permanent Browne Portfolio, investors should note that bonds are the preferred asset class during a deflationary boom due to their long-term maturity and the contractual nature of their value. Conversely, bonds underperform the other three asset classes in the Browne Portfolio during inflationary periods, particularly during an inflationary bust, as their long duration and fixed-income characteristics negatively affect performance in such an environment.

This preference for bonds over cash during a deflationary boom is evident from the CPI-adjusted performance of the four asset classes during the most recent deflationary boom in the US economy, spanning September 2013 to May 2019. During this period, still fresh in the minds of older investors, bonds were the second-best asset class on an inflation-adjusted basis, trailing only equities but significantly outperforming cash and gold.
CPI adjusted return in USD of Gold (blue line); S&P 500 index (red line); Bloomberg US Ag Total Return Index (green line); Bloomberg US Treasury Bills 1-3 months Index (purple) between 30th September 2013 and 31st May 2019.

Over the past four years, the 2020s have brought significant lifestyle changes and the weaponization of USD assets, fuelling financial conflicts, higher government spending, and structurally higher inflation. On a CPI-adjusted basis, US investors have seen gold and equities (e.g., the S&P 500) deliver strong, positive real returns, while cash and bonds have lost value on a CPI adjusted basis as the business cycle shifted between inflationary booms and busts.
CPI adjusted return in USD of Gold (blue line); S&P 500 index (red line); Bloomberg US Ag Total Return Index (green line); Bloomberg US Treasury Bills 1-3 months Index (purple) since 31st December 2019.

Over a longer time horizon, it becomes clear to anyone analysing a chart that bonds outperform gold during periods of economic deflation, whether in a deflationary boom or a deflationary bust.
Upper Panel: S&P 500/Oil ratio (blue line); 84 months Moving Average of the S&P 500/Oil ratio (red line); Second Panel: Gold/Bond ratio (green line); 84 months Moving Average of the S&P Gold/Bond ratio (red line); Lower panel: 12-months Rate of Return of Gold to Bond Ratio.

Bond investors understand that the movement and shape of the yield curve can be interpreted by some economists as a leading indicator of the business cycle's evolution. A yield curve is a line that plots the yields or interest rates of bonds with equal credit quality but different maturity dates. The slope of the yield curve helps predict the direction of interest rates and the potential economic expansion or contraction. Yield curves generally take one of three shapes: normal (upward-sloping), inverted (downward-sloping), or flat.

The yield curve is seen as a vital indicator of economic activity, inflation, and interest rate trends, reflecting market expectations. A steep upward slope signals economic growth and higher future rates, while an inverted curve, with short-term rates exceeding long-term ones, often predicts a recession and potential rate cuts. Rising yields suggest inflationary pressures, while a flattening curve points to subdued inflation. The curve also helps gauge Federal Reserve policy, with steepening often prompting rate hikes and inversion leading to cuts.
While the FED claims victory over inflation since its summer retreat in Wyoming, its control is limited to short-term rates via the FED Funds rate. Longer-term yields, driven by the bond vigilantes, influence business, mortgage, and auto loan rates. In a stark contract with the narrative that the fight against inflation is a ‘mission accomplished’, since the FED’s pivot on September 18th, the 10- and 30-year yields have risen over basis points, with an additional -basis-point increase following the November FOMC meeting.

A key metric tracked by Wall Street is the spread between the 10-year and 2-year yields. Since last September, this curve has dis-inverted. Investors with some perspicacity will note that the spread historically widens during periods of rising debt-to-GDP ratios, as bond vigilantes demand higher yields at the long end of the curve to account for increased default risk. It is indeed well known that most governments spend like ‘drunken sailors’, without accountability to their citizens or lenders, face this dynamic, as their debt is essentially ‘unsecured’ except through tax increases. The goal of most governments has never been to repay their debts but to roll them over by refinancing at longer maturities, as the common approach is to ‘kick the debt can down the road’ while focusing on re-election.
US Public Debt to GDP ratio (blue line); US 10-Year Yield – US 2-Year Yield (histogram).

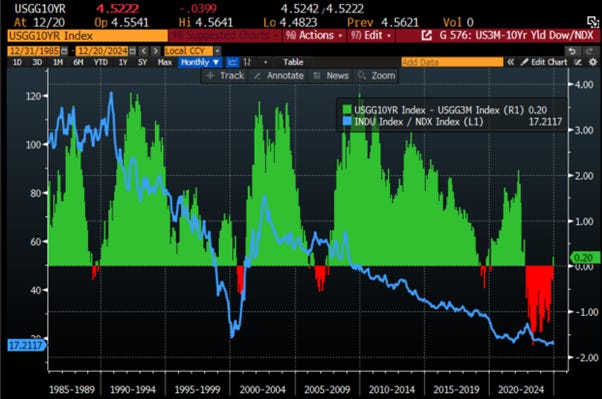
While most investors are focusing on the spread between the 10-year and 2-year yields, the spread between the 10-year yield and the 3-month yield is much more important for financial markets, as it drives the attractiveness of carry trades to buy longer-term debt. Due to recent FED decisions to cut the Fed Funds Rate while the U.S. economy remains in an inflationary boom, the spread between the 10-year yield and the 3-month yield has just dis-inverted, after being inverted since November 2022.
US Public Debt to GDP ratio (blue line); US 10-Year Yield – US 3-Month Yield (histogram).

Bonds are typically bought and funded at short-term rates, usually closer to three months than two years. With 10-year yields now higher than three-month rates, carry traders are more incentivized to buy longer-term Treasuries. This applies not only to domestic traders but also to foreign ones, who hedge FX risk based on short-term U.S. rates. That’s why the US 10-year yield versus the three-month cost for a Japanese investor to hedge the yen closely tracks the US 10-year yield versus the three-month rate. The yet to dis-invert curve is the 10-year yield versus SOFR.

This matters because primary dealer balance sheets have become increasingly congested with securities inventory, including not just Treasuries, but MBS, stocks, and other assets. As a percentage of total assets, their holdings are near levels last seen during the pandemic, when a wave of Treasury selling overwhelmed dealers, and just before the repo market flare-up in 2019.

When dealer balance sheets are constrained, leverage costs rise, as seen in more negative swap spreads and higher equity financing costs. The risk is that dealers may have to reduce or withdraw leverage, causing abrupt market unwinding. While this hasn't happened yet, it remains a risk as stocks continue to rise. The dis-inversion of the 3m10y curve is gradual, but it should increase demand for Treasuries, helping dealers reduce inventory and ease market risk, leading to lower swap spreads and financing costs.

That likely explains why, aside from its partisan agenda, the FED began cutting rates in September. By lowering the FED Funds rate, the FED provides a way to ease pressure on primary dealers' balance sheets without being forced to restart QE officially, thus helping contain the impact of the bond vigilantes at the long end of the curve while the US remains in an inflationary boom.
FED Fund Rate (blue line); US 3-Month Yield (red line) & Correlations.

While the dis-inversion of the 3m10y curve may help the US government deal with the return of the bond vigilantes, the reality is that in 2025, the U.S. government will need to refinance $8.0 trillion of its debt. With a new Treasury secretary, it is anyone’s guess how he will redistribute the maturity breakdown of US debt in an environment still under the watchful eye of the bond vigilantes. Historically, a higher allotment to 10-year debt has been correlated with higher 10-year yields.
US Treasury Auction Allotment 10-Year Notes (blue line); US 10-Year Yield (red line).

For the business cycle, a positive 3m10y curve has historically been associated with periods of economic booms, with the recent dis-inversion of this yield curve potentially being an anomaly caused by the recent strong issuance of short-dated bonds by the US government.
Upper Panel: Spread between US 10-Year Yield and US 3-months Yield (histogram): Middle Panel: S&P 500/Oil ratio (blue line); 84 months Moving Average of the S&P 500/Oil ratio (red line); Lower Panel: Gold/Bond ratio (green line); 84 months Moving Average of the S&P Gold/Bond ratio (red line).

For equity investors, the dis-inversion of the 3m10y curve has historically signalled the trigger for the Dow Jones to outperform the Nasdaq over the past 35 years. In this context, while YOLO investors may lack the financial knowledge to understand the significance of the recent dis-inversion of the 3m10y curve, investors will take note and adjust their portfolios accordingly.
Relative performance of Dow Jones to Nasdaq rebased at 100 as of 31st December 1985 (blue line); Spread between US 10-Year Yield and US 3-Monhts Yield (histogram).
One sector particularly impacted by changes in the shape of the yield curve is undoubtedly the financial sector. As the 3m10y curve dis-inverts, savvy investors will note that such dis-inversions in the past have been synonymous with underperformance of the S&P financial sector relative to the S&P 500 index. With tariffs set to be implemented, which will inevitably impact the economy and increase the risk for now ‘too big to rescue’ banks, the recent dis-inversion of the yield curve is an additional reason to the long lists of economic indicators to stay away from the financial sector in general and the banks in particular.
Relative performance of S&P 500 index to S&P 500 Financial index rebased at 100 as of 31st January 1990 (blue line); Spread between US 10-Year Yield and US 3-Monhts Yield (histogram).

Savvy investors know that in a world with geopolitical risks, including not only trade wars but also kinetic wars, the best-balanced equity portfolio to own since the start of this decade has been one with equal-weight allocations between the IT, Energy, and Aerospace & Defence sectors, which can be called the Smart Defence Equity Portfolio. Looking at the impact of the dis-inversion of the 3m10y curve on the relative performance of the Smart Defence Equity Portfolio versus the S&P 500, there has been little to no correlation between the shape of the yield curve and the relative performance of this portfolio against the S&P 500 index.
Relative performance of Smart Defence Equity Portfolio to S&P 500 index rebased at 100 as of 31st December 1999 (blue line); Spread between US 10-Year Yield and US 3-Monhts Yield (histogram).

While the shape of the yield curve may be important for how the FED and the Treasury try to mitigate the inevitable impact of the bond vigilantes on government financing costs, and ultimately, on businesses and consumers seeking loans, savvy investors know that two market ratios determine the stage of the business cycle: the S&P 500 to Oil ratio and its position against its 7-year moving average, and the Gold to US Treasury ratio and its position against its 7-year moving average. Equity investors will note that when the US economy is in an inflationary boom, as it has been since October 2023, the Nasdaq outperforms the Dow Jones. However, as savvy investors know, the risk of the US transitioning from an inflationary boom to an inflationary bust is rising with the implementation of new trade policies under the 47th US president. In such an environment, as seen between January 2022 and October 2023, the Dow outperforms the Nasdaq.
Upper Panel: S&P 500/Oil ratio (blue line); 84 months Moving Average of the S&P 500/Oil ratio (red line); Second Panel: Gold/Bond ratio (green line); 84 months Moving Average of the S&P Gold/Bond ratio (red line); Third Panel: Dow Jones 12-months Rate of Change (yellow histogram); Fourth Panel: Nasdaq 100 12-months Rate of Change (purple histogram); Lower Panel: Relative performance of Dow Jones to Nasdaq index (orange line).

In a nutshell, if the rising scenario of a 'Trump Stagflation' or the US economy transitioning from an inflationary boom to an inflationary bust occurs within the next 12 months, the recent dis-inversion should be short-lived unless the FED keeps ignoring the reflation that lies ahead. In any case, as the US economy remains in an inflationary environment, bonds are still expected to be the worst asset class among the four asset classes of the Permanent Browne Portfolio.
Upper Panel: S&P 500/Oil ratio (blue line); 84 months Moving Average of the S&P 500/Oil ratio (red line); Second Panel: Gold/Bond ratio (yellow line); 84 months Moving Average of the S&P Gold/Bond ratio (red line); Third Panel: Gold price adjusted to US CPI 12-months rate of change (yellow histogram); Fourth Panel: S&P 500 adjusted to US CPI 12-months rate of change (purple histogram); Fifth Panel: Bloomberg US Agg Bond index adjusted to CPI 12-monhts rate of change (orange histogram); Lower Panel: Bloomberg US T bills 1-3 Months adjusted to US CPI 12-months rate of change (grey histogram).

This brings us to the conclusion that investors should continue to avoid bonds within the four asset classes of the Browne Portfolio, as the US economy is still in an inflationary boom. The implementation of widespread tariffs and tighter immigration policies will likely push the US economy into an inflationary bust rather than a deflationary boom or bust in the foreseeable future. Investors holding more than 25% of their portfolio in bonds now expect the US economy to return to a deflationary mode within the next 12 months, a scenario that is unlikely unless the Department of Government Efficiency achieves its $2.0 trillion cut in government spending and Donald Trump miraculously ends the forever bankers’ wars in Eastern Europe and the Middle East. Anyone with a modicum of common sense would assign a 0% to 10% probability to this deflationary scenario in the near future. In this context, investors can still buy the dip in the equity market and focus on companies within the Smart Defence Equity Portfolio that have strong balance sheets and positive free cash flow generation. The Smart Defence Portfolio remains the best way for investors to reduce volatility in their equity allocations and navigate what is expected to be a much more volatile year ahead for financial markets. However, investors should remember that during an inflationary bust, they will need to reduce their equity allocation and increase their allocation to gold and other real assets.
Upper Panel: S&P 500/Oil ratio (blue line); 84 months Moving Average of the S&P 500/Oil ratio (red line); Middle Panel: Gold/Bond ratio (green line); 84 months Moving Average of the S&P Gold/Bond ratio (red line); Lower Panel: Relative Performance of Smart Defence to S&P 500 Index (yellow line).
Investors should also never forget that, in the worst-case scenario of an inflationary bust, gold, not government bonds, remains the antifragile asset to hold. Among equities, investors will need to shift from energy-consuming sectors like IT to energy-producing sectors like oil and gas. This shift will occur in an environment where investors must increasingly prioritize the Return OF Capital over the Return ON Capital.
WHAT’S ON THE AGENDA NEXT WEEK?
The week of the Christmas holiday will feature very limited macroeconomic data releases, with the only significant events being the Tokyo CPI and U.S. durable goods orders.

KEY TAKEWAYS.
As everyone are getting ready to meet with Santa Claus, here are the key takeaways:
China's November data shows sluggish economic activity, with weak industrial production and declining retail sales, indicating that increased stimulus efforts are not the solution to Making China Great Again anytime soon.
The Bank of Japan maintained its rate at 0.25%, but rising inflation and a dissenting vote signal likely hikes starting in January, aligning with its goal to secure rate-cutting flexibility for future shocks.
The December S&P Global Flash Index reveals a stark economic split, with services booming at a 38-month high while manufacturing plunges to a 55-month low, signalling inflationary divergence that challenges the case for further rate cuts.
US November retail sales were driven by autos, online discounts, and buy-in-advance behaviour ahead of tariffs, pointing to inevitable stagflation.
Core PCE cooled slightly in November, holding at +2.8% YoY, while Headline PCE rose to +2.4%; with goods deflation fading and tariffs looming, a return to 2% seems phantasmagorical.
The FED's hawkish tone signals that reversing course with rate hikes in 2025 may be inevitable to curb entrenched inflation and preserve the USD's credibility.
Among the four asset classes in the Browne Portfolio, bonds are favoured during deflationary booms for their long-term maturity and contractual value but underperform during inflationary periods, particularly inflationary busts, due to their fixed-income nature.
The dis-inversion of the 10-year and 3-month yield curve, driven by recent FED rate cuts amid an inflationary boom, encourages carry trades in longer-term Treasuries, alleviating dealer balance sheet pressures and countering the influence of bond vigilantes.
A positive 3m10y curve typically signals economic booms, with the recent dis-inversion likely influenced by the US government's substantial issuance of short-dated bonds.
The 3m10y curve dis-inversion typically boosts Dow over Nasdaq, pressures financials, and minimally affects the geopolitically resilient Smart Defense Portfolio.
Savvy investors avoid bonds in inflationary times, and favour the Smart Defence Equity Portfolio for its strong balance sheets and cash flow amid rising volatility.
With the US still in an inflationary boom, the S&P 500/gold ratio sitting just above its 7-year average, a drop below this level has historically signalled poor outcomes for the economy and equity returns.
As the year to come is expected to be much more volatile, investors should favour antifragile assets like gold over bonds, as gold offers low equity correlation, stability, and resilience against currency debasement.
In such environment, investors will once again need to focus on the Return OF Capital rather than the Return ON Capital, as stagflation spreads.
Physical gold remains THE ONLY reliable hedge against reckless and untrustworthy governments and bankers.
Gold remains an insurance to hedge against 'collective stupidity' and government’ hegemony which are in great abundance everywhere in the world.
With continued decline in trust in public institutions, particularly in the Western world, investors are expected to move even more into assets with no counterparty risk which are non-confiscable, like physical Gold and Silver.
Long dated US Treasuries and Bonds are an ‘un-investable return-less' asset class which have also lost their rationale for being part of a diversified portfolio.
Unequivocally, the risky part of the portfolio has moved to fixed income and therefore rather than chasing long-dated government bonds, fixed income investors should focus on USD investment-grade US corporate bonds with a duration not longer than 12 months to manage their cash.
In this context, investors should also be prepared for much higher volatility as well as dull inflation-adjusted returns in the foreseeable future.
HOW TO TRADE IT?
With just 6 trading days remaining in the year, the final full week of trading was marked by a broad-based equity market pullback, driven by an unsurprisingly hawkish FED chairman. The Nasdaq and Dow underperformed the S&P 500, with the Dow recording its third consecutive negative week and the S&P 500 its second. While the ‘Magnificent 7’ fared better than other indices, the week signalled a key trend shift as the Dow triggered a bearish daily reversal on Wednesday and remained in that pattern through the week's end. Although the S&P 500 and Nasdaq maintained bullish trading patterns on daily and weekly charts, both tested their 50-day moving averages. Notably, the Dow closed below its post-election rally levels, erasing the so-called ‘Trump rally.’

In this context, it’s no surprise that IT; Utilities and Financials outperformed, while Materials, Real Estate, and Energy lag.

The best quality of any manager, including wealth managers, is to prepare for the worst while hoping for the best. Those who understand the business cycle know that in the US’s current inflationary environment, government bonds, once upon a time considered risk-free, are now no more ‘free of risks’, especially with $8.5 trillion of debt due for refinancing in the next 12 months. As the US economy faces increasing risks to shift from an inflationary boom into an inflationary bust, investors should avoid all type of bonds (government and corporate) with maturities over 12 months. Instead, diversifying into short-dated (less than 12 months maturity), investment-grade bonds from US companies with strong balance sheets and low leverage is the best way to manage the fixed income allocation of a portfolio. This kind of fixed income investment offers minimal credit risk and an expected annualized return of at least 5%.
In the current inflationary environment, Investors should limit exposure to bonds and cash to under 50%, replacing them with real assets like gold and silver. The Smart Portfolio (40% Smart Defence, 40% gold, 20% cash (short-term US Treasury bills) would have turned $100 on 31st December 1999 into $1,444 by December 20th, compared to $401 for the Browne Portfolio. This Smart Portfolio has outperformed the Browne Portfolio in most 12-month periods, except during specific times like 2003, 2008-2009, and 2020-2021.
Upper Panel: US Browne Portfolio (blue line); Smart Multi-Assets Portfolio (red line); Middle Panel: Relative Performance of Smart Multi Assets Portfolio to US Browne Portfolio (green line); Lower Panel: 12-monhts Rate of Return of the relative performance of Smart Multi Assets Portfolio to US Browne Portfolio (yellow histogram).

In a nutshell, in both inflationary environment, bonds no longer provide the risk-free hedge they do in a deflationary environment. This is particularly true with higher tariffs and significant debt refinancing ahead. For now, investors can still buy the dips in equities and gold while selling the rips in bonds as the US economy remains in an inflationary boom. When the economy shifts into an inflationary bust, these investors should sell the rips in equities and bonds and buy the dips only in gold and other physical assets in limited supply. Among equities, as the US economy moves from an inflationary boom to an inflationary bust, investors should allocate over 50% of their equity portfolio to energy stocks, minimize cash in banks and government bonds, and use a diversified portfolio of short-term, investment-grade corporate paper to generate income and navigate the upcoming Skyfall.
Many mistakenly view the stock market as a sign of economic health, but the true danger lies in the debt market. While stock market declines of 30-40% might not cause a depression, a disruption in government debt can lead to severe economic downturns, wiping out the banking system as investors in time of crisis will just have to accept that there is no bid for what has been depicted by Wall Street and its parrots as the ‘risk free asset’.

For now, the US debt market remains the biggest globally. Market crashes, like the one of 1987, occur when sellers outnumber buyers, causing a ‘no bid’ scenario, not due to some mythical market manipulator. Wealth, like that of Buffet or Gates, is based on share value, not cash, and if Bernie Sanders seized all the wealth of the top 1%, it wouldn’t even balance the US government budget for a year, highlighting the real issue: poor government management. Value is simply a price quote, not a guaranteed worth. For example, if a rare coin sells for $100,000 at auction, it doesn’t mean that this coin is worth that price, it only means that a buyer agree on that value with the seller at a particular time. The price of the coin may fluctuate over time, depending on economic conditions. Value rises and falls based on the economy and the demand for cash, always reflecting a contest between public and private assets.

The shift from public to private assets is evident to anyone with common sense, as the U.S. government faces the need to refinance over $8.5 trillion of its debt, S&P 500 companies have less than $1.5 trillion to refinance in 2025. In fact, for Corporate America, the bulk of its debt burden won't arise until 2034 and beyond.

Unsurprisingly, the financial sector (including Real Estate) holds the most debt to refinance in 2025, followed by Industrial and Healthcare. These sectors, facing the brunt of rising yields as the economy transitions from an inflationary boom to an inflationary bust, should be avoided in portfolios seeking to mitigate the effects of structurally higher bond yields on their profitability.

As the coming year will be challenging for investors and their families, it's crucial to focus on factual data rather than propaganda. While we can't alter cycles or control the future, we can learn from the past to prepare for what lies ahead, staying calm and proactive to protect ourselves and our loved ones. As the adage says, ‘Prepare for the worst and hope for the best.’ In this meantime, investors should ‘let the sky fall, and they will stand tall’ through the post-Trump stagflation by using a disciplined investment approach based on market data and a proven asset allocation to navigate the stormy waters of the business cycle.
In this meantime, investors should ‘let the sky fall, and they will stand tall’ through the post-‘Trump stagflation’ by using a disciplined investment approach based on market data and a proven asset allocation to navigate the stormy waters of the business cycle.

If this report has inspired you to invest in gold and silver, consider Hard Assets Alliance to buy your physical gold:
https://hardassetsalliance.com/?aff=TMB
At The Macro Butler, our mission is to leverage our macro views to provide actionable and investable recommendations to all types of investors. In this regard, we offer two types of portfolios to our paid clients.
The Macro Butler Long/Short Portfolio is a dynamic and trading portfolio designed to invest in individual securities, aligning with our strategic and tactical investment recommendations.
The Macro Butler Strategic Portfolio consists of 20 ETFs (long only) and serves as the foundation for a multi-asset portfolio that reflects our long-term macro views.
Investors interested in obtaining more information about the Macro Butler Long/Short and Strategic portfolios can contact us at info@themacrobutler.com.
Unlock Your Financial Success with the Macro Butler!

If this report has inspired you to invest in gold and silver, consider Hard Assets Alliance to buy your physical gold:
https://hardassetsalliance.com/?aff=TMB
Disclaimer
The content provided in this newsletter is for general information purposes only. No information, materials, services, and other content provided in this post constitute solicitation, recommendation, endorsement or any financial, investment, or other advice.
Seek independent professional consultation in the form of legal, financial, and fiscal advice before making any investment decisions.
Always perform your own due diligence.
Hi Laurent,
thanks for another great post. One question Could you explain why “In this context, it’s no surprise that IT; Utilities and Financials outperformed, while Materials, Real Estate, and Energy lag.” in the main takeaway section near the end ?I’m curious specifically with respect to energy which is part of the three security types that you mentioned in previous macro Beutler articles along with tech and defense And also materials?Without materials and energy nothing goes forward.
Thanks
John