


Sugar High Buyback Bounce!


THE WEEK THAT IT WAS...
As investors keep their swimsuits and beach slippers stowed until next summer and central bankers head to the mountains of Wyoming, the focus of the week was on another set of inflation data from Japan. In the US, attention was on the leading indicators provided by the US Flash Manufacturing and Services PMI. Besides comments from Jackson Hole, the minutes of the July FOMC meeting were also a main focus point of the week, alongside the Keynesian political circus unfolding in the sanctuary city of Chicago.
In Japan, July’s CPI was driven by a broad base of factors, consistent with the view that inflationary pressures are broadening as rising wages start to spread through the economy. The headline inflation rate came in at 2.8% YoY, unchanged from June and above expectations of 2.7%. Core inflation rose to 2.7% YoY, in line with expectations and above June’s 2.6%. With inflation remaining above the BOJ’s 2.0% target and showing no signs of cooling, investors should prepare for more interest rate hikes from the Bank of Japan, which could trigger further Yen carry trade disruptions in the coming months.

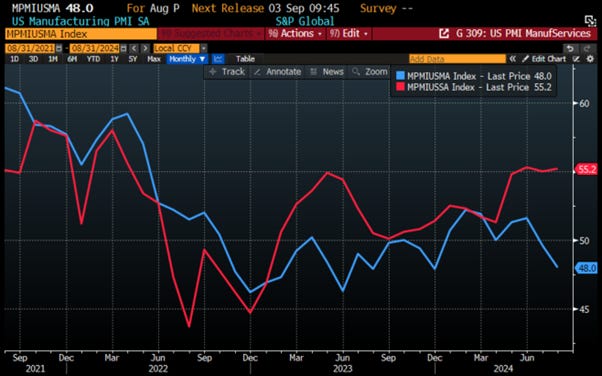
In the US, the flash PMI was a major setback for investors who still believe in the illusion of a soft landing for the US economy, as manufacturing and services activity continue to diverge. The flash US manufacturing PMI plunged to an 8-month low of 48.0, below expectations of 49.5 and July’s level of 49.6. Meanwhile, the flash US Services PMI rose to 55.2, a 2-month high and above July’s level of 55.0. Adding to doubts about the soft-landing scenario, the manufacturing sector’s forward-looking orders-to-inventory ratio has fallen to one of the lowest levels since the global financial crisis.
US Manufacturing PMI Index (blue line); US Services PMI (red line).
In another dystopian scenario among Wall Street economists who are still falling for the lies propagated by the Keynesian Bureau of Labor Statistics, which seeks to perpetuate the illusion that the U.S. economy is healthy under this new form of communism, the 'uncooked numbers' adjusted by the same BLS reveal that the preliminary estimate of the benchmark revision indicates an adjustment to March 2024 total nonfarm employment of -818,000 (-0.5%). This number of course doesn’t consider the ‘off the books’ jobs which have been taken by the illegal immigrants who have flooded into the US over the past year.

Over 1.2 million American citizens lost their livelihoods last year while 1.3 million migrants found work as they were used by the current administration as a tool to perpetuate wrong economic policies which are favouring the Washington plutocrats. The revision is primarily due to losses in the highest-paying sectors: professional services (-358k), leisure (-150k), and manufacturing (-115k). Not surprisingly, government jobs, which produces nothing toward GDP, were revised upward by +1,000. To put the 818,000 number into context, the 2024 revision is the largest in the past decade and the second largest on record, with only the 824k downward revision in 2009 slightly surpassing it.

This revision confirms that the inflationary misery, fuelled by reckless government spending and absurd regulations tied to the climate change scam and DEI euphemisms, has only brought disarray among We The People. The $1.0 trillion in debt printed every 100 days has failed to deliver any prosperity to those outside the Washington plutocracy and its warmongering agenda.
The minutes of the summer FOMC meeting, already outdated by the time they were published, merely confirmed that the unanimity within the committee is as illusory as the job data released under the propaganda of the ruling Keynesian plutocrats. With little surprise from a politically driven committee, a ‘vast majority’ of the governors saw a ‘September cut as likely appropriate given that inflation data were encouraging’.

https://www.federalreserve.gov/monetarypolicy/files/fomcminutes20240731.pdf
Against the backdrop of the Wyoming mountains, Jerome Powell delivered a 17-minute speech. Unlike two years ago, when he took 8 minutes and warned of "pain to come" to fix the inflation problem, which still isn't resolved, this year he stated, ‘The time has come for policy to adjust.’ He added, ‘The direction of travel is clear, and the timing and pace of rate cuts will depend on incoming data, the evolving outlook, and the balance of risks.’ The rest of the speech was a thorough review of what led to the surge in inflation, as he reflected on the causes that prompted an aggressive series of 11 rate hikes from March 2022 through July 2023 and the mistaken believes in a ‘transitory inflation’ path since the start of the Covid pandemic.
The primary issue for investors is that Wall Street is, once again, dreaming of an illusionary path for rate cuts. It now expects just over 4 full rate cuts (104 basis points) before the end of the year, which is well above the single cut indicated by the FED’s dot plot.

While this suggests that the FED might finally pivot on September 18th, there are several challenges ahead, if the FED remains committed to fighting inflation. First, ending the tightening cycle and starting an easing cycle with stocks at all-time highs is unprecedented, and such a move is of course politically motivated ahead of the highly contested election scheduled on November 5th. This confirm what everyone already knew that Powell and the FED outside being political has become partisan. Second, this is the first time the FED might stop tightening without achieving any decrease in home prices. Third, while one can technically live without housing or rent, one still needs to eat. And here there is another problem, because not only did the FED's rate hikes not contain stock, home or rent prices, but food prices. Fourth, the groundwork for the next inflationary bubble is already laid, as M2 money supply is rising again after three years of decline, even under tight conditions. Finally, Powell and his PhD colleagues should know that interest rates ALWAYS RISE DURING A WAR. In this environment, investors with a little of common sense should ask themselves what can possibly go wrong in 2025 and beyond for those who are not part of the Washington plutocracy. For more insights, you might want to ask someone well-versed in these matters.

Seasoned investors are familiar with the concept that the stock market and the economy are increasingly disconnected. Going back to basics, a stock market is where the buying and selling of stocks take place. The economy, on the other hand, is the sum of all the activities involved in making and spending money within a region or country. In headlines, the economy is often measured and tracked through changes in Gross Domestic Product (GDP). Employment levels, the housing market, consumer confidence, and spending are other ways to measure the strength of the economy. For those who have attended financial lectures, it's common knowledge that the stock market is forward-looking. The price you are willing to pay for a stock today is based on how well you and other investors expect the company to perform in the future. In contrast, most economic data looks back at what has already happened. For example, employment numbers show how many people are actively out of work. The forward-looking nature of the stock market means it often leads the economic cycle.

Looking at the long-term correlation between the stock market (i.e., the S&P 500 index) and the economy (i.e. GDP), it is clear that the 4-quarter rolling correlation between the two is irregular. Making investment decisions based solely on GDP growth is not the best strategy for managing investment portfolios.
S&P 500 index (blue line); US GDP (red line) & correlation.

Rather than GDP growth, anyone who have been investing in financial markets know that economic surprises are more relevant even if from time-to-time good news is good news; bad news is bad news or good news is bad news and bad news is good news. This can be seen in the swing of correlation between the S&P 500 index and the Citi US Economic surprise index. Based on history, these 2 series are highly correlated to each other in times of US recessions. In the current schizophrenic environment of the past weeks, where the market is both fearful of a US recession (bad news is bad news) and hopeful for the start of the notorious FED pivot (bad news is good news), we could simply end up in a scenario where bad news is bad news and good news is bad news.
S&P 500 index (blue line); Citi US Economic Surprise Index (red line); Correlation and US Recessions.

Seasoned investors understand that, rather than economic data, what ultimately drives the evolution of the stock market is the result of supply and demand, with asset prices, particularly equity prices, being influenced by the availability of liquidity chasing these assets. Liquidity, especially shadow liquidity injected into financial markets by the Federal Reserve, often behind the scenes, plays a significant role in driving equity market valuations. Since the Global Financial Crisis (GFC) and the onset of Quantitative Easing (QE) policies implemented by central banks to keep zombie financial institutions alive, investors have had to become familiar with the concept of liquidity. In the US, liquidity can be proxied not only by the size of the FED's balance sheet but also by the cash injected into financial markets via the Treasury General Account (TGA) and the New York Fed's Reverse Repo operations (ON RRP). While the FED's balance sheet is relatively straightforward, the TGA is an account maintained by the US Department of the Treasury at the Federal Reserve. It receives tax payments and proceeds from the auction of Treasury securities and disburses government payments to individuals and businesses. Beyond its cash flow duties, the TGA also protects the Treasury from running out of money if Congress delays raising the debt ceiling. It is often described as the government's 'checking account.
US Treasury General Account (TGA).

The Overnight Reverse Repurchase Agreement Facility (ON RRP) is a monetary policy tool used by the Federal Reserve to help control short-term interest rates and manage market liquidity. It involves transactions between the Federal Reserve and eligible financial institutions, such as banks, money market funds, and other institutional investors. The ON RRP helps remove excess liquidity from the banking system by allowing financial institutions to lend their excess reserves to the Federal Reserve. The facility acts as a floor for short-term interest rates, ensuring that financial institutions do not lend in the market at rates lower than what they can earn through the ON RRP. During periods of market stress or volatility, the ON RRP can help stabilize money market rates by providing a risk-free investment option for financial institutions, reducing the potential for disruptions in money market rates.
New York FED Reverse Repo.

Investors understand that the recent tightening of the Federal Reserve's monetary policy has included the tapering of its balance sheet. Observing the Treasury General Account (TGA), it was evident that the government used the TGA in 2023 to inject shadow liquidity into the financial markets, which was a key driver of the performance of financial markets last year. Once the TGA balance was rebuilt as the Congress raised the debt ceiling tantrum to January 2025, the flow of shadow liquidity was primarily influenced by the reduction in the Reverse Repo program.
NY FED Reverse Repo Account (blue line); Treasury General Account (TGA); FED balance sheet (green line).

Aggregating the Federal Reserve's balance sheet, the TGA, and the RRP provides a proxy for the USD liquidity environment, which has historically been well correlated with S&P 500 valuations (forward P/E). Investors will notice that this USD liquidity proxy has been relatively flat over the past 12 months and still well below the peak reached at the end of 2021.
S&P 500 12-month Fwd P/E (blue line); USD liquidity proxy index (red histogram) & correlation.

Beyond the monetary tools used to inject shadow liquidity by the FED, the US Treasury Department has recently used its debt-issuance powers to manipulate financial conditions. As Stephen Miran and Dr. Nouriel Roubini highlighted in their recent article titled 'Hedge Fund Study on US Treasury Issuance Fuels Debate,' the study echoes Republican senators’ claims that the Treasury deliberately increased short-term Treasury bill issuance to give the economy a 'sugar high' ahead of the elections. Nouriel Roubini, a renowned economist, and Stephen Miran, a former advisor to the US Department of the Treasury, argue that this strategy is intended to ease financial conditions. They liken the Activist Treasury Issuance (ATI) to ‘stealth QE’.

Given the significant impact that financial conditions have on financial markets, the answer is much more important for investors than it may initially appear from an academic research paper.
S&P 500 index (blue line); Chicago FED National Financial Conditions Index (axis inverted; red line); Correlations and US Recessions.

The authors claim that recent Treasury debt issuance patterns were intentionally designed to boost economic activity and support financial markets, thereby easing financial conditions. Even more troubling, the article suggests that the Treasury is using this strategy to 'stimulate the economy into election season.' Essentially, they assert that the Treasury has purposely issued less long-term debt in favour of more short-term bills. The authors hypothesize that these actions are equivalent to an approximate one percent cut in the Fed Funds rate.

To summarize, the paper identifies two channels through which ATI and QE operate: the portfolio balance channel and the money supply channel.
Portfolio Balance Channel: This theory posits that financial markets have a fixed amount of total risk investors can hold in aggregate. If the Treasury issues bonds, adding duration risk to the market, investors would need to reduce other risks by selling different assets to buy Treasury bonds. Therefore, the Treasury can make it easier for investors to absorb its debt by reducing or limiting the issuance of longer-term notes and bonds, which carry more duration risk.
Money Supply Channel: This theory suggests that issuing bonds instead of bills requires a greater drawdown of bank reserves. Treasury bills, which require fewer reserves than bonds, allow the banking system to retain more reserves. As a result, banks are less restricted in making loans, which can stimulate the economy and financial markets.

To further support their case, the article argue that ATI is similar to the FED’s 'Operation Twist,' which originated in 1961. Operation Twist involved the FED buying long-term Treasury notes and bonds while selling short-term notes and bills. Although this activity did not change the size of the FED’s balance sheet, it had notable market and economic impacts. By implementing this policy, the Treasury can achieve a similar effect of a rate cut by issuing fewer long-term bonds and more short-term bills. In 2015, the Treasury decided to increase the proportion of bills in its total debt issuance to 15% for various reasons. By 2020, this share was extended to 15-20%. These changes were not motivated by interest rates or the business cycle.

As argued previously, it is evident that, to finance the costly regulations associated with climate change scam and the Diversity, Equity, and Inclusion non-sense, the US Treasury has been colluding with the FED to engage in stealth QE to maintain the wealth illusion created by the Keynesian policies of the current administration. This is contrary to the foundational principle of the US Treasury Department, which is responsible for funding the country efficiently and cost-effectively.

https://home.treasury.gov/system/files/276/Debt-Management-Overview.pdf
In attempting to fund the nation at the lowest cost over time, the Treasury Department continually assesses how current interest rates compare to expected future rates. They rely on supposedly skilled market personnel and a committee of Wall Street experts to assist in this endeavour. Before the Covid pandemic and the Keynesian responses to it, short- and long-term Treasury yields decreased due to slowing economic growth and lower inflation rates. However, with the return of a structurally inflationary environment, expected to last longer in an increasingly regulated economy with potential shortages and price controls, the US treasury should be prepared for structurally higher yields at the long end of the curve.
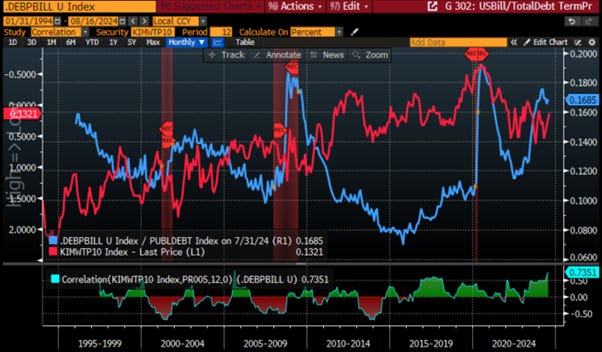
In this environment, anyone who understands economics will expect that short-term and long-term rates will be structurally higher than pre-pandemic levels, especially if the US enter into more proxy wars in the years to come. From 2010 through 2020, the issuance of Treasury bills as a percentage of total debt was well below average. During this period, longer-term note and bond yields were at or near historical lows. After 2020, as reckless government spendings were implemented, the shift towards issuing shorter-term debt, amidst collapsing term premiums under artificially low long-dated yields and persistently high inflation has been a key factor in the Treasury's strategy to manipulate the economy. This shift is understandable from the current Treasury as it aims to avoid distressed long-dated government bond auctions, which could signal to investors that what was once upon a time a risk-free asset is no more free of risks.
US Outstanding T-bills/US total debt ratio (blue line); US Term premium on 10-Year Zero Coupon (axis inverted; red line); Correlation and US Recessions.
US federal deficits have been running well above average, forcing the Treasury to issue more debt than usual. As a result, the Treasury must carefully manage its debt issuance to avoid overwhelming demand for certain maturities while neglecting others. With money market balances soaring, both retail and institutional investors have been clamouring for Treasury bills. Conversely, longer-term bond investors have been hesitant due to inflation concerns and fears of rising yields. As a reminder, the Treasury does not manage demand for its products; it only controls supply. In response to current market conditions, the goal of issuing more T-bills rather than coupons was to target short-term investors by draining liquidity from money market funds and manipulating the long end of the yield curve to ease the pressure on the economy. By implementing this activist strategy, the Treasury hoped to spread the forward illusion of the 'immaculate disinflation' among those investing in long-duration assets.
Investors will remember that in times of war and government-induced shortages, the illusion of base effects is likely to fade, and even highly manipulated ‘CPLie’ measures will rise. In a nutshell, the politically driven Treasury and the FED have been manipulating funding decisions by shifting issuance among different debt maturities.
US Outstanding T-bills/US total debt ratio (blue line); US 10-Year Yield (axis inverted; red line); Correlations and US Recessions.

To argue that the US Treasury, not the FED, has been the key driver of stocks and other asset markets, consider how, since 2016, fiscal spending expanded significantly outside of a downturn for the first time in the postwar period, initiating the Treasury Put. This shift turned the Treasury into the world's largest de facto shadow bank, issuing debt that underpins trillions in repo liabilities, increasing leverage, and boosting asset prices. The budget deficit rose even as unemployment fell, and post-pandemic, the deficit remains at its highest outside of war or recession, despite low unemployment.

The Affordable Care Act was implemented in the years prior to the Bipartisan Budget Act (BBA), leading to a rise in Medicaid spending, while Medicare spending also rose. Combined outlays for the two programs along with Social Security reached a record 48% of federal spending and 10% of GDP in 2016.

Since 2016, falling federal receipts and rising spending have widened the deficit, which ballooned during the pandemic and now hovers around $1.5-$2 trillion annually. The CBO expects it to remain at or above this level for at least the next decade, driving U.S. sovereign debt to a staggering $35 trillion.

In a world of more efficient repo markets, the surge in collateral has enabled more asset purchases, greater access to funding, and increased leverage. The key point: net Treasury issuance drives global equity prices with a 6–9-month lead time due to its impact on repo markets. The rise in collateralized lending, fuelled by the increased supply of US Treasuries, is becoming increasingly influential in shaping asset prices.

The correlation between Treasury issuance and market performance became notable around 2016, coinciding with the emergence of the Treasury put. This suggests that Treasury issuance has become increasingly significant for markets. As the current decline in issuance continues, stocks may face growing challenges later this year. In the 2016 paper ‘Towards a Theory of Shadow Money’, the authors explain that money in modern financial systems is not a single, uniform entity. Instead, it exists in a hierarchy based on how quickly something can be used to settle a transaction. In this hierarchy, repo deposits rank third, following cash, reserves, and bank deposits.

https://www.ineteconomics.org/uploads/papers/Towards_Theory_Shadow_Money_GV_INET.pdf
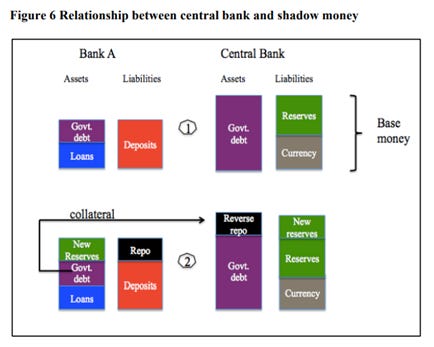
Repos have become more money-like for two main reasons: (a) the increasing depth of repo markets, improved clearing mechanisms, and more advanced collateral-valuation systems; and (b) banks can use repos to expand their balance sheets, similar to how they would when making a loan and creating a deposit, but in this case, it's a collateralized form of a money liability. In a transaction with the central bank, a bank can expand its balance sheet by using government debt as collateral and receiving new reserves in return.
Repo transactions ballooned through the pandemic as the supply of government debt grew to pay for the economic consequences of lockdowns, freeing up investor balance sheets to buy more assets and allowing investors to increase leverage.

As balance sheets are marked to market, the cost of financing falls as increased repo activity drives asset demand and prices higher in a virtuous cycle (when markets are rising). Repos effectively map collateral to reserves, making them quasi-money. The supply of underlying collateral, primarily US Treasuries (about three-quarters of bilateral repos use Treasury debt), is increasingly crucial for asset performance, positioning the US government as a de facto shadow bank. SVB’s bankruptcy underscored the repo market's role in maintaining asset market stability and supporting prices. The Federal Reserve’s Bank Term Funding Program (BTFP), which allowed borrowing against Treasuries and other eligible collateral at par, highlighted the FED's need to mitigate liquidity turmoil. Moreover, the Treasury’s recent focus on issuing bills has bolstered asset markets by allowing money-market funds to use reserves from the reverse repo facility (RRP) to finance the government, thus maintaining liquidity and supporting asset prices. As the Treasury is forced to reduce its issuance of bills, by law or by the return of the Bond vigilantes, the RRP's impact on assets will diminish, but the government will remain crucial to markets through its borrowing and issuance decisions, while further undermining the FED's independence.
For those who are not yet convinced that the FED is far from being what it claims to be during its meetings or when Jerome Powell addresses the media, they should read the 12-page academic paper titled 'The Myth of FED Political Independence.' In this paper, the author asserts that the 'much-vaunted independence of the Federal Reserve is a myth.' The FED is not the bastion of sound monetary policy; rather, it is just another politically co-opted agency of the federal government.' The study further asserts that 'Something like the Stockholm syndrome seems to describe the institutional relationship that exists between the US Congress and the White House (the captors) and the Federal Reserve (the captives).
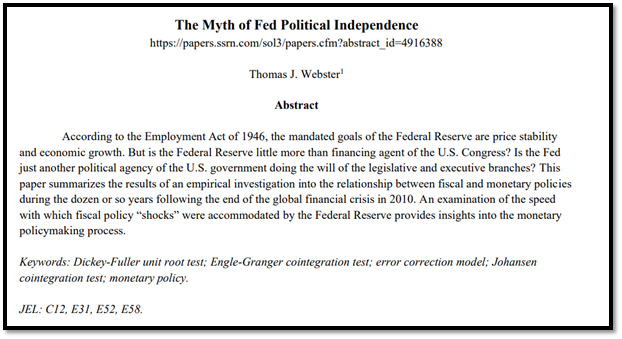
https://papers.ssrn.com/sol3/papers.cfm?abstract_id=4916388
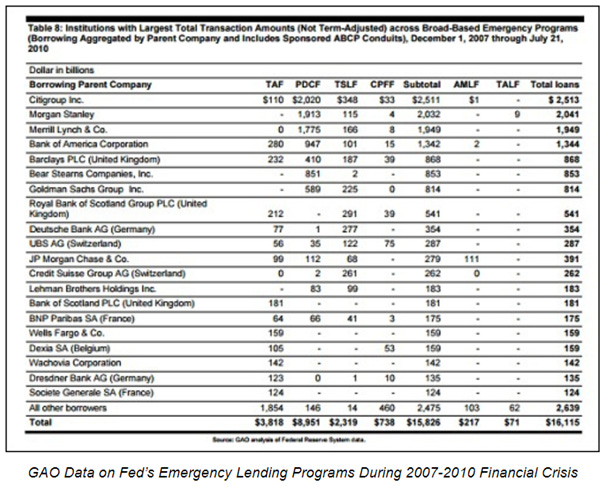
Indeed, it's should already be obvious to anyone paying attention that the Federal Reserve is controlled by Wall Street megabanks. The Federal Reserve System comprises both the Board of Governors and 12 regional FED banks, which are private corporations. These regional banks are owned by member banks within their respective districts. The members elect most of the regional FED bank's Board of Directors. For instance, while Jamie Dimon, Chairman and CEO of JPMorgan Chase, was on the New York Fed's Board of Directors, his bank was under investigation by the New York Fed. The largest shareholders of the New York FED are major Wall Street banks like JPMorgan Chase, Citigroup, Goldman Sachs, Morgan Stanley, and Bank of New York Mellon, illustrating the skewed balance of power. These banks not only benefit from generous bailouts based on their policy of privatizing profits and socializing losses. They are also significant donors to both major political parties, which are supposed to represent the interests of We The People.
Believing that the FED's monetary policy is truly ‘in service to its public mission’ is as naïve as believing Santa Claus will bring peace and prosperity through Keynesian economic policies.

In the meantime, the same banks controlling the FED continue their gambling games, seemingly learning nothing from the 2008 Wall Street financial crisis. The Dodd-Frank financial reform legislation of 2010 failed to address the derivatives gambling that contributed to the collapse of the US financial system. As of December 31, 2023, Goldman Sachs Bank USA, JPMorgan Chase Bank N.A., Citigroup’s Citibank, and Bank of America held a staggering $168.26 trillion in derivatives, out of a total of $192.46 trillion at all federally insured U.S. banks, savings associations, and trust companies. These four banks alone hold 87% of all derivatives at the 4,587 federally insured financial institutions in the US as of that date. For example, Goldman Sachs Bank USA, part of the international trading conglomerate Goldman Sachs Group, is allowed by federal regulators to have $521 billion in assets but holds $54 trillion in derivatives. Under U.S. accounting rules, these derivatives can be reduced through "netting" and moved off the balance sheet, making them less visible to anyone who is not keen enough to spend time digging behind the curtain. Anyone should understand that Wall Street megabanks, having perfected a century-old set of tactics to intimidate regulators, manipulate accounting rules, and prioritize personal greed over the public good, make it clear that the only way to restore sanity and stability to the US financial system is for Congress to reinstate the Glass-Steagall Act. This would permanently separate federally insured banks from the trading casinos on Wall Street.

As everyone should have understood by now, the FED is neither loyal to the US economy nor necessarily interested in self-preservation, as it is following a global program coordinated by the IMF and the BIS to facilitate the new world order. Of course, part of that agenda requires that central bankers never receive blame for their role in any economic crisis. They have no problem blowing up the system as long as there is a convenient scapegoat as the deep states has been accustomed to use suicide bomber to blame for implementing its agenda. The FED has done it before, and it will do it again. As the FED has removed the primary backstop supporting equity markets, the low interest rates that were feeding cheap money into corporate buybacks, the effect of high interest rates will spread further recessionary vibes in an economy increasingly impacted by inflation-driven misery affecting consumers. This trend will accelerate over the winter and beyond the election, regardless of who occupies the White House in 2025, because the effects of high interest rates start slowly and then hit all at once. Investors must understand that the US economy has become so addicted to cheap money from the central bank that it can barely function without it. We are seeing the addict begin to crash. Covid stimulus propped up the system for a few more years, but now that hit of sweet helicopter money is fading, and the high is over. While the FED pivot in September remains phantasmagorical, the real issue appears to be 'the carry trade trap.' Carry trades involve borrowing in a currency with low interest rates, such as the Japanese yen, and reinvesting the proceeds in higher-yielding assets elsewhere (like the U.S.). This strategy has been a significant driver of U.S. stock markets and has kept stocks alive despite the FED’s removal of QE
S&P 500 index (blue line); JPY/USD FX Rate (red line); Correlation.
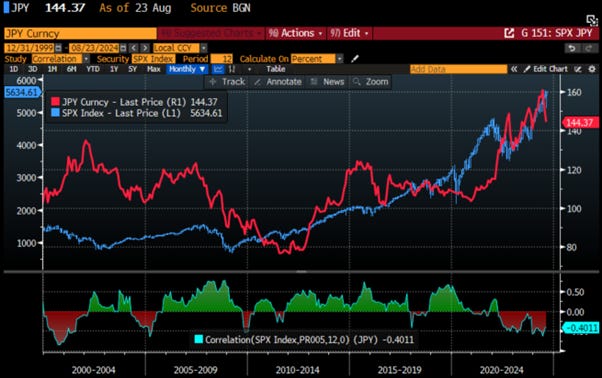
This month’s stock plunge was triggered by fears that the Bank of Japan might hike interest rates further, coupled with expectations that the FED will cut rates in the near term due to recession threats. This would kill the carry trade that has been supporting stocks like other forms of shadow liquidity. To prevent a destructive unwind of the carry trade, the FED would need to coordinate with the BOJ and introduce a new stimulus program to soften the blow. The problem is that by returning to QE, the FED would signal to the world that it has chosen the ‘high side of the inflation fork’ and given up on its 2% inflation target to appease financial markets. Moreover, QE would have no real impact on the FED's other mandate: reducing the unemployment rate.
FED Balance Sheet (blue line); US Unemployment Rate (red line); Correlations and US Recessions.

Ultimately, voters and consumers will demand an explanation as to how it is possible to have deflation in markets and jobs while experiencing inflation in prices all at the same time. The FED won’t have answers for them. There is no way out of this conundrum, as the FED has deliberately manoeuvred the US into this predicament. The only option left is to pull the plug when the timing is most advantageous. After the elections makes the most sense, especially if the current administration, which has been heavily supported by the FED over the past four years, is ousted and there is a red sweep in 2025. In a nutshell, this month’s events prove is that the system is so unstable that even a hint of a change in the status quo could spell disaster. Don’t assume that central bankers will keep trying to kick the can down the road; they’re operating on a timeline that serves the interests of the global establishment, not We The People.
S&P 500 index (blue line); Spread between FED Fund Rate & BOJ Overnight Call Rate (red line); Correlations and US Recessions.

While the shadow FED liquidity and the Activist Treasury Issuance and the Yen carry trade have been contributing to the equity bull market, the recent volatility in financial markets should not be surprising to seasoned investors. History shows that during bullish years, corrections are more frequent than one might expect. When corrections occur, concerns about a 'bear market' often arise. However, historically speaking, the stock market increases about 73% of the time. The remaining 27% of the time, market corrections serve to reverse the excesses of the previous advance. These statistics reflect full-year returns, but intra-year declines of 5-10% are common in any given market year.

Historically, there have been instances where unexpected, exogenous events have led to sharp declines in market prices. For example, the 1987 crash was triggered by the failure of 'portfolio insurance.' The decline in 2011 was caused by an earthquake that triggered a tsunami, flooding Japan and disrupting essential exports. In late 2015, the market dropped sharply in response to Janet Yellen's discussions about tapering monetary support. The 2018 market crash resulted from an unexpected statement by the Federal Reserve, indicating that interest rates were 'nowhere near the neutral rate,' suggesting further rate increases.

Interestingly, it's already well known that the Oracle of Omaha has grown increasingly cautious over the past few months, effectively front running the recent 'Yen Carry Trade Tantrum.' He not only reduced his Apple stake when others were greedy but also dramatically cut his position in Bank of America.

Reading through all the 13F statements filed by smart money investors, it wasn't just Buffett who reduced exposure to the Magnificent 7. Other luminaries like George Soros and Stanley Druckenmiller also trimmed their holdings in the ‘Magnificent Seven’ stocks ahead of the late July rout.

Soros Fund Management sold some of its stake in Alphabet, totalling $58 million, and about $15 million in Amazon.com. The fund increased its stake only in in the harmful vaccine scam related Astra Zeneca, and the coffee shop operators Westrock Coffee, according to regulatory filings for the three months ended in June.

Perhaps not surprisingly, former Soros disciple Stanley Druckenmiller was also among those paring stakes in AI leader Nvidia. His Duquesne Family Office sold more than 1.5 million shares, according to the latest filing.

The latest 13F filings reveal how these ‘insider investors’ capitalized on the run-up before the benign economic outlook turned gloomier. Indeed, even the Magnificent 7 failed to see significant positive EPS revisions over the past earnings season, especially compared to the S&P 500 index. This stands in sharp contrast to the end of Q1 earnings season and has likely raised concerns among investors as they realize that the Magnificent 7 are not as immune to slowing economic growth as the AI hype spread by Wall Street had suggested.
Relative Performance of Magnificent 7 Index to S&P 500 index (blue line); Relative 12-months EPS revisions of Magnificent 7 to S&P 500 YTD (red line).

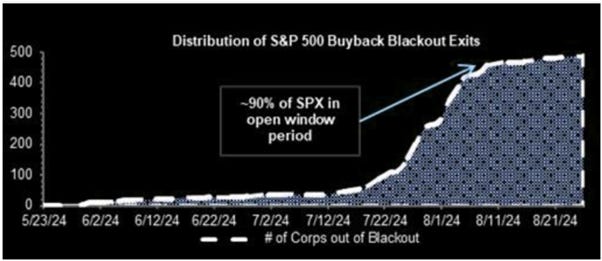
Beyond liquidity and stealth QE, investors know that share buybacks have been a key driver of equity market performance since the start of the pandemic. With the Q2 earnings season now behind us, the 'blackout' period for buybacks has ended. These buybacks remain crucial as they continue to account for a significant portion of net equity purchases in the open market.
Share buyback has not been an insignificant factor supporting equity prices as since 2000, corporate share buybacks have provided 100% of all the all the “net equity purchases.”

That’s why it’s not surprising that there is a high correlation between the annual change in buybacks and the market.

The surge in share repurchases has been a crucial support for stocks in the near term and was a key reason the latest correction ended abruptly. This is especially true given the low overall market liquidity. With executions at roughly $5 billion per day and current low market liquidity, the corporate bid has supported the markets, quickly driving them out of correction territory. Moreover, August and September represent the second-best period of the year, with companies completing 20.7% of all shares repurchases, supporting higher asset prices. The importance of share buybacks for the 'Magnificent Seven' is particularly notable. Except for Tesla, Amazon, and Nvidia, which have increased their shares outstanding since the start of the Covid pandemic, the other four 'Magnificent Seven' stocks (Apple, META, Microsoft, and Alphabet) have significantly reduced their shares outstanding. This reduction has contributed to the illusionary increase in Earnings per Share and the strong performance of these stocks over the past four years
Current Shares Outstanding of META (blue line); Microsoft (red line); Apple (green line); Alphabet (white line); Amazon (orange line); Nvidia (purple line); Tesla (yellow line) rebased at 100 as of December 31st 2019.

While the future of the equity market will remain highly dependent on the level of liquidity injected into it, whether through the Yen carry trade or other forms of shadow liquidity that the FED and the Treasury will continue to provide to keep the music playing as long as the real 'cops' are at the party, investors must understand that liquidity remains the primary driver of Mega Cap performance.
First, these stocks are highly liquid, allowing managers to quickly move money in and out without significant price movements. The importance of liquidity cannot be overlooked for insurance companies, pensions, hedge funds, and endowments, which must handle billions of dollars at a time. Smaller companies often lack the liquidity needed to accommodate large inflows and outflows.
Secondly, the passive indexing effect remains significant. As investors shift from buying individual stocks to the convenience of purchasing broad indexes, capital inflows disproportionately favour the largest capitalization stocks within those indexes. Over the last decade, capital inflows into exchange-traded funds (ETFs) have surged.

Third, Wall Street remains driven by a herd mentality, where investors are more concerned with their careers than with deeply analysing the balance sheets and data of the stocks they recommend to their clients. With social and mainstream media amplifying the latest investment hype surrounding market phases such as 'disruptive technology,' 'meme stocks,' and 'artificial intelligence,' it is not surprising that investors eagerly chase the next 'get rich quick' scheme. Additionally, annual reports like SPIVA, which measure the performance of actively managed funds against their benchmark indices, intensify the 'fear of missing out' (FOMO).

With the top 10 stocks in the S&P 500 index comprising more than a third of the index, a 1% gain in these top 10 stocks equates to a 1% gain across the bottom 90% of the index. As investors purchase shares of a passive ETF, the shares of all the underlying companies must be bought in proportion.

Another reason investors are likely to continue favouring Mega Cap stocks is that these companies still exhibit more substantial earnings growth compared to their small- and mid-cap counterparts. Currently, large-cap companies, particularly Mega Caps, are driving most of the earnings growth. With the economy showing clear signs of deterioration, small- and mid-cap companies are more vulnerable to shifts in economic demand. This vulnerability is reflected in the weakening trend of EPS revisions for the Russell 2000 over the past year, especially in comparison with the S&P 500 and even the Dow Jones, which has barely benefited from the AI hype.
12-month Fwd EPS revisions for the S&P 500 index (blue line); Russell 2000 (red line) & Dow Jones (green line).

Lastly, and probably most importantly, bringing us back to the recent 'sugar high buyback bounce,' large-cap, predominantly Mega Cap companies engage in share repurchases far more than small and mid-caps. Corporate share buybacks are expected to approach $1 trillion this year and exceed that amount in 2025, with Apple alone accounting for more than 10% of these purchases. In this context, it should not be a surprise that IT and Communication Services have been with Financials, the sectors contributing the most to buybacks inside the S&P 500.

The last question is how long this 'sugar high buyback bounce' can last. As companies receive the green light to repurchase stock and with the rebound from the early August plunge, it means that for the time being, everyone is back in the pool.

This could last until the week of September 5th, when the buyback window will once again close ahead of the start of the third-quarter earnings season. Looking at the authorization front, 2024 year-to-date authorizations stand at $819.0 billion, up approximately 14% compared to 2023 year-to-date authorizations. As these authorizations are executed, expect even more repurchases before the ‘buyback window’ closes once again.

Before getting too excited about the future, investors should remember that the level of share buybacks largely depends on the earnings growth of corporate America and its access to cheap debt for those companies financing their buybacks through debt issuance. With interest rates expected to remain higher for much longer, investors should view the recent 'dead buyback bounce’ as a temporary relief in a structurally higher volatility environment for stocks.
This means that as investors focus more on the Return OF Capital rather than the Return ON Capital, they should focus on companies with low financial leverage on their balance sheet; their ability to grow sales and earnings in any kind of economic environment. Investors should also understand that the ‘August Tantrum’ in financial markets is likely incomplete and should once again prepare their portfolios for structurally higher volatility as the last months of the year of political hell unfolds. In this context, investors will once again will have to deal sooner rather than later with the temptation of higher complacency which will again provide an opportunity to hedge their equity allocation ahead of an interesting time ahead of the US presidential election as the more the polls claim Kamala will win, the harder the market will fall for her policies, which will be a disaster for the economy.

Those who surrender to the siren song of buybacks, price controls, trade barriers and more government intervention are like men who willingly believe what they wish. The coming months will likely be more volatile and uncertain than anything most of us have experienced in our financial market careers. Therefore, the best advice for investors may be to be fearful when others are greedy and greedy when others are fearful, as we navigate the upcoming rollercoaster.

To end, the world is now caught between a kleptocracy (a government ruled by thieves) and a kakistocracy (a government run by unprincipled career politicians, corporations, and thieves that panders to the worst vices in human nature and has little regard for the rights of the citizens). For years, the government has been playing a cat-and-mouse game with the people, allowing just enough freedom to make us think we are free, but not enough to actually live as free people. In other words, We The People are allowed to bask in the illusion of freedom while being stripped of the very rights intended to ensure that we can hold the government accountable to the rule of law. Instead, the US and the other countries led by WEF servants, have become places where fascism, totalitarianism, and militarism go hand in hand. In a nutshell, investors and consumers are all trapped in a political matrix designed to sustain the illusion that they are citizens of a constitutional republic.

WHAT’S ON THE AGENDA NEXT WEEK?
The last week of the second month of the third quarter will start with a bank holiday in the UK and will feature the 'grand finale' of the second-quarter earnings season, with Nvidia, CrowdStrike, and Salesforce reporting their quarterly results alongside Dollar General and other US retailers. On the macroeconomic front, attention will focus on the US Core PCE Index, as well as the final estimate of the University of Michigan Consumer Confidence and inflation expectations. Outside the US, investors will closely monitor the Eurozone CPI and China's Manufacturing and Non-Manufacturing PMI indexes.

KEY TAKEWAYS.
As the US political circus brings interesting times ahead, here are the key takeaways:
The latest Japan CPI provided further reasons for the Bank of Japan to continue raising rates as inflation continues to spread across various sectors of the economy.
As the US discovers what truly lies behind 'Kamunism,' the US Manufacturing and Services PMI continue to diverge, as the illusion of a soft landing is evaporating further.
Like the CP-Lie, jobs data are grossly inaccurate and serve as a tool in Keynesian propaganda.
Probably inspired by the Wyoming countryside, Powell confirmed that not only is the FED not politically independent, but it is also partisan and has embraced the Keynesian ideology of those currently ruling in Washington since the last election.
While the FED pivot may be finally here, it will not meet Wall Street’s phantasmagorical expectations of more than 100 bps cut by year end.
Until the September 18th FOMC meeting, GOOD NEWS is likely to be BAD NEWS, and BAD NEWS will also be BAD NEWS as the US economy heads into an inflationary bust, with the impotent FED running out of power and time to implement its infamous pivot.
Part of the FED’s forward confusion narrative has been to inject ‘shadow liquidity’ into financial markets by using the Treasury General Account and the Reverse Repo Program to keep financial markets afloat.
Activist Treasury auctions have created a ‘stealth QE,’ enabling reckless government spending while spreading inflation-driven misery.
The FED’s global agenda, at the expense of the US economy, has led to ‘carry trade trap’ which has been an additional source of shadow liquidity boosting equity markets.
While 'insider smart investors' have reduced their equity allocations, FOMO-driven investors remain enticed by the 'sugar high’ buyback bounce, which will be short-lived.
The long-term sustainability of buybacks is threatened by slowing EPS growth and higher for much longer interest rates, as buybacks cannot be indefinitely financed out of thin air.
Investors should focus on companies with low-leveraged balance sheets and strong business moats that protect them from inflation-driven misery, as the economy risks a crash landing.
Physical gold remains THE ONLY reliable hedge against reckless and untrustworthy governments and bankers.
Gold is an insurance to hedge against 'collective stupidity' that is in great abundance, in particular among bankers in the western world.
With continued decline in trust in public institutions, particularly in the Western world, investors are expected to move even more into assets with no counterparty risk which are non-confiscatable, like physical Gold and Silver.
Long dated US Treasuries are now an ‘un-investable return-less' asset class which have also lost their rationale for being part of a diversified portfolio.
In such an environment, the risky part of the portfolio has moved to fixed income and therefore rather than chasing long-dated government bonds, fixed income investors should focus on USD investment-grade US corporate bonds with a duration not longer than 12 months to manage their cash.
In this context, investors should also be prepared for much higher volatility as well as dull inflation-adjusted returns in the foreseeable future.
HOW TO TRADE IT?
As we finally know who is contending to become the 47th U.S. president, unless the actors of this political circus are swapped again in a last-minute plot twist, equity investors cheered the acknowledgment that the FED has embraced the Keynesian view of the Washington plutocracy. In this context, the S&P 500 closed the week just 35 points below its all-time high, rebounding for a second week in a row. Interestingly, the Nasdaq underperformed the Dow over the past week. The S&P 500 is heading toward a double top, which would likely coincide with the next black swan event that could trigger the Ides of September, potentially pushing markets to their January lows. This would provide a buying opportunity for investors who understand that more Keynesianism will only lead to more inflation, driving those not owning stocks and gold into misery.

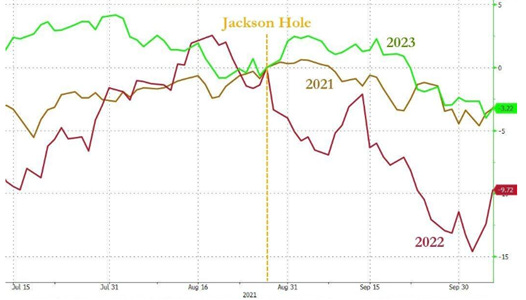
Investors should also take note that five of the six Powell Jackson Hole speeches saw the S&P 500 drop 7.5% on average in the next three months and that even last year September was anything else than a walk in the park for investors.
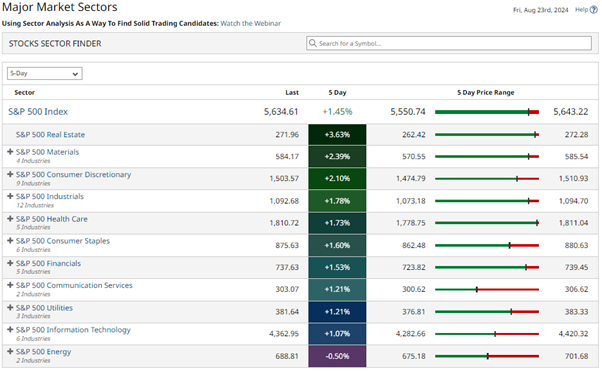
In this context, where everything except energy is going up, the rebound was led by the sectors most sensitive to interest rates, such as Real Estate, Materials, and Consumer Discretionary, while IT and Energy underperformed.
In this environment, investors should be extremely rigorous in implementing a few simple but effective rules to limit the impact of rising volatility and uncertainty in financial markets. These rules can be summarized as follow:
Tactically raise cash levels in portfolios when the consensus is excessively greedy and complacent.
Reduce concentration risk in crowded trades, as these trades, like the Magnificent 7, will be particularly affected by swings in liquidity.
Add or increase allocations to real antifragile assets such as physical gold and silver, which tend to offset risk during uncertain times in the economy and wars.
If a further correction occurs as expected in September, preparation allows you to withstand the impact. Protecting capital means less time spent getting back to breakeven afterward. Alternatively, it is relatively easy to reallocate funds to equity risk if the market reverses and resumes its bullish trend. Investing during periods of market uncertainty can be difficult, but there are steps investors can take to ensure increased volatility is manageable:
Have excess emergency savings so you are not ‘forced’ to sell during a decline to meet obligations.
Extend your time horizon to 5-7 years, as buying distressed stocks can become even more distressed.
Don’t obsessively check your portfolio.
Stick to your investing discipline regardless of market fluctuations.
If we are correct and the recent corrective process is incomplete, leading to a much bigger pullback as we approach the D-day of the year of political hell (i.e. November 5th), then reducing risk will help lower portfolio volatility. However, if we are wrong, investors can reallocate to equities and rebalance portfolios for growth as needed when the dust has settled.
In the meantime, always follow your process and avoid listening to unscrupulous Wall Street bankers and parrot journalists. These individuals often do not have investors' best interests at stake but are focused on selling products that frequently do not meet long-term risk-return goals. As risk management to avoid severe drawdowns should remain a priority for everyone, investors should not be fearful of adding exposure to physical gold, silver, and quality stocks during the upcoming pullback. At the same time, they should stay away from ‘Wall Street mermaids’ trying to lure investors into long-dated government bonds, which will ultimately prove to have lost their antifragile appeal. In the meantime, remember: A ‘Black Stone’ is NOT Gold, and In Gold We ALL Trust.
To conclude, investors should remember that the catalysts behind the market tantrum in early August have not evaporated.
First, equity valuations remain historically high, keeping Wall Street uneasy even before August's sell-off, as concerns grow with continued investments.
Second, economic data is fragile, with August's disappointing nonfarm payrolls raising concerns, though not signalling a recession, leaving room for further negative surprises.
Third, monetary policy has become impotent.
Fourth, geopolitical tensions remain elevated, with Middle East conflicts and oil price spikes contributing to market volatility and the inevitable return of the inflation boomerang.
Fifth, September has been a tough month for stocks and fixed income, with the S&P 500 falling in four straight Septembers and bonds struggling for seven years in a row.

If this report has inspired you to invest in gold and silver, consider Hard Assets Alliance to buy your physical gold:
https://hardassetsalliance.com/?aff=TMB
At The Macro Butler, our mission is to leverage our macro views to provide actionable and investable recommendations to all types of investors. In this regard, we offer two types of portfolios to our paid clients.
The Macro Butler Long/Short Portfolio is a dynamic and trading portfolio designed to invest in individual securities, aligning with our strategic and tactical investment recommendations.
The Macro Butler Strategic Portfolio consists of 20 ETFs (long only) and serves as the foundation for a multi-asset portfolio that reflects our long-term macro views.
Investors interested in obtaining more information about the Macro Butler Long/Short and Strategic portfolios can contact us at info@themacrobutler.com.
Unlock Your Financial Success with the Macro Butler!

If this report has inspired you to invest in gold and silver, consider Hard Assets Alliance to buy your physical gold:
https://hardassetsalliance.com/?aff=TMB
Disclaimer
The content provided in this newsletter is for general information purposes only. No information, materials, services, and other content provided in this post constitute solicitation, recommendation, endorsement or any financial, investment, or other advice.
Seek independent professional consultation in the form of legal, financial, and fiscal advice before making any investment decisions.
Always perform your own due diligence.