


The FED Can’t Stop The Business Cycle Trainwreck


What’s behind the numbers?
As widely anticipated the Federal Open Market Committee votes 11-1 to lower benchmark rate by 25 basis points to target range of 4.25%-4.5%. Cleveland Fed President Beth Hammack, the newcomer in the committee, votes against decision in favour holding rates steady, the second such dissent since the Fed began lowering rates in September
In its press release, the FOMC made a subtle adjustment to the language of its post-meeting statement, noting that it would assess several factors “in considering the extent and timing of additional adjustments” to the policy rate. Previously, the statement simply said, “in considering additional adjustments.” The statement also retains language indicating that risks to achieving employment and inflation goals “are roughly in balance.”
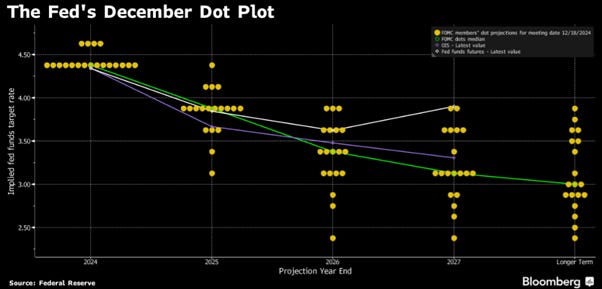
In its updated Summary of Economic Projections, the median FED official forecasts an inflation rate of 2.5% by the end of 2025, up from the 2.1% projected in September. Unemployment rate expectations for 2024 and 2025 are 4.2% and 4.3%, respectively, compared to the previously forecasted 4.4% for both years. During his press conference, Jerome Powell stated, “The job market is not a source of inflation and is not expected to be in the foreseeable future.” In his Q&A, Powell noted that the higher inflation in September and October was a "large factor" and perhaps the single biggest factor behind the upward trajectory of today's inflation forecasts.

The "dot plot" of rate projections shows the median official expects to lower rates by half a percentage point in 2025, implying just two quarter-point cuts next year. This compared to 4 cuts expected for 2025 in September. On a side note, five of the 19 officials have penciled in 75 basis points of cuts or more for 2025.
Regarding the impact of tariffs on future inflation, Powell indicated that policy uncertainty was one reason some policymakers factored in greater uncertainty about disinflation. This marks a shift from previous meetings, where Powell repeatedly emphasized that the FED wouldn’t react until policies were nearly or fully implemented. In essence, Trump isn’t even in office, yet some FED officials are already factoring in potential policies.

Powell noted that he and his colleagues have been conducting ‘a good bit of work’ on how tariffs might impact inflation, referencing the 2018 Fed analysis on tariffs as a useful ‘starting point’ for considering future trade measures. He added that it’s uncertain whether the previous large tariff episode under Trump is a reliable model for the current economy, emphasizing that the FED might need to respond differently given today's economic conditions.

The Federal Reserve also reduced its reverse repurchase agreement (RRP) rate by an extra 5 bps alongside the expected 25-bp cut to the federal funds target rate. This adjustment is likely to slightly lower related rates like the fed funds effective rate, T-bills, and SOFR. The fed funds effective rate, currently 8 bps above the lower bound, may narrow to 5 bps above it. While the move aims to reduce RRP facility usage, any decline is expected to be modest ($20–$25 billion), as other instruments may chase the lower RRP rate. With growing money fund assets, some allocation might shift away from RRP if repo rates don't adjust, though this seems unlikely.

Powell's opening remarks indicated that his sentiment in the prepared comments was slightly more hawkish than at the last meeting. In a nutshell, Powell was not necessarily more hawkish, but he was certainly less dovish.

Thoughts.
Wall Street bankers and YOLO investors are about to realize that the FED's actions since September have been irrelevant to the real economy. Even Powell admitted in his press conference that many consumer borrowing costs, such as mortgages, auto loans, and credit card rates, have risen since September despite the FED pivot. In a nutshell, it is increasingly evident that the FED has become impotent in managing the economy, which is now under the influence of bond vigilantes as fiscal dominance expands.
US Treasury Yield curve as of December 18th (green line); September 18th (yellow line).

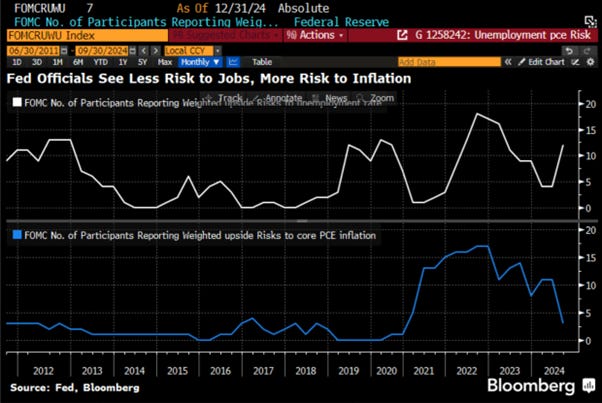
Consistent with the hawkish shift in the economic forecast, more FED officials see the risk to inflation to the upside and they also see less risk to the labour market, compared with three months ago.
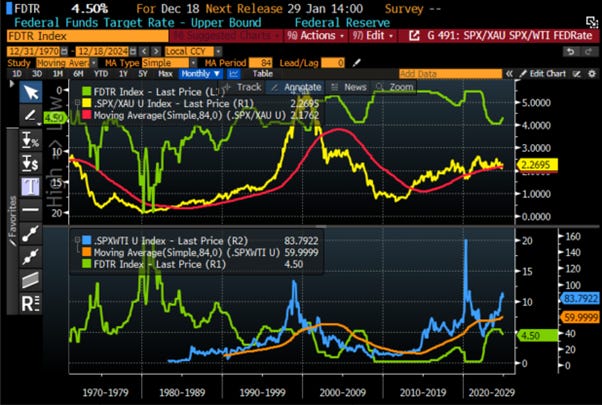
While the FED has been attempting to influence business cycles for the past 60 years, examining the FED Funds rate changes alongside the business cycle, illustrated by the relative position of the S&P 500 to oil and its 84-month moving average, reveals a consistent pattern. A decline in the FED Funds rate has almost always coincided with the peak of the S&P 500 to oil ratio. Furthermore, no FED Funds rate cycle has ever prevented the ratio from falling below its 7-month moving average, signalling a shift from economic boom to bust in the US economy.
Upper Panel: FED Fund Rate (purple line); Lower Panel: S&P 500 to WTI ratio (green line); 84-months moving average of the S&P 500 to Oil ratio (red line).

Many Wall Street bankers have wondered what truly motivated the FED pivot in the mountains of Wyoming last August, aside from that the FED sought to influence the outcome of the US presidential election. However, 2024 is not the first time the FED has initiated an interest rate cut cycle while the US economy was in an inflationary mode. This also occurred during the 2007-2009 interest rate cut cycle.
Upper Panel: FED Fund Rate (purple line); Lower Panel: Gold to Bloomberg US Treasury Index ratio (yellow line); 84-months moving average of the Gold to Bloomberg US Treasury Index ratio.

From 2007 to 2009, the US was in what would be considered, based on the Schumpeterian business cycle, an inflationary bust. The bust of the dot-com boom had already led to monetary illusion starting in April 2002, keeping investors in a bust that lasted until mid-2013.
Upper Panel: FED Fund Rate (purple line); Lower Panel: S&P 500 to Gold ratio (blue line); 84-months moving average of the S&P 500 to Gold ratio.

Those who understand that the US economy is gradually shifting from an inflationary boom to an inflationary bust should not be surprised of the impotence of the FED. As the S&P/Gold ratio is bouncing around its 7-year moving average, a leading indicator, typically by 3 to 6 months, for a similar trend in the S&P/WTI ratio, which reliably signals a shift from economic boom to bust will understand that the action taken by the FED will not impact the trend in long dated yield as the USD (i.e., US Treasuries) remains a poor store of value compared to gold, the timeless and resilient store of value.

Looking at what the FED was forced to do historically when the S&P 500 to gold ratio broke below its 7-year moving average, such as between June 1971 and July 1983 or February 2002 and May 2013, pushing the S&P 500 to WTI ratio below its 7-year average a few months later, the FED has consistently been compelled to raise rates sooner rather than later to combat monetary illusion, ultimately leading to an economic bust. This suggests that if Powell and his PhD colleagues are genuinely committed to keep the USD, the world reserve currency, as a reliable store of value and therefore fighting inflation for the benefit of the American people, as proclaimed at every press conference, it seems inevitable that the FED will have to reverse course in 2025 and raise rates again, if only to maintain the appearance of not fully colluding with the Treasury to finance additional reckless government spending at the cost of increasingly entrenched inflation in the US economy.
Upper Panel: S&P 500 to Gold ratio (yellow line); 84-months Moving average of S&P 500 to Gold ratio (red line); FED Fund Rate (axis inverted; green line); Lower Panel: S&P 500 to WTI ratio (blue line); 84-months moving average of S&P 500 to WTI ratio (orange line); FED Fund Rate (axis inverted; green line).
Most analysts cling to outdated Keynesian theories, projecting the future based solely on central bank actions. These theories, rooted in academic Marxist ideas, have proven ineffective. Even former Fed Chairman Paul Volcker acknowledged this in his 1978 speech, The Rediscovery of the Business Cycle, where he criticized the so-called ‘New Economics.’ The belief that government policies could eliminate business cycles and maintain steady growth was shattered by the economic turmoil of the 1970s. Volcker highlighted that inflation and recession, particularly in 1974-75, exposed the failure of these policies and the limits of monetary and fiscal intervention. Any analyst fixating on the FED today has clearly missed the memo.

The FED raised rates in May 1928 and continued to do so into the 1929 high, with no noticeable effect. The 1929 stock market saw its biggest rally despite interest rates being at their lowest levels, driven by capital inflows. Conversely, during the Panic of 1899, rates soared to nearly 200% due to massive capital outflows. The notion that stock markets rise when interest rates fall has no consistent basis in reality.

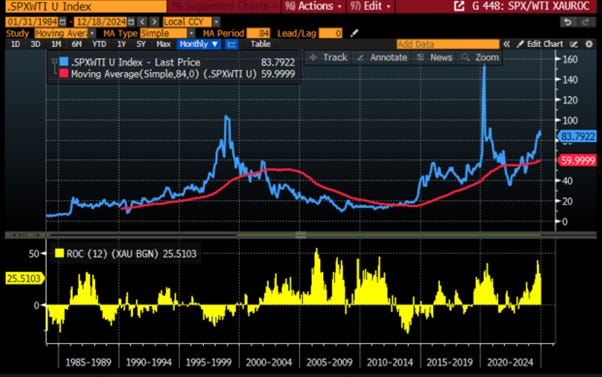
As the US economy heads slowly but surely into an inflationary bust, regardless of the FED's actions, investors should remember that in such an environment, neither stocks nor bonds provide a positive inflation-adjusted 12-month return once the S&P 500 to WTI ratio breaks below its 7-year moving average, which is anticipated by mid-2025 once tariffs start to have their effects in the real economy.
S&P 500 to WTI ratio (blue line); S&P 500 to WTI ratio 84-months moving average (red line); S&P 500 adjusted to inflation 12-months Rate of Change (middle panel; yellow histogram); Bloomberg US Treasury Total Return Index 12-month adjusted to inflation Rate of Change (lower panel; purple histogram).

While Powell keeps reiterating a ‘Mission Accomplished’ stance in the fight against inflation and effectively abandoned the 2% inflation target since his appearance at Jackson Hole this summer, investors should adjust their portfolios for reflation. As the US economy gradually shifts from an inflationary boom to an inflationary bust, this will be painful, especially for those investors who are still holding long-dated bonds while gold is the only antifragile asset to include in their portfolios.
S&P 500 to WTI ratio (blue line); S&P 500 to WTI ratio 84-months moving average (red line); Gold priced in USD terms adjusted to inflation 12-months Rate of Change (lower panel; yellow histogram).
This will also be a painful period for investors who still follow the biased Wall Street narrative that they should buy dips in energy consumers and sell rallies in energy producers. Indeed, the opposite approach would be more appropriate as unloved and under-owned energy producers will outperform cherished and over-owned energy consumers in such an environment.
Upper Panel: S&P 500/WTI ratio (blue line); 84 months Moving Average of the S&P 500/WTI ratio (red line); Middle Panel: Relative Performance of S&P 500 IT sector to S&P 500 Energy sector (green histogram); Lower Panel: S&P 500 IT index 12-month rate of change (yellow histogram).

In a nutshell: The FED delivered a quarter-point cut, bringing total reductions to 100 basis points for the year, and signalled a more cautious approach ahead, with projections indicating fewer rate cuts in 2025 and inflation unlikely to reach the 2% target until 2027. In this context, investors will increasingly understand that the FED can not stop the business cycle trainwreck which is moving from an inflationary boom into an inflationary bust.
Market reactions.
US stocks had their worst Fed decision day since January, when policymakers had warned it wouldn’t be appropriate to cut rates until they had greater confidence inflation was headed to 2%. The S&P 500 fell below the 6,000 level and its 50-days MA (5,922), suffering its worst day since August. The Nasdaq 100 dropped 3.6%, the most in five months. The Dow recorded its 10th straight daily decline and closed below the post-election rally gap.

There was nowhere to hide, with all 11 sectors ending the day in the red and only 20 S&P 500 members finishing in the green. Among sectors, Healthcare, Consumer Staples, and Utilities performed relatively better than the global index, while Consumer Discretionary, Real Estate, and Communication Services underperformed.

In money markets, discounting the new DOT plots, the total number of interest rate cuts declined from more than 3 to less than 2 with the next rate cut now fully discounted for September 2025.

As the FED is now increasingly unlikely to ease further and could potentially be forced to hike again sooner rather than later, the USD received another boost and ended the day at a new high for the year.

Gold was sold along with other assets as it continues its consolidation process below the 50-day moving average (USD2,670). Investors still need to realize that in an inflationary bust, the precious metal is the only asset that will help preserve their wealth. Instead of selling the rallies, they will need to buy the dips in such an economic environment.

The US 10-year yield broke above 4.50% as those with a modicum of common sense begin to realize that the FED and the government’s actions will lead to much higher long-term yields in the foreseeable future as the once upon risk free rate is no more free of risks.

Key takeaways.
The FED remains politically data-dependent but economically irrelevant.
The Trump administration's impact on next year's outlook has led the FED to raise its estimate of the neutral interest rate, with uncertainty around new policies.
Indeed, variables such as the war cycle and economic uncertainties surrounding the new fiscal policies implemented by the 47th U.S. president-elect will inevitably bring back reflation sooner rather than later.
In this context, Wall Street must still acknowledge the FED's impotence in changing the course of the business cycle, as what truly matters is Corporate America's ability to generate profits based on the cost of energy.
Therefore, whether the FED cuts rates remain almost irrelevant; the real issue is stopping the forever bankers' wars and tariffs which are structurally stagflationary.
In this context, the misguided Wall Street bankers will once again be wrong in thinking rate cuts will solve economic problems, which will only worsen as the new president is unable to put an end to the corruption and nepotism in managing public funds.
In this environment, inflation-driven misery will keep spreading stagflationary vibes, making the 1970s and the GFC likely to look like a walk in the park compared to what we may face over the next 4 years.
In the coming weeks, GOOD NEWS is likely to be BAD NEWS, and BAD NEWS will also be BAD NEWS as the US economy moves from an inflationary boom into an inflationary bust and the FED is seen as increasingly incompetent to solve economic problems the ‘too big to fail’ have become ‘too big to save’.
Political and geopolitical uncertainties will ultimately lead to a stronger USD, higher Treasury yields, and increased oil and gold prices.
As the 47th US president is unable to deliver on his promises, trust in public institutions (including the FED) will continue to decline, leading investors to move even more into assets with no counterparty risk and which are non-confiscatable, like physical gold silver and platinum.
For fixed-income investors still chasing long-duration trades, more pain awaits, as long-dated yields have not yet reflected the new stagflation reality.
In an inflationary bust, the best way to protect wealth on an inflation adjusted basis is to own a substantial part the portfolio in Physical Gold (at least between 25% to 40%) and avoid long dated bonds.
As the risks of an inflationary bust are rising, investors should also prepare their portfolios for MUCH HIGHER volatility.
In a nutshell, investors should also remain prepared for dull inflation-adjusted returns in the foreseeable future.

Bottom line: The FED decided that, even before any tariffs have been implemented, Trump's policies will be re-inflationary.
As the 47th U.S. president prepares to take office and tariffs add to the inflationary impact of the forever bankers' wars, the FED is becoming increasingly irrelevant in solving economic problems. As tariffs are implemented and with a president understanding that consumer inflation triggered the red sweep in November, investors cannot rule out the possibility of price controls on certain goods. This could make the inflationary bust of the 1970s seem like a walk in the park compared to what lies ahead in the rest of the 2020s. In this context, investors should tactically hold a significant cash position, as volatility is expected to rise in the weeks leading up to the counting and certification of the U.S. presidential election on January 6th, 2025, and inauguration day on January 20th. This cash will have to be used to buy the dips in physical gold, silver and other real assets available in limited supply.
Aside from allocating 30% to 40% of their portfolios in physical gold, investors should focus on low-leverage companies capable of sustaining EPS and FCF growth and start buying the dips in energy producers’ companies while selling the rips in energy consumers’ companies. The Aerospace Defence sector is another area where equity investors should continue to buy the dips, as the prospects for peace are evaporating.
In fixed income, investors should avoid long-dated bonds, especially government bonds with maturities beyond six months. For those seeking fixed-income exposure, investment-grade corporate issuers with maturities no longer than 12 months are the preferred way to generate income. For anyone preparing for the inflationary bust to escalate, long-dated fixed-income investments, once considered risk-free assets, are now anything but risk-free. These should be replaced mainly by physical gold, and alternatively by physical silver, and platinum for those who can stomach the higher volatility associated with PGM investments. These new antifragile assets will benefit from scarcity premiums during times of war and the heightened risks of an impending financial and sovereign debt crisis, first in Europe and then in the US.

If this report has inspired you to invest in gold and silver, consider Hard Assets Alliance to buy your physical gold:
https://hardassetsalliance.com/?aff=TMB
At The Macro Butler, our mission is to leverage our macro views to provide actionable and investable recommendations to all types of investors. In this regard, we offer two types of portfolios to our paid clients.
The Macro Butler Long/Short Portfolio is a dynamic and trading portfolio designed to invest in individual securities, aligning with our strategic and tactical investment recommendations.
The Macro Butler Strategic Portfolio consists of 20 ETFs (long only) and serves as the foundation for a multi-asset portfolio that reflects our long-term macro views.
Investors interested in obtaining more information about the Macro Butler Long/Short and Strategic portfolios can contact us at info@themacrobutler.com.
Unlock Your Financial Success with the Macro Butler!

If this report has inspired you to invest in gold and silver, consider Hard Assets Alliance to buy your physical gold:
https://hardassetsalliance.com/?aff=TMB
Disclaimer
The content provided in this newsletter is for general information purposes only. No information, materials, services, and other content provided in this post constitute solicitation, recommendation, endorsement or any financial, investment, or other advice.
Seek independent professional consultation in the form of legal, financial, and fiscal advice before making any investment decisions.
Always perform your own due diligence.