


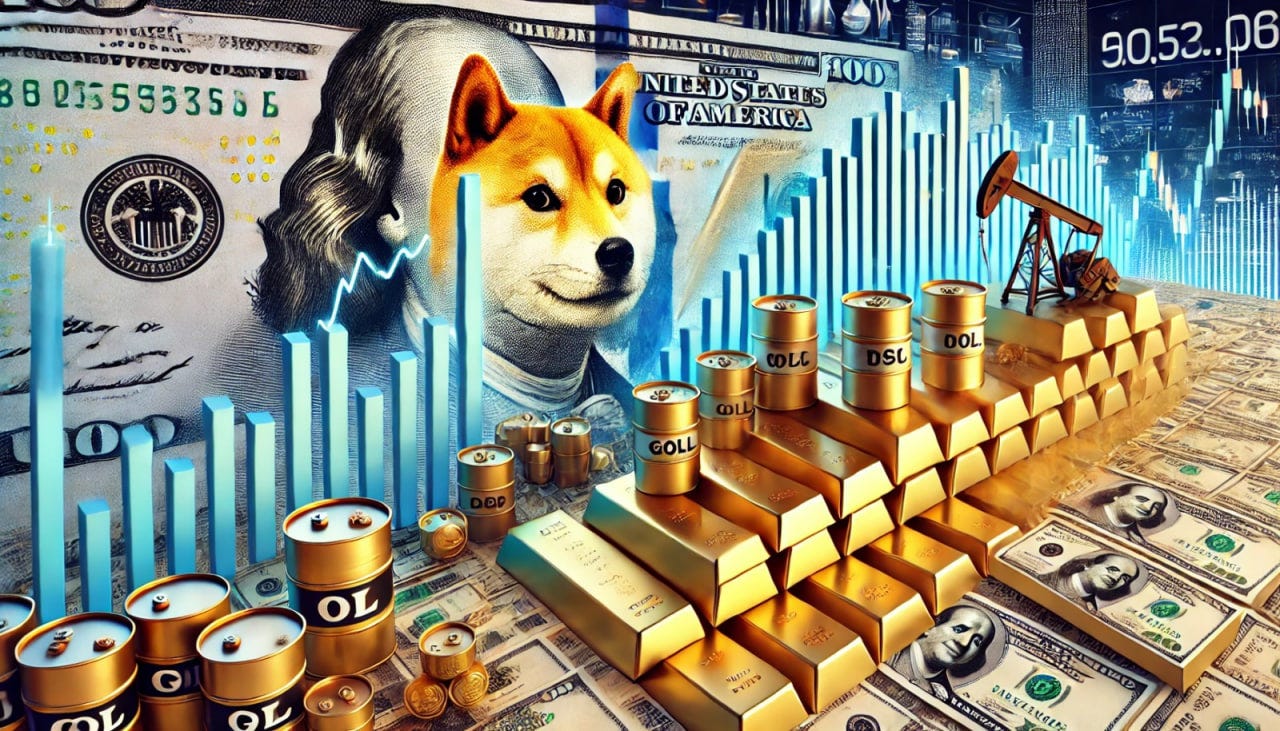
The Real DOGE: Debt, Oil, Gold & Equity

THE WEEK THAT IT WAS...
The last full week of the first quarter of the Jubilee year was a quiet one for investors, who focused on the flash estimate of the U.S. manufacturing and services indices, the release of the Core PCE index, and another set of consumer sentiment and inflation expectations from the University of Michigan.
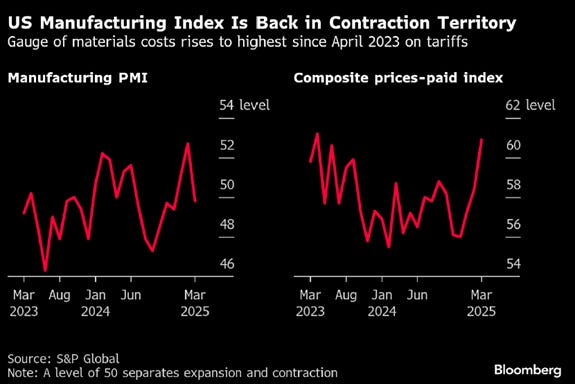
The US Flash Manufacturing PMI fell back into contraction at 49.8, nearly 3 points below the previous month and well short of the 51.7 expected. While stronger demand boosted service sector output, sentiment about the year ahead dropped to its second-lowest level since 2022. Driven by new business and improved weather, the Flash March Composite Index rose 3 points to 52.4. However, concerns are growing over higher tariffs and federal spending cuts. The report also highlighted rising inflation pressures, with manufacturers' prices increasing at the fastest pace since February 2023, and overall input costs surging at the highest rate in nearly two years, partly due to rising labor expenses.
In a nutshell, the flash PMI data suggests that the recent 'Trump-Re-Flation' is set to morph into 'Trump Stagflation' sooner rather than later.
After a hotter-than-expected CPI and PPI earlier in the month, anyone with a modicum of common knowledge would have anticipated that the FED's preferred price measure, the core PCE deflator, which is merely a mathematical computation of core CPI and PPI, would rise. It increased by 0.37% (vs. an upwardly revised 0.30%). On a year-over-year basis, core PCE inflation climbed to 2.8% (vs. 2.7% prior). Higher healthcare and financial services costs drove much of the inflation in the FED’s “supercore measure”, core services excluding housing. Durable goods prices also rose, adding more than five basis points to monthly core inflation, even before the bulk of planned tariffs take effect.

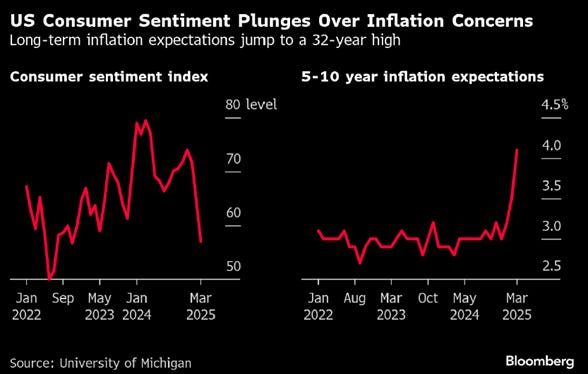
Despite having been widely mocked by the FED chairman, the University of Michigan’s 1-year consumer inflation expectations surged to 5.0%, the highest since August 1992, exceeding previous estimates and expectations of 4.9%. At the same time, US consumer sentiment plunged to a more than two-year low, with the final March reading dropping to 57 from 64.7 in February, below both the preliminary estimate of 57.9 and economists’ forecasts. Rising anxiety over tariffs continues to weigh on consumers, contributing to a sharp deterioration in long-term inflation expectations, which have now jumped to a 32-year high.
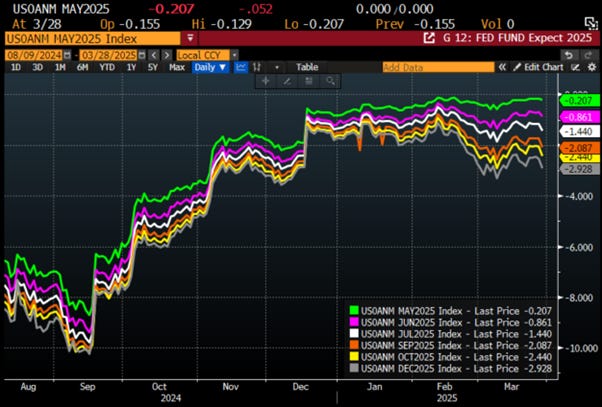
In this context, Wall Street bankers and their parrots continue to delude themselves into believing that the increasingly impotent FED will keep cutting rates, even as the president enacts tariffs and tighter immigration policies that will fuel stagflation, regardless of the White House's official propaganda. Likely driven by the belief that FED rate cuts will once again rescue Wall Street and Main Street as the U.S. economy shifts into an inflationary bust, the market now prices in a 92% chance of three rate cuts this year, with the first fully expected in June, compared to October just a month ago. The reality is that no rate cut may even materialize over the next nine months, while the FED could be forced to hike rates again to combat the coming inflationary bust if it wants to keep a modicum of credibility among the American people and investors.
Financial acronyms emerged in the early 20th century for efficiency as markets grew, with terms like IPO and P/E ratio becoming standard. The rise of electronic trading in the late 20th century accelerated this trend, introducing acronyms like ETF and HFT. YOLO ("You Only Live Once") began as slang but became a finance term during the 2020 meme stock frenzy, popularized by Reddit’s Wall Street Bets. It epitomized high-risk, high reward investing, often involving leveraged bets on volatile assets. While some profited, many-faced heavy losses, underscoring the risks of FOMO-driven investing over fundamentals. Since last November’s election of the "Disruptor in Chief," the acronym "DOGE" has taken on new meanings. Originally an internet meme featuring a Shiba Inu, it later became the name of Dogecoin, a cryptocurrency. More recently, "DOGE" has been repurposed as the Department of Government Efficiency, a U.S. initiative to cut waste and improve efficiency. As the first quarter of the Jubilee year closes, savvy investors tracking the business cycle know the real "DOGE" that matters: Debt, Oil, Gold, and Equity.
Starting with Debt, while the Department of Government Efficiency boasts about cutting millions in wasteful spending, the reality is stark. In February, the U.S. government spent $603 billion, up 6% from $567 billion a year ago, while collecting just $296 billion in tax revenue. This led to a $307 billion deficit for February, meaning tax revenues couldn’t even cover the shortfall. Put simply, the U.S. spent more than twice what it collected, pushing the 2025 deficit to $1.147 trillion, already covering 38% of fiscal year spending.

This is a problem because not only is the cumulative budget deficit for the first five months of fiscal 2025 the highest on record, surpassing even the fiscal shock of the post-COVID response, but the U.S. government also has an additional $8.70 trillion in debt to refinance beyond this $1+ trillion deficit. In a nutshell, almost $10 trillion of US government debt will need to be issued in the last 9 months of the Jubilee Year, that s more than a trillion a month.

Taking another perspective: In just the first five months of the fiscal year, the U.S. has spent $480 billion on interest alone, a record high and more than three times what the Department of Government Efficiency claims to have saved since January 20, 2025.


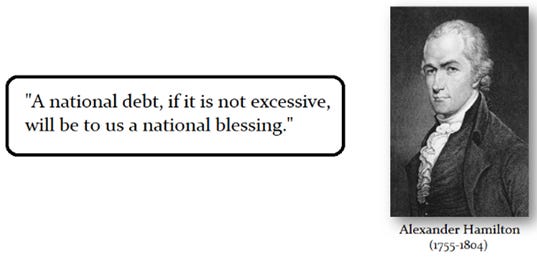
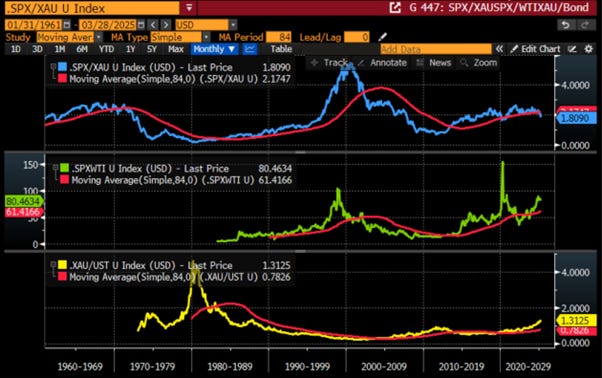
Debt, particularly government debt, plays a crucial role in how investors evaluate the business cycle. Savvy investors know they should own gold only when the quality of the best credit (i.e., government bonds) is in question. This refers to Alexander Hamilton’s famous quote that ‘A national debt, if it is not excessive, will be to us a national blessing’.
Indeed, investors turn to gold when counterparty risk emerges in the credit side of the economy, corresponding to the right quadrants of the four-quadrant grid, where bonds fail as a reliable store of value. This typically signals an inflationary environment, as has been the case for most economies since the start of the decade.

After World War II, with the U.S. imposing the USD as the global reference currency for countries wishing to trade with the world's largest consumption economy, U.S. Treasuries gained their status as a "risk-free" asset. While there were times when Treasuries underperformed gold, savvy investors had no doubt that the U.S. government would ensure Treasuries outperformed gold over the long term, as any country that wanted to be a trading partner of the U.S. would have to recycle its trade surplus into U.S. government debt. In simple terms, the market believed there would never be counterparty risk with Treasuries. However, when Ben Bernanke took over as FED chair in 2006 and implemented the "Great Moderation," which led to the 2008 financial crisis and later Quantitative Easing, investors began to doubt the effectiveness of U.S. Treasuries as a store of value. Building on Draghi's infamous "Whatever It Takes" quote, investors realized that credit risk would emerge on U.S. Treasuries. This trend was further amplified by the weaponization of USD assets in 2022, meaning that the U.S. fixed-income market would likely underperform gold in the future, as holding Treasuries was no longer safe for anyone contesting U.S. imperialism.
Gold to US Treasury Bond Index Ratio (blue line); 84-Month Moving Average of the Gold to US Treasury Bond Index Ratio (red line).

Interest rates exist to compensate lenders for future uncertainty. Negative real rates imply the future is more certain than the present, which is nonsensical, and signal governments’ intent to undermine the rentier class by ultimately not repaying debts. Owning bonds in such an environment is equally foolish.

Foreign holdings of U.S. Treasury debt, which steadily rose from 1970 to 2008, have been declining since the GFC, reflecting growing reluctance among international investors. This challenges the belief that U.S. debt will always be absorbed globally. Furthermore, the economic return on public debt has halved in the past decade, with every new dollar of debt generating less than 50 cents of GDP. Meanwhile, rising interest expenses now represent the second-largest budget item, highlighting fiscal limits and the inefficiency of higher taxes in addressing the deficit.

Put simply, in a world of negative or barely positive real yields, discounted cash flow analysis has become meaningless. It took some time to understand, but eventually it became clear that the "prices" on the left side of the Permanent Browne portfolio (i.e., contracts) could no longer be used to measure the "value" created by the right side (i.e., properties).

In this environment, savvy investors understand that the only assets worth owning are those with inherent value, regardless of market price. This means portfolios should focus on properties (equities and gold), as contracts (cash and bonds) are no longer effective for preserving wealth. In other words, avoid "contract" assets and focus on "ownership" assets, with gold as the ultimate store of value, something experienced investors in emerging markets know well in times of permanent monetary illusion. In this context, instead of valuing equities through discounted cash flow based on a risk-free asset, investors should use gold to measure the relative attractiveness of "efficiency value" (e.g., the S&P 500) versus "scarcity value" (gold). If the S&P 500 to gold ratio is above its 7-year moving average, U.S. equities are in a structural bull market. If it's below, as it has been since the "Disruptor in Chief" took office, U.S. equities are in a structural bear market.
Upper Panel: S&P 500 Index to Gold Ratio (blue line); 84-Month Moving Average of the S&P 500 Index to Gold Ratio (red line); Lower Panel: 12-Month Rate of Return of S&P 500 Index (yellow histogram).

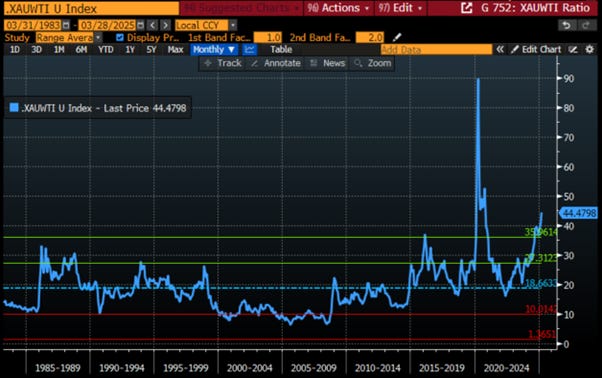
As the S&P 500 to gold ratio has fallen below its 7-year moving average, investors should brace for a potential stormy time in equity markets However, before rushing to their underground bunkers with gold bars; guns and canned food, they should note that while gold is outperforming the S&P 500, oil is not yet. The reality is that energy prices in the U.S. are still too low to expect a major bear market ‘Ursus Magnus’ anytime soon.
Upper Panel: S&P 500 Index to Oil Ratio (blue line); 84-Month Moving Average of the S&P 500 Index to Oil Ratio (red line); Lower Panel: 12-Month Rate of Return of S&P 500 Index (yellow histogram).

Indeed, savvy investors know that "big bad" bear markets have historically occurred when the return on invested capital fell sharply relative to the cost of energy. In fact, all the major U.S. bear markets in the last 65 years have occurred when the ratio between the S&P 500 and the oil price dropped below its 7-year moving average. These busts typically happened when both the S&P 500 to oil ratio and the S&P 500 to gold ratio were breaking down, signalling that the American economy was no longer transforming energy profitably. In other words, the marginal return on invested capital (ROIC) was falling relative to the rising costs of inputs, something anyone with common sense understands, as a modern economy should simply be viewed as energy transformed.
Upper Panel: S&P 500 Index to Gold Ratio (blue line); 84-Month Moving Average of the S&P 500 Index to Gold Ratio (red line); Middle Panel: S&P 500 Index to Oil Ratio (green line); 84-Month Moving Average of the S&P 500 Index to Oil Ratio (red line); Lower Panel: 12-Month Rate of Return of S&P 500 Index (yellow histogram).

With the S&P to oil ratio still more than 30% above its 7-year moving average, the U.S. equity market is still far from facing a "grizzly bear market." The difference this time is that the price of gold and oil have diverged more than ever, except for the flash crash during the COVID lockdown in March 2020.
Gold to Oil Ratio.
The question is why this discrepancy has opened up between the price trends of oil and gold, i.e. between the price of the current energy (oil) with that of stored energy (i.e. gold). The discrepancy between oil and gold price trends stems from the shift in how gold is viewed as a store of value. From the early 1980s to 2015, one ounce of gold bought 9 to 20 barrels of oil. Since 2015, that same ounce has bought 20 to 40 barrels. Before 2015, with the German bond market as a trusted store of value, gold was used to hedge property-related risks. However, since 2015, a new risk has emerged: the potential collapse of the Euro or USD, like the Zimbabwean Dollar. Gold still hedges against property valuation risks but now also offers protection against fiat currencies losing value or being confiscated, as the West increasingly weaponizes assets to enforce its policies globally.
In the past, major problems in industrial economies stemmed from the private sector, with factors like wars, revolutions, tax hikes, or price controls causing a plunge in ROIC. However, since the start of this decade, the issues lie with public institutions, as confidence from citizens and investors wanes. Since the start of the decade, governments have engaged in reckless spending on wars, DEI initiatives, and fiscal stimulus that don’t improve citizens' lives but serve to maintain a plutocracy in power. This is unsustainable and suggests that, in the coming months and years, major credit markets, especially in so-called ‘developed’ markets, could see prices fall to zero, either due to currencies becoming worthless or a sovereign debt crisis forcing governments to default.

In a nutshell, gold is now hedging not only a possible collapse in profitability but also a threat to the very existence of most fiat currencies. This shift in the role of gold, which occurred after Draghi's "Whatever it takes" promise and the FED’s Quantitative Easing to save Wall Street, is obvious to anyone who can read a chart.
Upper Panel: Gold to US Treasury Index Ratio (blue line); 84-Month Moving Average of the Gold to US Treasury Index Ratio (red line); Lower Panel: US 10-Year Yield (green line).

It should be clear to everyone that OECD bond markets have ceased to act as "reserves of value" since they are denominated in fiat currencies, whose values could theoretically go to zero. To halt the relentless price increases in all major currencies, a new store of value among contracts will need to emerge and that’s one of the reasons why gold price has consistently made new highs in all currencies including the Chinese Yuan and the Swiss Franc.
Gold price in USD (blue line); EUR (red line); JPY (green line) CHF (purple line); CNY (yellow line) since December 31st 2014.

As of today, China and its central bank PBOC is the only entity that could potentially replace the role of the FED and the Bundesbank. Contrary to the conventional wisdom in the western world, from 2014 until early the start of this decade, Chinese bonds in CNY were a proper store of value, only losing this status with the emergence of the Covid crisis in the Middle Kingdom
Gold to Chinese Government Bond Index Ratio (blue line); 84-Month Moving Average of the Gold to Chinese Government Bond Index Ratio (red line).

Today, with low long rates in China and high gold prices relative to energy, Chinese government bonds and gold remain the most antifragile assets of a global portfolio. However, with Trump, rather than Harris, becoming the 47th US president and ushering in "chainsaw" Austrian-inspired economic policies via the Department of Government Efficiency (DOGE), the risk is that US productivity could be boosted after an inevitable economic bust. If DOGE proves successful, this may lead to a potential correction in gold prices, bringing them back to historical norms in oil terms. Given that the success of DOGE remains uncertain and unlikely, gold continues to be an antifragile asset in the face of ongoing geopolitical tensions and "forever bankers wars," offering strong potential in the coming months and years..
Return of $100 invested in a portfolio invested in 50% in US government bonds and 50% in physical gold (blue line); 50% in Chinese government bonds and 50% in physical gold (red line); since December 31st, 2014.

In a nutshell, 'DOGE' isn't just a cryptocurrency or a fancy acronym used for propagandistic purposes; it also stands for Debt, Oil, Gold, and Equities, the four pillars that drive the business cycle, which cannot be changed by any policies, despite the mesmerizing propaganda spread by Malthusian Keynesians and their plutocratic cronies. Savvy investors understand that to preserve and grow their wealth, they must adapt to the business cycle rather than trying to change it. In this context, investors must focus on safeguarding their wealth by owning real assets like physical gold and silver, the only antifragile assets with no counterparty risk. Investors should also focus on Return OF Capital rather than Return On Capital, holding other commodities to weather the storm unleashed by the ‘Commodity Leviathan.’ Additionally, they will actively manage their cash allocation using a portfolio of short-dated, investment-grade (IG) USD bonds with maturities under 12 months and Treasury bills (T-bills) with maturities not exceeding 3 months. These income-generating assets will provide stability. Among equities, investors should continue favoring low-leverage companies with strong EPS and FCF growth, prioritizing energy and commodity producers over consumers. By doing so, investors will ensure both peace of mind and wealth preservation.
Investors will always remember Einstein's quote: "Two things are infinite: the universe and human stupidity, and I'm not sure about the universe." That’s why they will continue to hold a significant portion of their portfolios in gold and silver, the eternal hedge against collective stupidity and government hegemony, both of which remain abundant worldwide.

WHAT’S ON THE AGENDA NEXT WEEK?
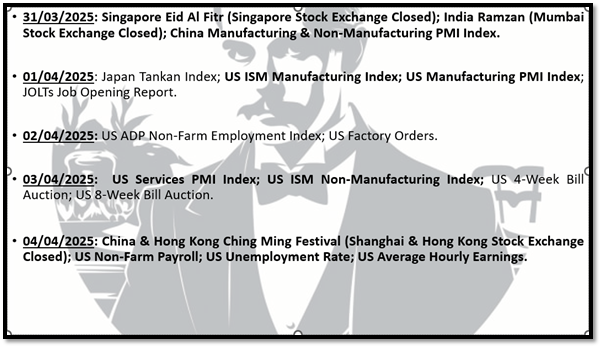
The first week of Q2 in the Jubilee Year will be a busy holiday week, with the Muslim world celebrating Eid Al-Fitr and the Buddhist world observing the Ching Ming Festival. Aside from some bank holidays across Asia, investor focus will once again be on PMI Manufacturing and Non-Manufacturing data from China and the US, as well as the US March Non-Farm Payroll report, the second since the ‘Disruptor in Chief’ entered the White House. While 12 S&P 500 companies will report earnings, none are significant enough to be major drivers for equity investors.
KEY TAKEWAYS.
As the Muslim world celebrates Eid Al-Fitr, the key takeaways are:
Flash PMI data signals a shift from 'Trump-Re-Flation' to 'Trump Stagflation,' as manufacturing contracts, sentiment weakens, and inflation pressures surge.
Core PCE inflation ticked up to 2.8% YoY, above estimates, before tariffs even kick in.
Despite being dismissed by the "Central Banker in Chief," consumer sentiment and inflation expectations are fuelling "stagflationary vibes."
The U.S. government's soaring deficit and record interest payments highlight a fiscal crisis, despite claims of efficiency savings.
The US Treasury, once considered the world's risk-free asset, lost its reliability after Quantitative Easing and the weaponization of USD assets for geopolitical purposes, introduced credit risk and making bonds and traditional valuation methods increasingly meaningless.
When the price of contracts can no longer be used to measure the value of properties, contracts become uninvestable.
Gold is the only asset that can measure the attractiveness of 'efficiency value' (i.e., equity) versus 'scarcity value' (i.e., gold).
With the S&P 500 to gold ratio dipping below its 7-year moving average, investors should prepare for potential market turbulence, but low energy prices suggest a major bear market is still unlikely.
The diverging trends between oil and gold prices highlight gold's evolving role as both a hedge against economic instability and a safeguard against the collapse of fiat currencies, as governments' reckless spending raises concerns of future defaults.
In such environment, investors will once again need to focus on the Return OF Capital rather than the Return ON Capital, as stagflation spreads.
Physical gold and silver remain THE ONLY reliable hedges against reckless and untrustworthy governments and bankers.
Gold and silver are eternal hedge against "collective stupidity" and government hegemony, both of which are abundant worldwide.
With continued decline in trust in public institutions, particularly in the Western world, investors are expected to move even more into assets with no counterparty risk which are non-confiscable, like physical Gold and Silver.
Long dated US Treasuries and Bonds are an ‘un-investable return-less' asset class which have also lost their rationale for being part of a diversified portfolio.
Unequivocally, the risky part of the portfolio has moved to fixed income and therefore rather than chasing long-dated government bonds, fixed income investors should focus on USD investment-grade US corporate bonds with a duration not longer than 12 months to manage their cash.
In this context, investors should also be prepared for much higher volatility as well as dull inflation-adjusted returns in the foreseeable future.
HOW TO TRADE IT?
The last full week of the third month of the Jubilee Year will be remembered for U.S. equity markets seesawing around their respective 200-day moving averages before ending the week in a renewed downtrend, as the prior week's relief rally failed to hold. With all major indices failing to close above their 200-day moving averages and continuing to make lower highs since the start of the Jubilee correction, investors may finally be realizing that the U.S. economy's shift from an inflationary boom to an inflationary bust is now inevitable, regardless of what Wall Street, the Fed, and their pundits claim. Unsurprisingly, the Dow Jones once again outperformed the S&P 500, Nasdaq 100, and the increasingly rebranded "Lagnificent 7." As stochastic indicators point to further downside around the so-called "Liberation Day," investors will closely watch whether U.S. equity indices find support at their early March lows, with the most likely support at their respective 38.2% Fibonacci retracement levels on a one-year chart. With stochastics overbought on a one-year horizon, all four major equity indices are expected to reverse last week's daily bullish reversal pattern within the next five days. Greater stability in the coming days and weeks will be necessary to confirm a tradable bottom. As of March 28, all major U.S. indices remain in weekly bearish reversals, with stochastics signalling another leg down is imminent.

In this context, Consumer Staples; Energy and Real Estate outperformed, while Communication Services and IT underperformed.

As of March 28th , 2025, the US remains in an inflationary boom, but with the S&P 500 to Gold ratio now below its year below its 7-year moving average for more than 2 months, an inflationary bust will materialize much sooner than Wall Street pundits and their parrots are eager to tell their clients. In this context, investors should stay calm, disciplined, and use market data tools to anticipate changes in the business cycle, rather than fall into the forward confusion and illusion spread by Wall Street.
As the US economy slowly shifts from the current inflationary boom to an inflationary bust, with a focus on return of capital over return on capital, investors will increasingly need to own antifragile assets in their portfolios. These antifragile assets, which should represent more than 70% of a diversified portfolio, should consist of 30% to 40% physical gold and silver, fossil energy producers (e.g., US energy stocks), and cash allocated to investment-grade corporate bonds with maturities under 12 months. While energy shares are not strictly antifragile, they will reasonably hedge a portfolio if energy prices rise, at least on a relative basis.
Performance of $100 invested in 50% in US government bonds and 50% in physical gold (blue line); USD Antifragile Portfolio (40% Physical Gold; 30% S&P 500 Energy Sector; 30% iBoxx USD Liquid Investment Grade Index) (red line) since 31st December, 2019.

Not only has this antifragile portfolio outperformed a portfolio equally invested in physical gold and US Treasuries since the start of the ongoing decade, but it has also provided a much better hedge against the stagflationary pressures that prevailed in 2022.
The remaining balance of the portfolio will be allocated to US companies with a strong moat, low-leveraged balance sheets, and a track record of sustainable EPS and FCF growth. These companies will be selected from sectors such as IT, Consumer Discretionary, Aerospace & Defense, Industrials, and Materials. As a sovereign debt crisis unfolds, investors should not forget that the risks are in contracts rather than properties and in particular the contracts issued by the government (i.e cash and government bonds).

If this research has inspired you to invest in gold and silver, consider GoldSilver.com to buy your physical gold:
https://goldsilver.com/?aff=TMB

Disclaimer
The content provided in this newsletter is for general information purposes only. No information, materials, services, and other content provided in this post constitute solicitation, recommendation, endorsement or any financial, investment, or other advice.
Seek independent professional consultation in the form of legal, financial, and fiscal advice before making any investment decisions.
Always perform your own due diligence.