


The Stagflation Ides Of March


What’s behind the numbers?
The second U.S. CPI data release for the Jubilee Year rose by 0.2% MoM, below expectations of +0.3% and January's 0.5% increase. The YoY increase reached +2.8%, missing expectations of +2.9% and slowing from January's +3.0%. Energy remained inflationary for the second consecutive month, as it was in January, the first back-to-back increase since last summer. Meanwhile, food price growth eased to its lowest monthly change since last August, and Core Services MoM saw its smallest increase since June last year.
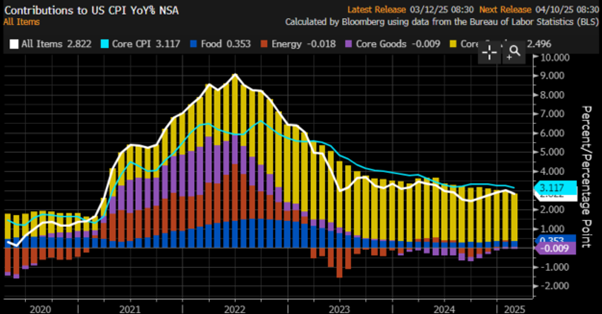
The core CPI rose by 0.2% MoM in February, below expectations of +0.3% and January's +0.4% increase. On a YoY basis, core CPI climbed 3.1%, missing forecasts of +3.2% and down from January’s +3.3%, marking the lowest YoY increase since April 2021. Core services, which make up 76% of the core CPI index, slowed from +3.28% YoY to +3.13%, while core goods remained deflationary YoY, though less so than in December and January. Notably, this marks the 57th consecutive month of MoM core CPI increases.

As an encouraging sign for those who still believe inflation has been defeated, Owners' Equivalent Rent (OER), a key measure of inflation persistence, rose by 4.4% YoY in February, down from 4.6% in January and marking its lowest yearly increase since February 2022.

Also encouraging for those who still believe inflation has been defeated, the SuperCore YoY change rose by 3.78% in February, down from 4.02% in January and its lowest yearly increase since October 2023. While a positive sign, it remains well above a level that would signal the end of the inflation fight, an outcome that should be unacceptable for a FED chair who claims to be committed to combating inflation for the good of the American people.

Market reactions.
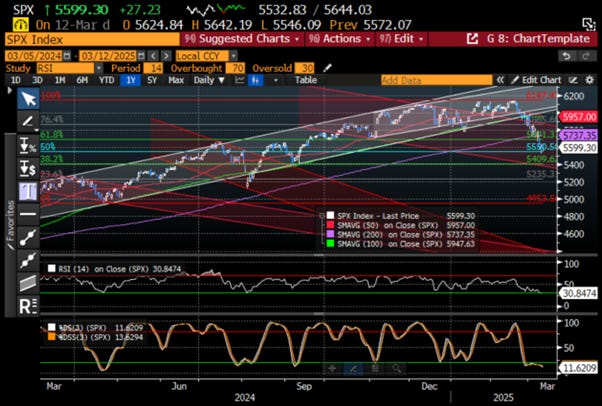
US indices posted gains in a choppy session, ultimately boosted by a soft US CPI report that eased some economic fears. However, concerns over US growth and tariff uncertainty continue to loom. A short squeeze drove Nasdaq’s outperformance over the S&P 500 and Dow Jones, yet all three indices remain below key technical support levels broken earlier in the week.
Gains were driven by growth sectors like IT; Communication Services and Consumer Discretionary, while defensive sectors such as Healthcare and Consumer Staples underperformed.

The lower-than-expected U.S. CPI data revived hopes that the impotent FED will cut rates further this year. Markets now price in nearly three rate cuts by year-end with a 79% probability, with the first cut of the jubilee year projected for June.

The dollar was mixed, with the DXY initially dropping post-CPI but later recovering before the U.S. close. While the softer-than-expected CPI fuelled rate-cut hopes, the impact was offset by U.S. tariffs on all steel and aluminium imports.

Gold remains in consolidation, trading within 1% of its all-time highs as investors gauge the impact of upcoming geopolitical developments in Eastern Europe and the Middle East.

After the cooler-than-expected CPI report, the US 10-year yield rebounded above its 200-day moving average (4.23%), resuming its uptrend. With markets bracing for the next phase of the reflationary path, new highs are expected in the coming months.

Thoughts.
The February CPI, the first inflation reports under the 47th U.S. president, may suggest inflation is tamed, but investors will note it was calculated before the implementation of a tariff-focused trade policy, one that will inevitably fuel the reflationary slow burn that began under the 46th president and will soon be rebranded as 'Trump-Re-Flation.' New inflationary policies, including higher tariffs and stricter immigration measures, are set to accelerate this trend. In this environment, investors should brace for rising goods inflation driven by import tariffs and persistent services inflation, which remains above 3% YoY due to labour constraints. This is already evident in the 'wisdom of the crowd' umbrella inflation index, which aggregates key U.S. inflation measures—including CPI, Core CPI, PPI, Core PPI, Core PCE, and 1-year Consumer Inflation Expectations—showing a YoY increase of 3.33% as of end of February. Notably, none of these six metrics is anywhere near the 2% target.
US Umbrella inflation Index (Average of CPI; Core CPI; PPI; Core PPI; Core PCE, 1-year consumer inflation expectations)

In this context, rather than sustaining the political illusion that the 2% inflation target is achievable within the next 12 to 24 months, or even beyond, investors, likely savvier than the thousands of PhDs at the Fed and Wall Street firms, understand that hitting 2% before the end of 2025 is highly unlikely, especially with the supposedly most beautiful word in the English dictionary (i.e., tariffs) still awaiting implementation in the coming months.
Anyone familiar with base effects can draw the following conclusions:
Returning to 2% inflation by the end of 2025 would require monthly CPI increases to average below 0.1% for the rest of the year.
If monthly inflation rises to 0.3% or higher over the next 12 months, as has been the case over the past three months, year-over-year CPI could reach between 4.0% and 6.3% by year-end. This scenario could force the FED to acknowledge its partisan driven policy misstep in easing during an inflationary boom in the U.S. economy.

Fate often strikes in times of triumph. Those who studied the evolution of the Roman Empire remember that as Julius Caesar made his last visit to the Senate on March 14, 44 BC, the Pontifex Maximus had conquered Gaul, defeated the great Pompey, and had just been proclaimed dictator for life. When Caesar’s corpse was carried out of the Senate, it bore 23 stab wounds from 60 senators, including from his adoptive son, Brutus. The triumphant bull market that prevailed until recently and the supposed ‘Trump rally’, which was propagandistically spread by Wall Street after November 5th, seemed invulnerable until recently. The reality is that, like the Roman Empire, bull markets do not die of old age, they get murdered. Looking at the trend in inflation data since the start of the decade, nasty inflation surprises have characterized the first half of the year, both at the headline and core levels. There is no doubt that, despite some still trying to convince people that tariffs will not be inflationary, the reality is that the sticky, slow-burn ‘Trump-Re-flation’ and the upcoming ‘Trump Stagflation’ has probably been the number one suspect in the murder of the magnificent bull market rally.
US CPI YoY Change (blue line); US CPI YoY Change Bloomberg Survey.

US Core CPI YoY Change (blue line); US Core CPI YoY Change Bloomberg Survey.

This negative trend in CPI data has also been characterized by a seasonal soft patch in economic data, as shown in the US Citi Economic Surprise Index. This soft patch, potentially more than seasonal, could be the initial trigger of the 'Stagflation Ides of March,' as tariffs and DOGE start impacting the US economy.
US Citi Inflation Surprise Index (blue line); US Citi Economic Surprise Index (red line) since December 31st, 2019.
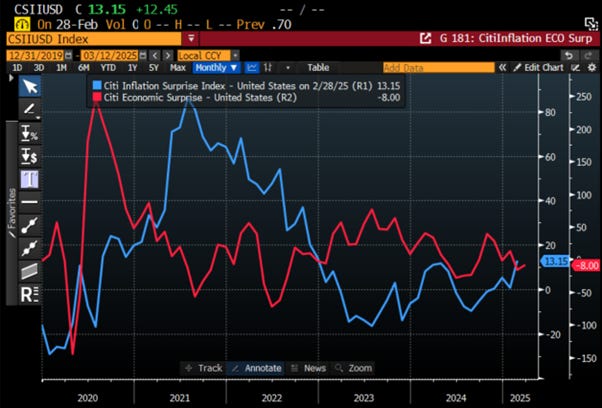
The Stagflation Ides can be measured by the difference between the US Citi Inflation Surprise Index and the US Citi Economic Surprise Index, forming what can be termed the ‘US Citi Stagflation Surprise Index.’ Savvy investors will recognize that a rise in this index has rarely been a good omen for equity markets.
US Citi Stagflation Surprise Index (blue line); S&P 500 Index (axis inverted; red line).

On the other hand, the Stagflation Ides have served as an additional tailwind for gold.
US Citi Stagflation Surprise Index (blue line); Gold Price in USD (red line).

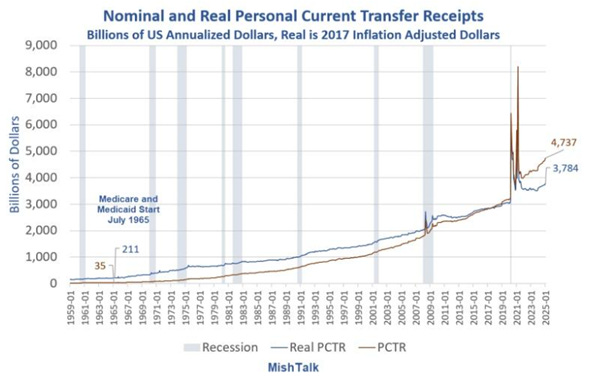
This comes at a time when Americans are increasingly dependent on government aid, worsened by rising benefits, inflation, and demographics. Neither party will fix this, as Congress is corrupt and lacks fiscal conservatives. Trump will inevitably push for more defence spending, using deals with Democrats. The impotent FED won’t solve anything either, as it fails to understand inflation and plays a role in fuelling asset bubbles. DOGE is a sideshow compared to the $4.74 trillion in Personal Current Transfer Receipts (PCTR) and the entire budget. As more PCTR is required to pacify the masses, with tariffs potentially acting as the tipping point, the inevitable burst of these bubbles will lead to civil unrest and the reshaping of the US into two or three separate countries.
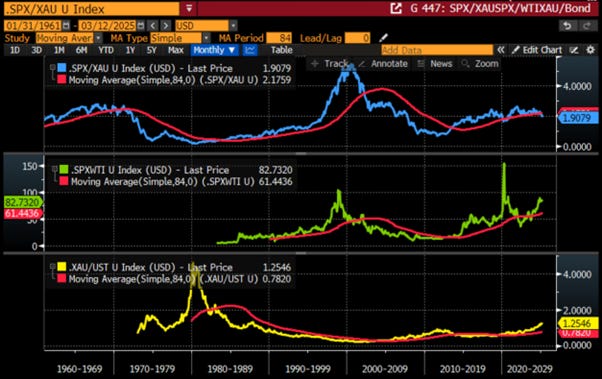
Investors know that government data always serve to spread the propagandistic agenda of those in power, regardless of political affiliation. The best way to gauge whether an economy is in an inflationary or deflationary stage is by monitoring the gold-to-bond ratio and its position relative to its 7-year moving average. With gold serving as the ultimate hedge against reckless government policies, the U.S. remains in an inflationary environment, as evidenced by the gold-to-U.S. Treasury ratio staying above its 7-year moving average since July 2019 and continuing to rise, despite political or economic rhetoric.
Upper Panel: Gold to US Treasury ratio (blue line); 84-month Moving Average of Gold to US Treasury ratio (red line); Lower Panel: Gold to US Treasury ratio 1 month rate of change (yellow histogram).

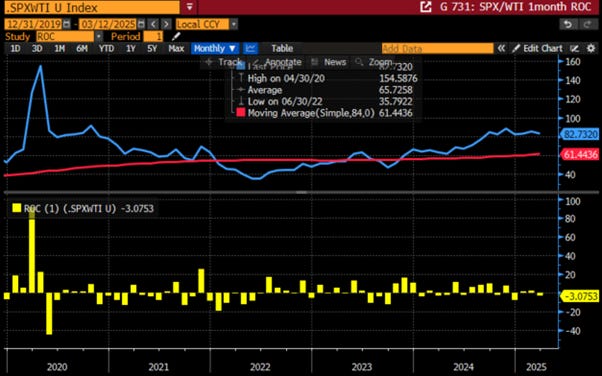
Looking at the best market indicator of economic health, the S&P 500 Index to Oil Ratio, it’s clear, even without a PhD in economics or being a Wall Street pundit, that the ratio tends to weaken in the second and third quarters, confirming the seasonal economic weakness of the business cycle.
Upper Panel: S&P 500 Index to Oil ratio (blue line); 84-month Moving Average of S&P 500 Index to Oil ratio (red line); Lower Panel: S&P 500 Index to Oil ratio 1 month rate of change (yellow histogram).
The misguided theories about tariffs and currency manipulation, dating back to the days when money was gold and silver, are as outdated as they are absurd as a way to solve the issues of imbalanced trade relationships. At the end of the day, inflation arises from three causes—shortages, demand, and lack of confidence, and in this context, tariffs, trade wars, and the threat of imperialistic behaviour from the U.S. will only exacerbate shortages and erode global confidence in public institutions, first abroad and ultimately in the US itself. The economy is and will always be the biggest factor in government approval. Trump will quickly lose support if his tariff measures lead to inflation, and you can forget it if he actually sent Americans back to the Middle East to satiate his colonialist property dreams.

Bottom line: Any savvy investor would recognize that those advising the 47th U.S. president lack a fundamental understanding of the global economy. The U.S. cannot thrive domestically while the rest of the world contracts under tariffs, leading to a crash-and-burn scenario. The key to global stability lies in 'mercantilist free trade,' and just as past wars and civil unrests drove inflation, holding hard assets like physical gold and actively trading equities, rather than relying on long-dated bonds, is the best strategy to preserve wealth amid structural inflation caused by supply shortages and imperialistic economic rhetoric. Those who still believe that tariffs and trade wars bring domestic prosperity while spreading poverty abroad will be remembered as the architects of their own nation's economic downfall.

Key takeaways.
The February CPI report shows that while core services and shelter inflation eased, rising goods and energy prices will keep inflation persistently sticky, even before tariffs and immigration policies further impact prices.
February's CPI confirms that the 'Trump-Re-Flation' is underway, as tariffs and labour constraints drive inflation higher, ensuring long-dated U.S. Treasury yields rise despite the 47th president’s push for lower rates.
With the American economy growing dependent on government handouts, the implementation of tariffs and DOGE will inevitably spark the 'Stagflation Ides of March.'
The 'US Citi Stagflation Surprise Index' signals trouble for equities but fuels gold’s ascent.
While the FED may downplay base effects, achieving 2% inflation by 2025 is becoming an increasingly phantasmagorical illusion.
Inflation stems from shortages, demand, and declining confidence, all exacerbated by tariffs and trade barriers that stifle free mercantilism.
In an inflationary bust, investors need to understand that protecting their wealth involves avoiding long-dated government bonds and focusing on a combination of equities from companies that can maintain pricing power with strong balance sheets and robust business models and physical gold as THE antifragile asset.
As stagflation rather than recession worsens in the next few months, investors should prepare their portfolios for HIGHER volatility.
Gold and silver are eternal hedge against "collective stupidity" and government hegemony, both of which are abundant worldwide.
In this context, investors should also remain prepared for dull inflation-adjusted returns in the foreseeable future.
With the S&P 500-to-gold ratio below around its 7-year moving average for more than a month, investors should remain aware that, while the US economy is currently in an inflationary boom, it may be only 6 to 9 months away from shifting into an inflationary bust (i.e., stagflation). STAGFLATION will be painful for investors who haven't prepared their portfolios for this scenario. In this environment, people will buy even less for even more, and it will be challenging for those still blindly following Wall Street's ‘Forward Confusion’ narrative of seeking refuge in long dated fixed income papers and government bonds. Physical GOLD remains the only antifragile asset to thrive during an inflationary bust.
Bottom line: As everyone knows, history shows that collapsing public confidence, fuelled by political instability and wars, leads to economic turmoil and this decade will be no different, as the ‘Trump-Re-Flation’, morphs into the 'Trump Stagflation,' which will force everyone, from billionaires to everyday citizens, to pay even more for even less.
To navigate the coming volatility, investors should favour low-leverage companies with strong EPS and FCF growth, prioritizing energy producers over consumers as the U.S. joins the global inflationary bust, soon known as 'Trump Stagflation.' In fixed income, avoid long-dated bonds, especially government debt beyond six months, and actively manage cash through sub-12-month investment-grade corporate bonds. Ultimately, replacing long-term bonds with more than 25% allocation to physical gold, silver, and hard commodities will provide antifragile protection, as scarcity premiums rise amid a looming sovereign debt crisis, first in Japan and Europe, then inevitably in the U.S., where the 47th president, like his predecessors, repeats failed policies while expecting different results. Indeed, everyone should by now know that consumers and businesses always lose amid trade wars. The tariff game has become tit-for-tat, with nations continually “retaliating” despite the reality that these measures are hurting their own economies.

If this research has inspired you to invest in gold and silver, consider GoldSilver.com to buy your physical gold:
https://goldsilver.com/?aff=TMB

Disclaimer
The content provided in this newsletter is for general information purposes only. No information, materials, services, and other content provided in this post constitute solicitation, recommendation, endorsement or any financial, investment, or other advice.
Seek independent professional consultation in the form of legal, financial, and fiscal advice before making any investment decisions.
Always perform your own due diligence.
great articulation! Unfortunately it usually ends with huge wars and revolutions. ....
Friends of mine tell me not to "Blackpill" them when I send them links to articles like these. These same friends thought I was crazy when I started buying gold at 1200/oz. As the bitcoiners say, "Have fun staying poor."