

Weaponizing The Economy


THE WEEK THAT IT WAS...
The last week of the first quarter of 2024 was a shortened holiday week due to the celebration of the Good Friday holiday. The focus was again on inflation expectations, consumer sentiment, and manufacturing data and tightening supply chains.
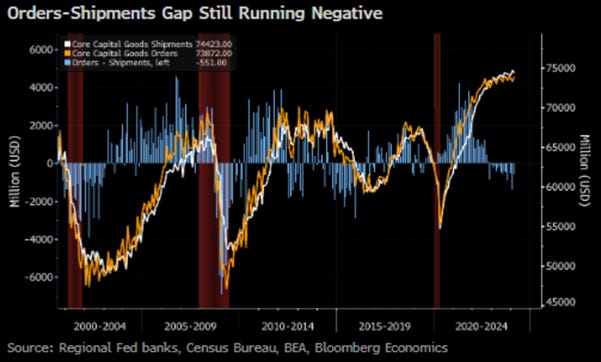
The latest US durable goods orders rebounded in February from the downwardly revised January collapse. On the bright side, core capital goods shipments, a figure used to calculate equipment investment in the government's gross domestic product report, continued their bounce back from YoY contraction in December. On the darker side, capital expenditure intentions remain bleak as manufacturers navigate higher input prices and a slowing economy.
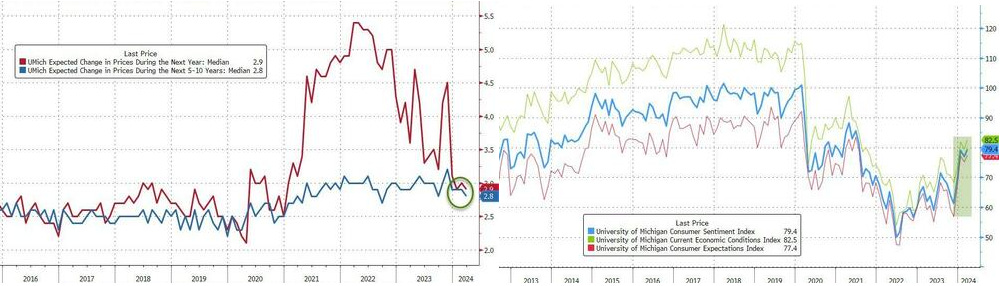
The final March University of Michigan inflation expectations saw a notable drop. 1-year inflation expectations fell from 3.0% in February and from 3.1% in the flash March data to 2.9% in the final report. At the longer end, inflation expectations declined to 2.8%. The headline sentiment index climbed to 79.4 from 76.5 earlier in the month, reaching the highest since mid-2021.
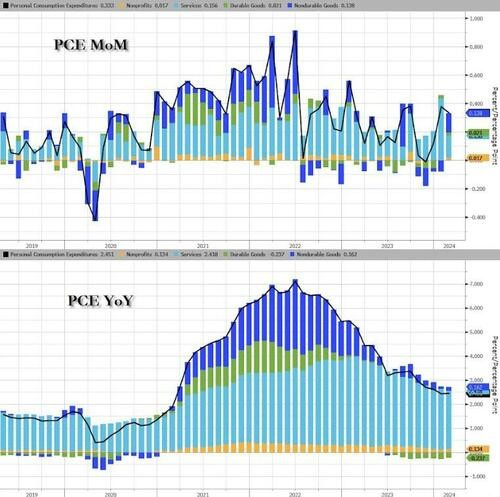
In February, both headline and core PCE inflation slowed to 0.3% month-over-month, aligning with expectations. However, year-over-year figures diverged, with headline PCE rising to 2.5% while core PCE fell to 2.8%. Powell's preferred 'supercore' inflation gauge, core services excluding housing rents, experienced a sharp decline to 0.2% month-over-month or 3.3% year-over-year.
In a "Good Friday" speech at the San Francisco FED, Jerome Powell reiterated that the US central bank is not in any rush to cut interest rates as policymakers await more evidence that inflation is contained. "The fact that the US economy is growing at such a solid pace, and the labour market is still very, very strong, gives us the chance to be a little more confident about inflation coming down before we take the important step of cutting rates," Powell said. Expectations for rate cuts continued to decline as the consensus may have begun to realize that the reacceleration of inflation by the summer will put the politically correct FED, which has been spreading 'Forward Confusion' since December, between a rock and a hard place.
Our more realistic scenario is that the FED will, at best, only be able to keep interest rates unchanged for the year, as stagflation rather than a soft landing emerges by the summer. Indeed, if not for political considerations, the FED should raise interest rates to combat the incoming stagflation driven by the side effects of ‘Bidenomics’. The question remains: for how long will the consensus continue chasing the infamous pivot, especially when Wall Street has been wrong on that matter for almost 2 years?

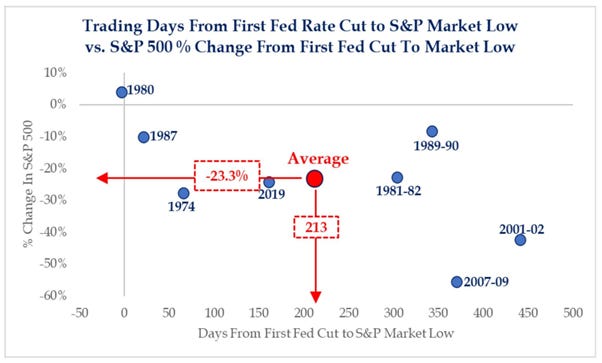
Even for those still hoping for a phantasmagorical FED rate cut in 2024, looking back at history, they should not be too excited about it. Examining FED rate cycles since the 1970s has revealed that investors have more to fear from the first cut in a cycle than the pause. On average, the S&P 500 is up +5% over 100 days between the last FED tightening and the first cut. The trough in the broader market is -23% over 200 days after the first cut in a series.
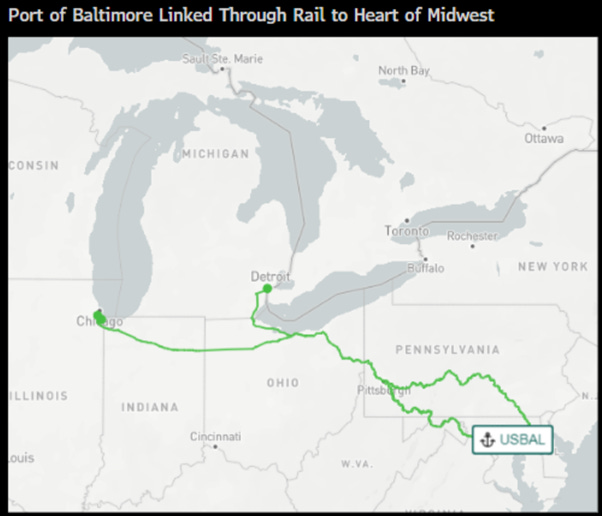
The main event of last week was likely the "black swan event" that occurred under the spring "wormy moon" when the Singapore-flagged vessel Dali destroyed the Francis Scott Key Bridge in Baltimore. Aside from the drama it brings for those who were on the bridge at the time of the collapse, this event will once again test the supply chains, which have already suffered from the Houthi attacks in the Red Sea and the drought in the Panama Canal. Baltimore is one of the 9th largest US ports, one of the major ones on the East Coast, and the top US roll-on-roll-off port. Baltimore handled 52.3 million tons of foreign cargo valued at approximately $80.8 billion, ranking ninth in the US for both metrics in 2023. Additionally, the port set a record with 1.1 million 20-foot equivalent unit containers. It also handled the most cars and light trucks in the US for the 13th consecutive year, totalling 847,158 vehicles, along with 1.3 million tons of roll-on/roll-off farm and construction machinery. The port was the second busiest for coal exports, with eight dry bulk terminals exporting 22 million tonnes of coal, as well as small amounts of other metals and minerals. Other top export commodities included liquefied natural gas, wastepaper, and ferrous scrap. Cove Point, the LNG terminal, typically exports about 500,000 tonnes per month. Baltimore is also the largest American port by volume for handling farm and construction machinery and agricultural products, with imports totalling 3 million tons last year, including sugar, salt, gypsum, fertilizers, and forest products.

Indeed, the port of Baltimore holds a geographic advantage over other larger ports on the East Coast—it is more inland and closer to the Midwest. This proximity is evident in the extensive train lines stretching from the port of Detroit (autos) and Chicago (farm equipment) to Baltimore.
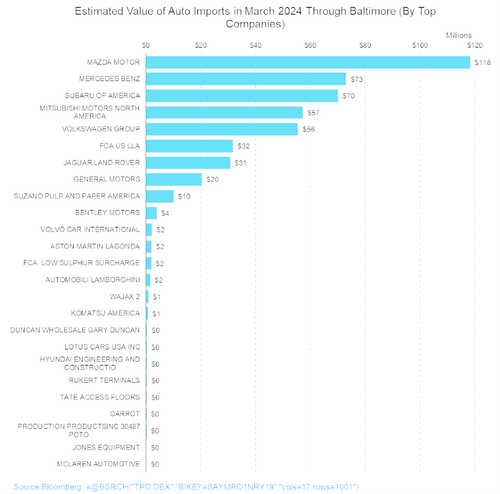
The disruption caused by the "black swan event" is expected to particularly affect US automotive supply chains, as Mazda Motor, Mercedes-Benz, Subaru of America, Mitsubishi Motors of North America, and Volkswagen Group have significant exposure to the port of Baltimore.
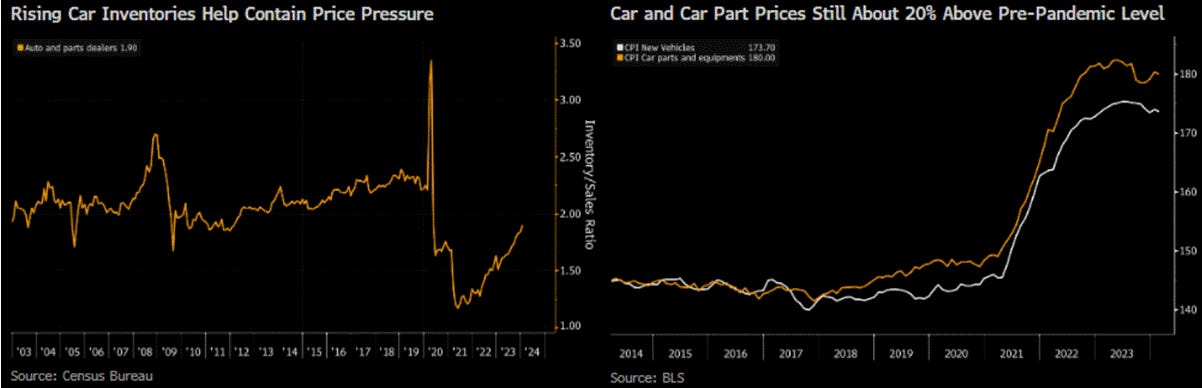
Investors will recall that the auto sector played a pivotal role in driving the "immaculate disinflation" narrative in 2023. However, with automakers in Detroit still grappling with significant increases in labour costs following the UAW strikes last year, the US imports approximately a fifth of the cars it consumes. The disruption to the auto trade will impede the progress of "car disinflation." Despite strides made in disinflation over the past year, new cars and car parts and equipment remain approximately 20% more expensive than before the pandemic.
Thus, while central banks spread "Forward Confusion" regarding the path of inflation in the coming months, historically, there has been a 6-month lag between the evolution of the NY Fed Global Supply Chain Pressure Index and the year-over-year change in US CPI.
NY FED Global Supply Chain Pressure Index (blue line); YoY US CPI change (red line).

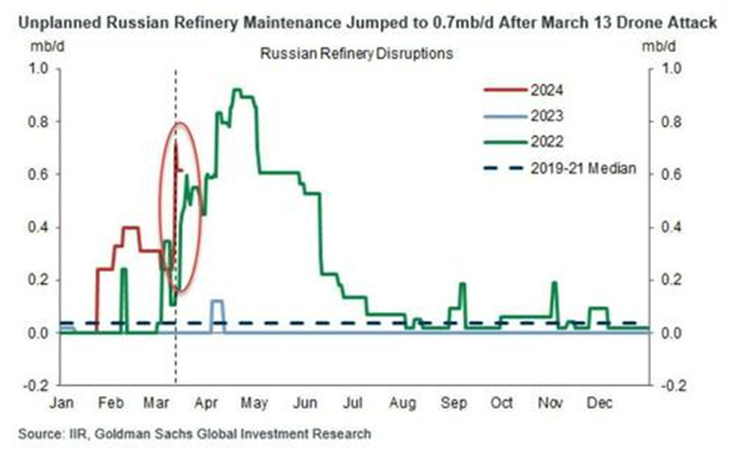
With rising geopolitical tensions and an outright war between Russia and NATO, the recent weeks have also witnessed a sharp rebound in oil prices, which have just reached a fresh 4-month high. The wave of drone strikes on Russian crude-processing facilities began in January, reflecting Ukraine's full intention to cripple the fuel supply that funds Moscow's war machine.

These drone strikes, some deep within the country's territory, have led to a surge in "unplanned Russian refinery maintenance." As a consequence, Russian diesel exports have been declining for weeks following the drone attacks on Russian refineries that began in January.
India, previously benefiting from purchasing discounted Russian crude oil in Rupees and Rubles due to the war in Ukraine, halted acceptance of Russian crude delivered by Sovcomflot-operated tankers last week. Tightened US sanctions enforcement disrupted India's significant oil trade with Russia, prompting refiners to seek costlier alternatives, notably from the US. About 1.5 million barrels of Urals crude were shipped so far on Sovcomflot vessels in March, down from 4.4 million barrels in January and 4.7 million barrels in February.

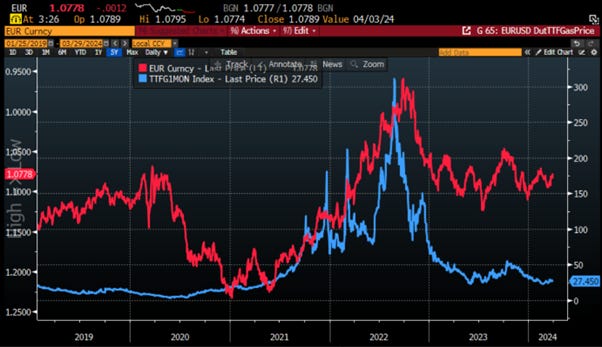
For Europe, the recent escalations in the conflict between Russia and Ukraine have resulted in the European gas price appearing to form a double-bottom around the EUR25.0 per megawatt-hour level. For investors, aside from being another headwind for the European economy, which has already entered the inflationary bust phase of the business cycle regardless of the ECB rhetoric, it will lead to a weaker EUR over time. This depreciation will be inflationary and will also pose additional challenges for those in charge in Brussels and Frankfurt ahead of the European parliamentary elections in June.
Dutch TTF Natural Gas Forward 1 month (blue line); EUR/USD FX rate (axis inverted; red line).
As the war in Ukraine rages on, Russia has gained significant momentum, outproducing NATO allies in weaponry due to stalled US funding. With extra-legal attacks on energy chokepoints becoming normalized, there's a risk of inadvertent escalation, potentially leading to outright war between NATO and Russia. Few investors are prepared for such escalations while in the meantime Ukrainians has been targeting Russian refineries and possibly starting a war of terror as the recent events in Moscow indicate. In this context, the weaponization of crude oil could trigger a major financial shock globally, akin to the 2007-2008 Global Financial Crisis. Moving to the Middle East, Iran's preparations for an 'oil war' add to these risks, as adversaries in the region may weaponize energy.
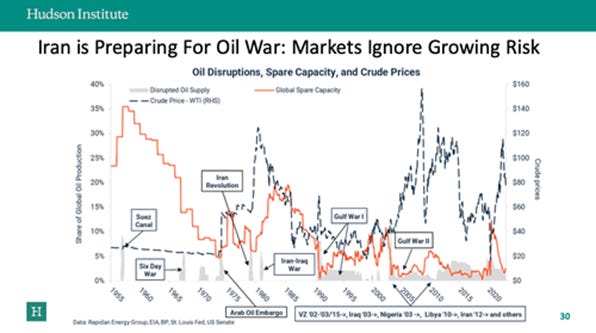
The key question is no more if but when Iran and Russia will employ oil as an economic weapon against the West and spread social unrest in the US ahead of the November Presidential election.
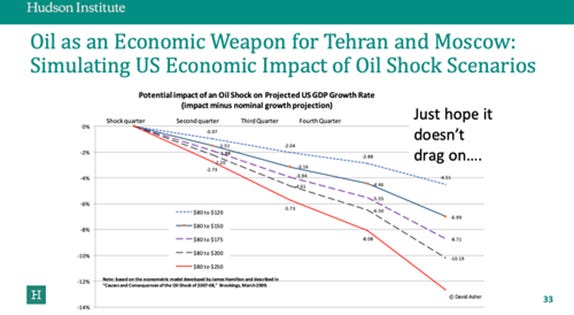
The history books remind investors that the 1973 oil embargo reshaped the global energy market, geopolitics, and the economy, with inflation soaring to 12% after a brief celebration over lower rates. Recent events in Moscow highlight the vulnerability of major oil producers like Saudi Arabia. With the risk of a 1970s-style stagflation explosion looming, today's economic landscape mirrors that of the 1970s-1980s. While fiscal measures and high-net-worth spending have delayed recession, they've also heightened the certainty of inflation in a multipolar world. A geopolitical oil shock, adding to the inflationary pressures of War, could catalyse another global financial crisis akin to the 2008 recession triggered by an oil shock.

The good news, compared to previous periods of weaponized oil, is that US crude production is now exceeding 13.0 million barrels per day.
US oil production.
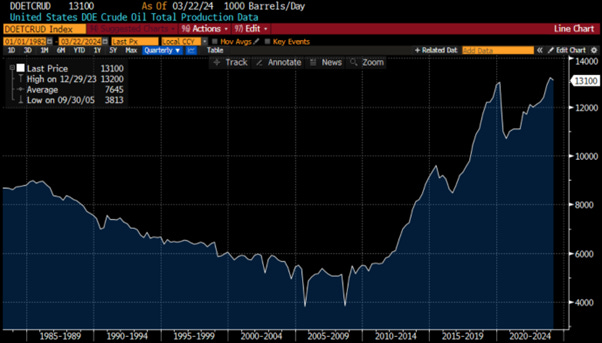
The bad news is that radical climate change warriors in the White House have depleted the SPR and hindered the ability to expand refining capacity. Additionally, recent M&A activity in the US shale patch has resulted in stricter capital expenditure policies. Despite expectations for US oil production to continue increasing while OPEC+ reduces its own, pipeline-implied US L48 crude production has declined by nearly 0.4mb/d since December, reaching 12.6mb/d, with a 160kb/d week-on-week drop according to Genscape data (14DMA). Furthermore, the 3-month moving average of US crude production growth has slowed to 550kb/d YoY, with weakness observed in the Gulf of Mexico.

Therefore, a perfect storm of higher crude prices continues to brew as the world's refineries have become major targets. With all eyes on the Middle East, investors should consider the longer-term perspective. BRICS and their newly joined members accounted for 14.2% and 25.4% of total oil output in 2023, respectively. This suggests that in the emerging bipolar world, outside the US, which is self-sufficient in its oil consumption, its allies may increasingly rely on united BRICS members for their energy supply.
Share of World Crude Oil Exports in 2023.
Not only has supply driven oil prices higher, but also China's January-February activity data exceeded market expectations. Industrial production growth edged up during this period, contrary to market expectations of a slowdown.

Among energy commodities, it's not just oil that has been rising recently. After a pullback lasting roughly four months, the price of uranium futures appears to have hit a bottom and remains significantly above last year's average levels. Investors are turning their attention to uranium's future, driven by an increasing supply shortage and higher demand as nations seek nuclear energy solutions to combat climate change. This interest is underscored by supply warnings from Canada's Cameco and Kazakhstan's Kazatomprom, the leading producers responsible for half of the worldwide uranium supply. Kazatomprom forecasts a significant supply deficit, escalating from 21 million pounds in 2030 to 147 million pounds by 2040.
Outside of oil and uranium, the Russia/Ukraine/NATO war has underscored the urgent need for greater food and energy security among the US, Europe, and Asia. Russia is the second/third largest producer of natural gas and oil, while Ukraine ranks fourth/fifth in maize and wheat production. The pandemic, war, and deglobalization have all contributed to higher inflation and bond yields. However, they have also served as catalysts for economic growth in the US, Europe, and Asia. Governments are investing in defense spending, imposing tech restrictions, and enhancing domestic supply chains to ensure the security of food, energy, and technology supply chains in the 2020s.

This is not to mention the cocoa supply-driven hyperinflation that emerged just in time for Easter. The cocoa market has been suffering from poor harvests due to adverse weather conditions and crop diseases across West Africa, the world's top cocoa-growing region. In addition to the weather challenges, countries like Ghana, the world's second-largest cocoa grower, are poised to lose access to a key funding facility due to a crisis in its cocoa crop, leaving it without enough beans to secure financing.

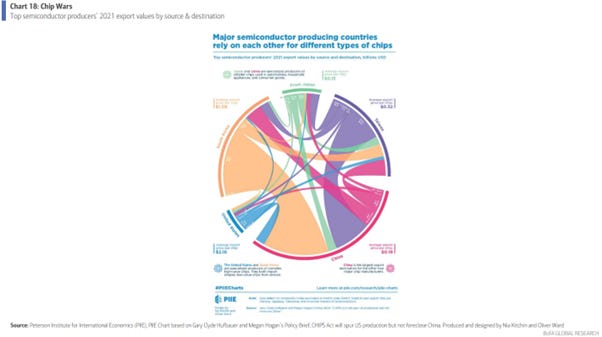
Similar to food and energy, semiconductors—essential components of modern technology, particularly artificial intelligence—have become a major focus of economic protectionism. In August 2022, the US passed the CHIPS Act to boost domestic chip production and expanded restrictions on chip exports to China in October 2023. Major semiconductor producers such as Taiwan, the US, Japan, South Korea, and China have historically relied heavily on each other for different types of chips, with China being a significant importer. In 2021, South Korea exported $90 billion worth of chips to China, Taiwan exported $52 billion, the US exported $13 billion, and Japan $12 billion. Tech and semiconductors have now become tools of geopolitical policy, with technology being considered a national security sector for advanced economies.
Investors should bear in mind that Europe has a long history of conflict, with the Russia/Ukraine NATO war being just one of many, marking the 487th military conflict in Europe over the past 2000 years. With Europe's increasing dependence on China and the US for security, as well as on Russia for energy, capital outflows are likely to accelerate once again in the coming months as geopolitical tensions on the ground worsen.

The decision of the European Union to seize the profits from frozen Russian assets and to use them to finance the war economy to support Ukraine shows that once again incompetent politicians are taking decisions which are opening a new pandora box and will threaten the stability of the European financial system outside the challenges created by the current conflict.

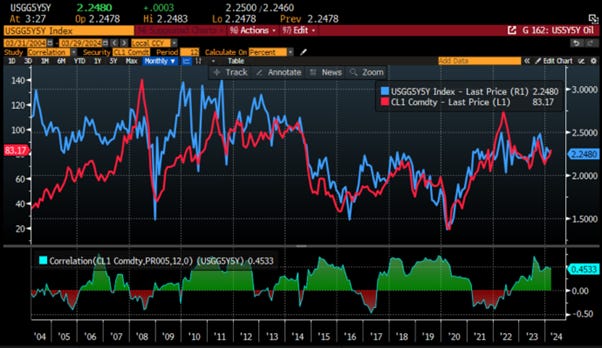
Despite surging oil and other commodity prices, US Treasury yields have not risen due to inflation expectations, but rather because of a steady increase in depressed bond term premia. However, the return of the oil factor suggests an imminent rise in both consumer and investor inflation expectations. Interestingly, the US five-year five-year forward inflation expectations rate has remained steady, reflecting levels seen in May 2023 when WTI prices were at $70. Yet, considering the historical correlation between crude oil prices and the 5-year 5-year forward rate, consistently above 0.5 since 2011, an uptick in investor inflation expectations is foreseeable. This is expected to propel nominal rates even higher in the coming weeks.
US 5-Year 5-Year Forward Breakeven (blue line); WTI price (red line) & Correlation.
Elevated oil prices are likely to present greater challenges for the FED and other central bankers than the market currently expects. If the recent reversal in the Oil to Equity ratio continues over the next few months, it would indicate that the so-called 'disinflationary miracle' has indeed come to an end.
WTI to S&P 500 ratio (blue line); US CPI YoY change (red line); US Recession & Correlation.

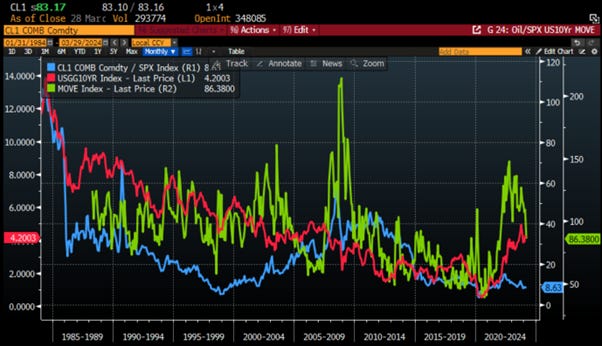
For fixed income investors, a rebound in this ratio has historically foreshadowed higher US 10-Year Yields and increased volatility in the bond market.
WTI to S&P 500 ratio (blue line) versus US 10-Year Yield (red line) & ICE BofA Bond Implied Volatility Index (MOVE) (green line)
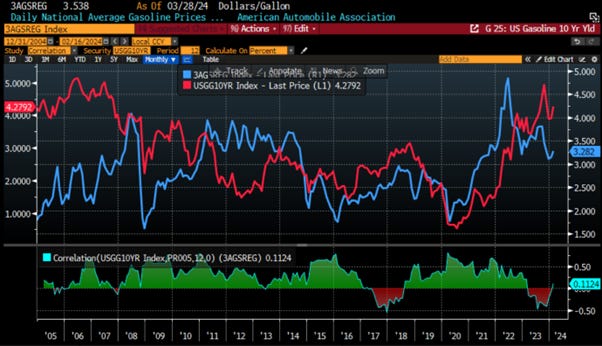
Elevated oil prices have already translated into higher gasoline prices, and this, in turn, is expected to provide further momentum for US 10-Year Yields to surge even higher.
US Daily National Average Gasoline Price Regular (blue line) & US 10-Year Yield (red line) & Correlation.
This implies that bond bulls, who argue that the next move is a drop in long dated yields, could face renewed challenges in light of the new reality of sustained higher inflation pressures. The FOMO trade of missing the pivot is perfectly depicted in the continued rise of the outstanding shares in the iShares 20+ Year Treasury Bond ETF (TLT US), which have continued to increase year-to-date despite a 3.7% decline during the same period. This suggests that the ‘’dumb money’’ is still chasing duration while the US is about to enter the ‘inflationary bust’ phase of the business cycle.
iShares 20+ Year Treasury Bond ETF (TLT US) (blue line) & iShares 20+ Year Treasury Bond ETF (TLT US) (histogram).

For equity investors, the recent surge in oil prices suggests that the energy sector, which has been overlooked by the consensus, is poised to outperform the still favored tech sector in the coming months.
Relative performance of S&P 500 Energy index to S&P 500 IT index (blue line) & WTI price (red line) & Correlation.

It's not just oil that has seen an upward trend over the past quarter; copper prices have also rebounded to new highs. Copper appears to be undervalued at its current levels, as the deviation from its historical correlation with the US 10-year yield observed since the start of the year is not expected to persist much longer.
LME Copper Price (blue line) versus US 10-Year Yield (red line).

Lastly, despite the recent surge in oil prices, the gold-to-oil ratio remains at its highest level since December 2022. In a world where BRICS countries seek to establish the new MOS (Monetary Operating System) potentially anchored in Gold, we can expect some stability in the Gold to Oil ratio. Consequently, a return to the mean can be anticipated in the near future, suggesting that Saudi Arabia and Russia may be targeting at least another 10% to 15% increase in the oil price in gold terms.
Gold to Oil ratio & US Recessions.

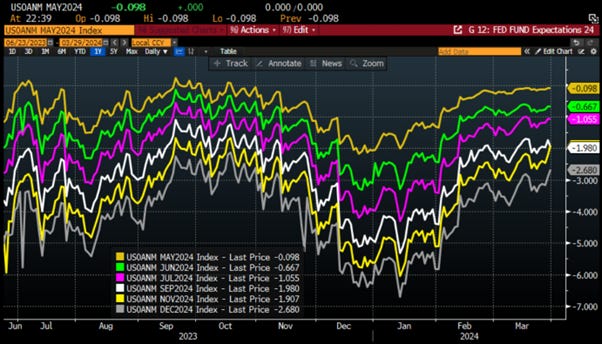
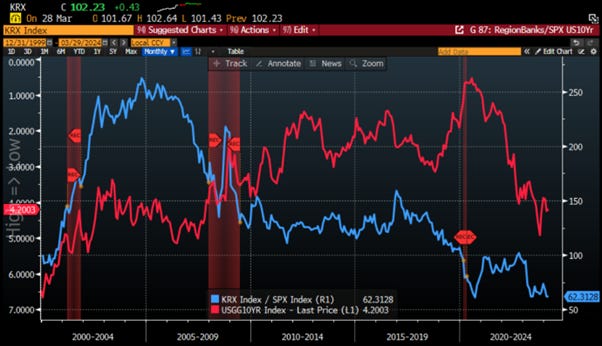
Where does that leave us? The anxious bond market is now pricing in just a 66% odds of a rate cut in June and 268 basis points of rate cuts in 2024. Connecting the dots, higher oil prices and higher inflation expectations are causing concern. US regional banks need rate cuts to avoid a repeat of the crisis similar to the one experienced in spring 2023. However, wars; social unrests; rising commodity prices and supply chain disruptions are unlikely to allow the FED to cut rates at all in 2024 which will push US regional banks into another crisis sooner rather than later.
Relative performance of Regional Bank index to the S&P 500 index (blue line); US 10-Year Yield (axis inverted; red line).
WHAT’S ON THE AGENDA NEXT WEEK?
The first week of the second quarter will see a focus on PMI data in China; Europe and US and updates on the US job market, including the release of the March Non-Farm Payroll report on Friday. In Asia, it will be a shortened holiday week due to the Ching Ming Festival, with China closed on Thursday and Friday, and Hong Kong closed on Monday for Easter Monday and Thursday for the Ching Ming Festival. European markets will also be closed on Monday for the second leg of the 4-day Easter weekend.

KEY TAKEWAYS.
As the first quarter of the year unfolds, here are the key takeaways:
The February Core PCE met expectations, but the impact of increasing commodity prices and tighter supply chains still needs to be considered.
In his ‘Good Friday’ speech, Powell reiterated that the FED is ‘data dependent,’ and the data are indicating HIGHER NOT LOWER inflation ahead.
The black swan event at the port of Baltimore will exacerbate supply chain pressures, fuelling the return of the inflation boomerang by summer.
After weaponizing USD assets, recent developments in the Russia-Ukraine war suggest a move towards weaponizing oil.
Weaponized oil may have less impact than in the 1970s, given that the US has become one of the largest oil producers globally.
Apart from oil, natural gas prices in Europe and uranium prices have indicated signs of a bottom, putting pressure on inflation to rise.
Rising agricultural commodity and copper prices will also contribute to increased inflation in the coming months.
As the economy becomes weaponized, the world is on the verge of an inflationary bust.
For fixed income investors chasing the duration trade, more pain awaits as long-dated yields must reflect the new reality of stagflation.
For equity investors, with an inflationary bust ahead, the best way to protect their wealth is to own the equity barbell portfolio made of Tech and Energy and Physical Gold.
As stagflation rather than recession materializes in the next few months, investors should prepare their portfolios for HIGHER volatility.
In this context, investors should also remain prepared for dull inflation-adjusted returns in the foreseeable future.
HOW TO TRADE IT?
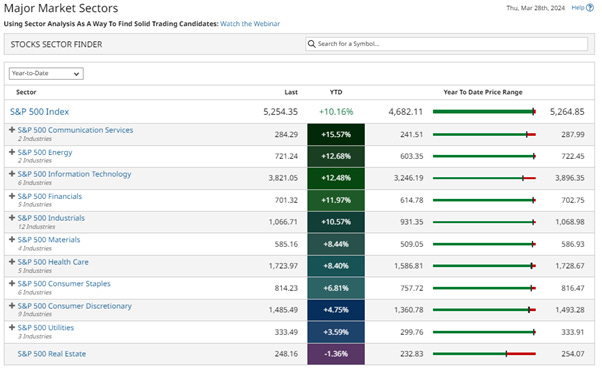
The first quarter of the year ended positively for equities, with the S&P 500 closing just 10 points below its all-time high. With a 10.2% gain year-to-date, it marks the S&P 500's best start to the year since 2019. Interestingly, the S&P 500 has outperformed the Nasdaq on a year-to-date basis for the first quarter, with stocks recording their fifth consecutive green month and being up for 18 of the last 22 weeks, a pattern not seen since 1989.
Surprisingly, the best-performing sector in Q1 was not tech, but Energy, with Real Estate being the only sector in the red for the quarter. In March alone, Energy stocks surged by 10%, while Tech remained unchanged.
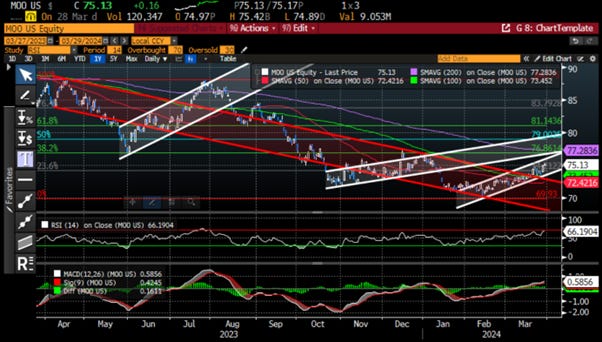
As volatility is expected to rise, investors are cautioned to remain vigilant in their asset allocation. It's advisable to avoid long-term government bonds and maintain some cash ‘’dry powder’’. To capitalize on supply chain constraints in the agriculture commodities sector, investors may consider the VanEck Agribusiness ETF (MOO US). This ETF invests in large and mid-cap companies engaged in various aspects of the agricultural industry, including agri-chemicals, animal health, fertilizers, seeds and traits, farm equipment, aquaculture, livestock, cultivation, plantations, and trading of agricultural products.

The top 10 holdings of the ETF are primarily based in the US and largely associated with the industrial and materials sectors.

Following the recent bounce above the 23.6% Fibonacci Retracement level ($74.21), this level is expected to serve as a compelling support for long-term investors in the industry.
At The Macro Butler, our mission is to leverage our macro views to provide actionable and investable recommendations to all types of investors. In this regard, we offer two types of portfolios to our paid clients.
The Macro Butler Long/Short Portfolio is a dynamic and trading portfolio designed to invest in individual securities, aligning with our strategic and tactical investment recommendations.
The Macro Butler Strategic Portfolio consists of 20 ETFs (long only) and serves as the foundation for a multi-asset portfolio that reflects our long-term macro views.
Investors interested in obtaining more information about the Macro Butler Long/Short and Strategic portfolios can contact us at info@themacrobutler.com.
Unlock Your Financial Success with the Macro Butler!

Disclaimer
The content provided in this newsletter is for general information purposes only. No information, materials, services, and other content provided in this post constitute solicitation, recommendation, endorsement or any financial, investment, or other advice.
Seek independent professional consultation in the form of legal, financial, and fiscal advice before making any investment decisions.
Always perform your own due diligence.