


Why Neither 'Kamunism' Nor 'Drill Baby Drill' Should Worry Oil Bulls…


THE WEEK THAT IT WAS...
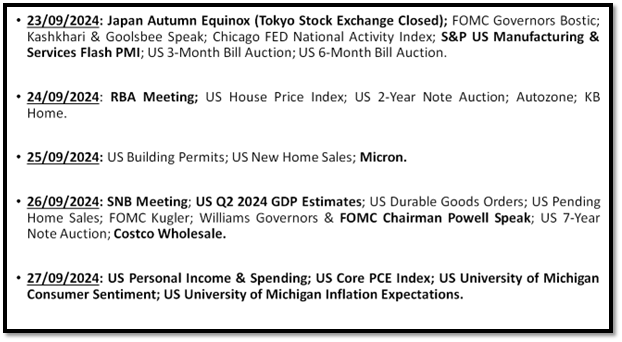
The last full week of the third quarter was marked by speeches from FOMC governors, with the most uneventful one being from FOMC Chair Jay Powell. The week also featured the release of flash estimates for the US Manufacturing and Services PMI indices, along with the latest estimate of second-quarter US GDP, and the release of the Core PCE Index.
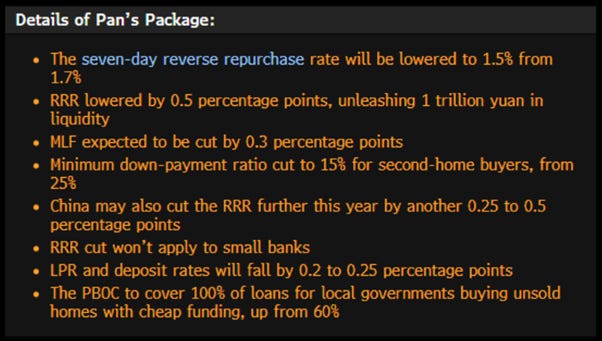
In a surprising move that defies the Taoist patience expected to be required to see significant stimulus supporting the Chinese economy, the PBOC announced a 0.5% cut in the RRR rate, unleashing CNY 1.0 trillion in liquidity, while also cutting the 7-day reverse repurchase rate from 1.7% to 1.5%.

Simultaneously, the Chinese government also announced a long list of measures aimed at finding a more orderly solution to the real estate crisis that has plagued the domestic economy for more than a year.
During an extraordinary meeting of the politburo, the Chinese government announced an aggressive plan to issue 1 trillion yuan (around $284 billion, approximately 3% of China's GDP) in special bonds, primarily aimed at stimulating consumption. Part of the proceeds raised through these bonds by the Ministry of Finance will be used to increase subsidies for the trade-in and renewal of consumer goods, and for upgrading large-scale business equipment. The funds will also be allocated to provide a monthly allowance of around 800 yuan ($114) per child to households with two or more children. An additional 1 trillion yuan will be raised via a separate special sovereign debt issuance, with plans to use the proceeds to help local governments address their debt issues. Lastly, China is also considering injecting up to 1 trillion yuan of capital into its largest state banks to enhance their ability to support the struggling economy.

While these measures will inevitably improve consumer sentiment, investors must understand that China has long redirected its economic growth from real estate to the industrial sector, where it aims to emulate international champions. The goal is not only to offer better quality and cheaper products than those provided by American and European firms but also to conquer new markets across the Global South and beyond.

Ultimately, Xi understands that to Make China Great Again, China must be the leader in key industrial sectors such as manufacturing and technology. Investors should also remember that any Chinese stimulus will inevitably be inflationary for the rest of the world, as it will increase demand in a global environment still dominated by supply shortages.
https://www.hartenergy.com/exclusives/chinas-stimulus-could-reignite-fuel-demand-long-term-210539
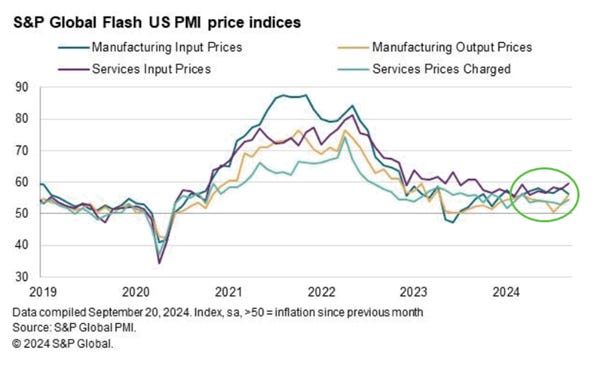
While investors are still digesting the 'Powelian' 50-basis point cut in September, the flash estimates of the US PMI indicated further economic deceleration ahead, as both Services and Manufacturing PMI fell in September. The data continues to show a sharp dichotomy between manufacturing and services. The S&P Global US Manufacturing PMI declined to 47.0, below the expected 48.6 and August's 47.9, marking the lowest level since June 2023. Meanwhile, the S&P Global US Services PMI fell to 55.4, below August’s 55.7 but slightly above the expected 55.2, reaching a two-month low.

Adding to the ‘inflationary bust’ narrative, prices charged for goods and services are both rising at the fastest rate in six months, with input costs in the services sector, driven largely by wages and salaries, climbing at the fastest rate in a year.
The FED's preferred inflation indicator, Core PCE, rose less than expected on a monthly basis, but on a yearly basis, as the disinflationary base effect fades, Core PCE increased from 2.6% to 2.7%, in line with expectations and the highest since April. On a positive note for those who believe the inflation problem is behind us, though anyone with common sense knows it is not, the headline PCE fell to +2.2% YoY, the lowest since March 2021. However, highlighting that inflation remains a persistent issue, the so-called SuperCore PCE re-accelerated in August to +3.29% YoY, well above the now-abandoned 2% FED target.
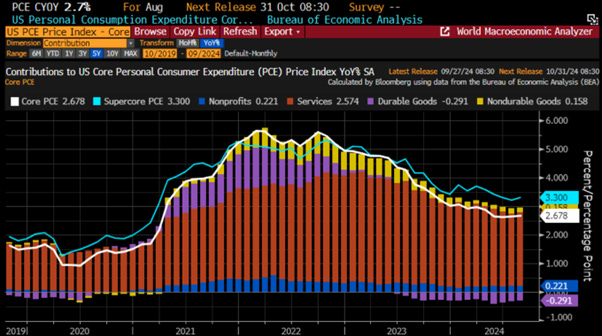
Adding to inflationary driven misery, both income and spending rose less than expected in August, with income showing its smallest month-on-month increase since July 2023, and spending matching its lowest growth since January 2024.
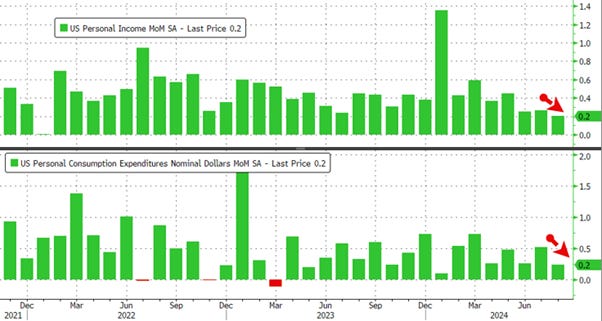
However, as the USA transitions into ‘United Socialist America,’ and with nearly a month until the showdown of the year of political hell, it’s unsurprising that since January, transfer payments related to government social benefits to consumers (and ultimately voters) have surged on a hyperbolic trend.

At the opening of the Federal Reserve Bank of New York's annual conference, FED Chair Powell had the opportunity to express his opinions for the first time since his ‘Powellian’ 50 basis points cut. However, he chose not to address monetary policy, instead reflecting on the evolving importance of the US Treasury market, its liquidity, and the cooperation between agencies since the 2015 ‘flash crash,’ while emphasizing the ongoing discussions about maintaining its efficiency and stability.
As more data point to the US heading toward an inflationary bust (i.e., stagflation) rather than a disinflationary bust (i.e., recession), Wall Street consensus still dreams of at least three rate cuts (76 basis points) by year-end, well above what the partisan, politically driven FED indicated in its latest dot plot. The irresponsible policy from a politically driven FED will inevitably bring back the inflation boomerang once the political circus around the White House is over. Seasoned investors remember that inflation-driven misery stems not from the FED, but from reckless regulations imposed by politicians pushing to ‘build back better’ for the kleptocrats and kakistocrats of the world. In this context, whether the FED cuts rates remains almost irrelevant; the real issue is stopping those who mismanage the economy under the pretence of climate change and DEI while fuelling forever bankers’ wars to enrich their plutocratic allies. Regardless of who occupies the White House next, Powell and his PhD colleagues know that interest rates always rise during wartime. The misguided Wall Street bankers will once again be wrong in thinking rate cuts will solve economic problems, which will only worsen under ‘Kamunism.’
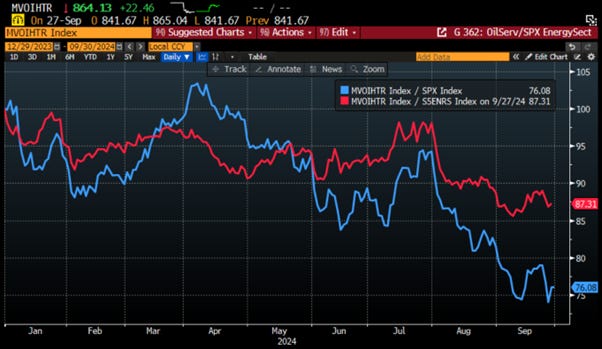
While the war cycle has intensified, from the Ukraine-Russia special operation to bombing in the Middle East, those expecting a rise in oil prices due to these geopolitical events have so far been disappointed, as these conflicts have barely translated into a geopolitical premium. In short, 2024 has hardly been a favourable summer for investors in the energy sector.
Performance of $100 invested as of December 29th, 2023, in WTI (blue line); S&P 500 Energy Index (red line); MVIS US Listed Oil Services 25 Index (green line).
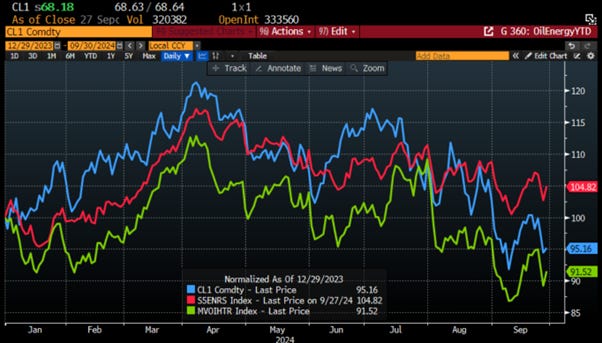
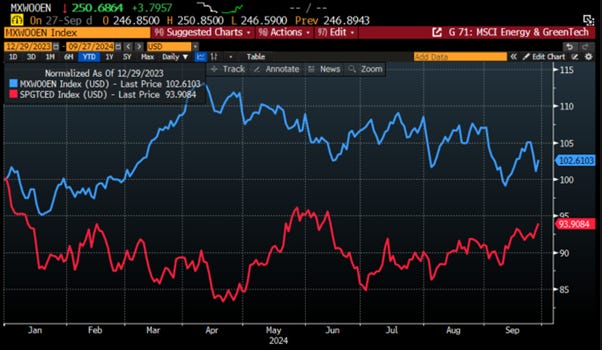
Before any green zealots get too excited, thinking that the poor performance of the oil & gas sector has benefited those who religiously believe in the ‘climate change scam’, which is supposedly solved by replacing fossil fuels with fantastical energy production from ‘magical mirrors’ and ‘windmills’, they will take note that the S&P Global Clean Energy Index has actually performed worse than the MSCI World Energy Index on a year-to-date basis.
Performance of $100 invested in MSCI World Energy Index (blue line); S&P Global Clean Energy Index (red line).
For energy bulls, the last few weeks have been humbling. However, given that it is widely understood that the economy is essentially energy transformed, and that oil price movements have broader consequences beyond just for those invested in the sector, it’s worth reflecting on what lies behind the fluctuating oil prices over the past few months and what is coming next.
The first reason that can explain the recent decline in oil prices is that despite the polls showing a contested election on November 5th, the believe in Wall Street is that Trump is cruising to victory and that in this scenario, there will be soon a negotiated end to the Ukraine war and peace across the Middle East. In this context, the mantra will be ‘Drill, Baby, Drill’ in the US, meaning that supply will flow in ample amount over the next 4 years. Indeed, with the S&P 500 making new record highs one day after the other, it doesn’t seem that Kamala Harris’s campaign promising investors higher corporate income taxes, higher capital gains taxes and even a tax on unrealized capital gains have gained a lot of traction among investors. Other signs that the market is increasingly pricing in a Trump victory over Harris could include the US dollar’s weakness since early July and the strength of shares in US regional banks, which arguably would benefit from policies aimed at bringing industrial production back to the US.
USD Index under US presidents since 2000.

The problem with this explanation for the recent underperformance of energy related investments is that the polls are what they are. First, recent US elections have been close contests, almost like coin tosses. Moreover, it increasingly looks as though, on the evening of November 5th, the world may not know the outcome of the US presidential election, as we could end up with a contested election with neither candidate securing the 270 electoral votes needed to be elected the 47th US president.

Beyond the fact that Trump's return to the White House is far from guaranteed and increasingly unlikely, if investors had fully priced in a new energy policy centred on the 'Drill Baby Drill' narrative, they should have been positioning for a rise in capital expenditure across US oil fields, with more wells drilled and new pipelines constructed. This should have been good news for companies positioned to handle this work, and the oil services sector should have been outperforming both the S&P 500 and the S&P 500 Energy Index. However, this hasn’t been the case, as shareholders of Schlumberger or Halliburton can attest, it's been anything but a good year for them.
Relative performance of MVIS US Listed Oil Services 25 Index to S&P 500 Index (blue line); Relative performance of MVIS US Listed Oil Services 25 Index to S&P 500 Energy Index (red line) (rebased at 100 as of December 29th, 2023).
The second explanation for the recent underperformance of the energy sector and the weaker-than-expected oil price is that those in power are doing whatever they can to keep oil prices low ahead of the US presidential election. In an economy already ravaged by inflation, which has strained consumers and voters alike, keeping gasoline prices down is crucial. After all, as elections worldwide have shown, people tend to bank their vote with their wallets. In the US, what matters most to consumers, and ultimately voters, is how much they pay at the pump and how high their grocery bills are at Walmart.
University of Michigan Consumer Sentiment Index (blue line); US Daily National Average Gasoline Price (axis inverted; red line).

In short, lower oil prices can be viewed as a political tool to support the implementation of 'Kamunism' by claiming victory over inflation through the misleadingly named 'Inflation Reduction Act.' This narrative promotes the idea of necessary price controls on goods and services producers, who have been unfairly accused of price gouging, while the so-called 'Inflation Reduction Act' primarily aims to advance the climate change scam.

Moreover, it is neither a secret nor a conspiracy that the current US administration has been using the Strategic Petroleum Reserve, which was historically established for supply shortages, to politically manipulate oil prices and maintain its plutocratic regime. This manipulation coincides with the ongoing conflict in Eastern Europe, initiated by the West to penalize Russia for its stance against the climate change scam. Lower oil prices not only hinder Moscow's ability to fund its war effort in Ukraine but also punish Middle Eastern countries like Saudi Arabia and Abu Dhabi for not increasing production to curb Russian funding. Sure enough, the US Strategic Petroleum Reserve is near its lowest level in over 40 years, despite a slight rebuild of stocks in recent months.
WTI Price (blue line); US Strategic Petroleum Reserve (red line).

At the same time, commercial inventories outside the Strategic Petroleum Reserve have been severely depleted due to the recent decline in oil prices and the shape of the oil curve, which has incentivized companies in the energy sector to minimize their inventories. By the standards of the past 15 years, commercial oil stocks at the Cushing, Oklahoma delivery point are notably low. Yet, despite significant draws from oil inventories, prices continue to fall on the news.
WTI Price (blue line); DOE Cushing Oklahoma Crude Oil Total Stocks (red line) & US Recessions.

A less conspiratorial explanation is that many countries in the Global South are preparing for Trump's potential return to the White House, which would likely lead to stricter enforcement of existing sanctions and possibly new punitive measures. Against this backdrop, it makes sense for sanctioned countries to sell as much as they can before November and the January inauguration. If this is part of the explanation, the energy market could find itself in a situation where US inventories are near long-term lows by January 2025, while Iran and Venezuela have already depleted their supply. This will present a challenging starting point for a newly elected Trump if he aims to fulfil his campaign promise of significantly lower energy prices. His options would likely include negotiating a new deal with Iran, which would be extraordinarily difficult given the current hostile rhetoric or pressuring Saudi Arabia to increase production, though it’s doubtful the Saudis would be eager to see prices drop significantly, at the time they have difficulties to find financing for their ‘illusionary’ Neom city.
Iran OPEC Oil Production (blue line); Venezuela OPEC Oil Production (red line); WTI Price (axis inverted; green line).

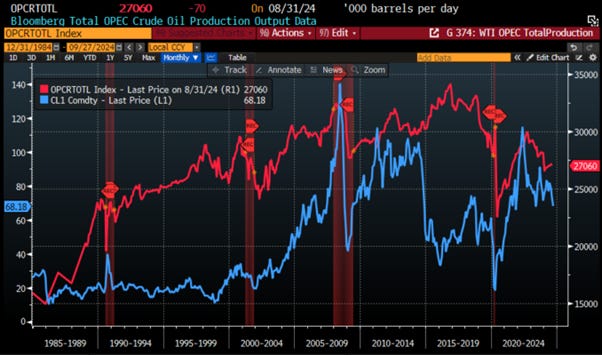
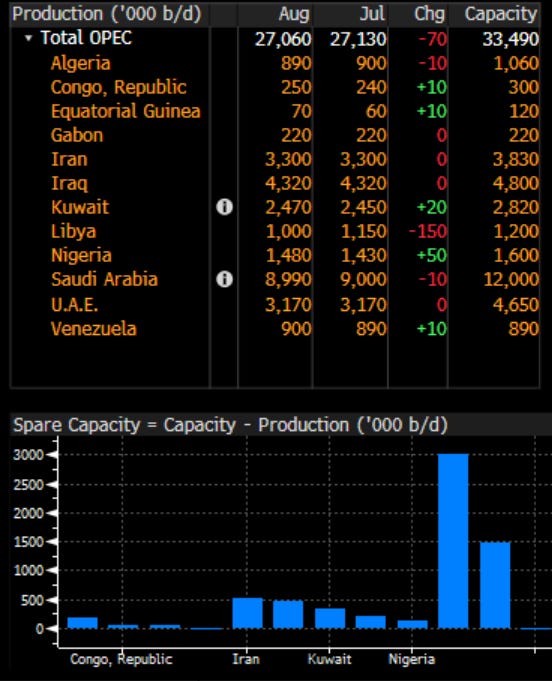
The increase in production from Iran and Venezuela aligns with the ‘cheating game’ that has become business as usual for OPEC+ members subject to output caps. These countries have collectively pumped more than 600,000 barrels a day above their self-imposed limits. Last month, ‘overproduction’ reached nearly 850,000 barrels a day, roughly equal to Venezuela's entire output. This overproduction likely explains the 20% decline in oil prices over the past year. While many in the energy market are sceptical that OPEC+ can push prices higher by 2025, this will largely depend on greater cohesion among cartel members. As the war cycle intensifies, Iran, Venezuela, Saudi Arabia, and Russia may find a common enemy in the so-called Western democracies, which continue to spread their forever bankers' wars across Eastern Europe and the Middle East and sooner rather than later in Asia.
WTI Price (blue line); Total OPEC Crude Oil Production Output (red line) & US Recessions.
Regarding the supply side of the recent decline in oil prices, energy commentators have been focusing on potential excess capacity. The US oil patch has defied expectations, continuing to produce about 13 million barrels per day with limited capital investment. Meanwhile, the anticipated collapse of Russian production following sanctions has not materialized. Additionally, Saudi Arabia continues to operate well below its capacity. This may explain why there is little urgency to keep oil in storage. If the world faces a shortfall of barrels, there’s a prevailing belief that Saudi Arabia will increase its production to ensure the global economy is not derailed by an oil shortage.
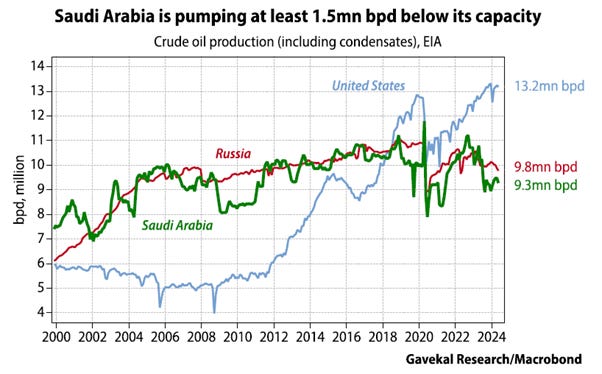
Indeed, Saudi production is running at least 1.5 million barrels per day below Aramco’s capacity, and possibly as much as 2.5 million bpd below. So, there is plenty of excess capacity. However, this excess has existed for the past four years, prompting investors to ask some key questions about what the real reserves of the kingdom are.
https://www.forbes.com/sites/rrapier/2019/02/14/how-much-oil-does-saudi-arabia-have/
Can the US expand its production from here? While Trump may urge US producers to drill more, it doesn't necessarily mean they will, especially given current prices and stock market valuations. Right now, it seems cheaper to find oil on the NYSE floor than in the shale beds of West Texas. This trend is reflected in the decline of the total US oil and gas rig count, as well as the number of drilled but uncompleted wells. As the number of drilling rigs in operation continues to fall, so does the count of drilled but uncompleted wells, which does not bode well for future US production growth.
US Oil & Gas Rig Count (blue line; upper panel); US Drilled But Uncompleted Wells Count (red line; lower panel); WTI Price (green line).

Outside Saudi Arabia and the US, it seems unlikely Russia can expand its production from here. First, sanctions and the normal wear and tear on oil equipment, especially during the harsh Russian winter, pose significant challenges. Second, given that Russia is at war, it is likely already producing at maximum capacity; wars are costly and require substantial funding.
Total OPEC Crude Oil production (blue line); Saudi Arabia Crude Oil Production (red line); Russia Crude Oil Production (green line).

This leaves Saudi Arabia and the UAE as the only genuine swing producers. Frankly, this situation isn't much different from what the oil market has experienced for most of the past few decades and should not have been or be a reason for prices to decline over the summer.
If supply has not been driving oil prices lower, then it must be demand. A year ago, after China reopened its economy from a prolonged COVID-related lockdown, the narrative among oil bulls was that:
There was hope that Chinese demand would continue to hum along. It probably would not grow at the same rate as earlier this century when China was experiencing a construction boom. However, with the number of cars on the road rising from 110 million in 2012 to 330 million in 2023, the expectation was that China’s demand for oil would remain solid.
There was also hope that demand in other emerging markets would follow the trajectory of Chinese demand in the early 2000s. As India, Southeast Asian countries, and those in the Middle East embarked on their own consumption booms, the expectation was that oil demand from these emerging economies would start to resemble China’s path over the first two decades of the 21st century. With China beginning to sell large numbers of cars across the emerging world, this seemed to be an increasingly realistic probability.
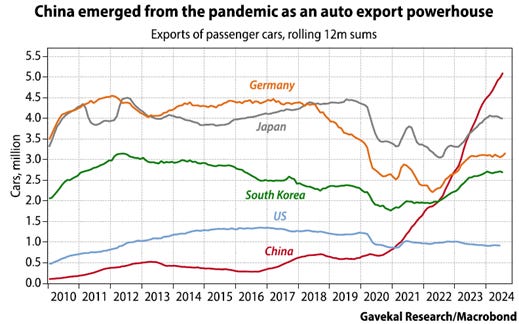
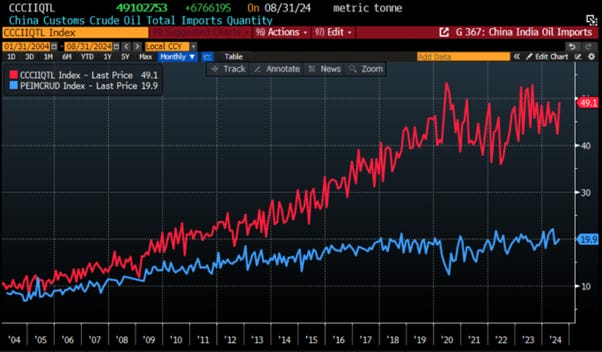
With Chinese consumers buying more cars than ever and China exporting increasing numbers of vehicles to emerging markets, the stage seemed set for global oil demand to continue growing at a brisk pace. This appeared bullish for energy prices. Yet, the anticipated rapid growth in oil demand did not materialize. Today, China’s oil imports are roughly at the same levels as in early 2020, and India’s imports are not much higher than those in late 2018. Granted, this is all official data, which may understate true levels of imports. In a world where one oil producer after another has been removed from the US dollar payment system and is forced to transport its oil in ‘dark fleet’ tankers, the official data may well omit significant quantities of ‘black-market’ oil purchased from Russia, Iran, Sudan, and even Venezuela by countries like China and India, which are not known for strictly adhering to US diktats.
India Oil Imports (blue line); China Oil Imports (red line) (in metric tons).
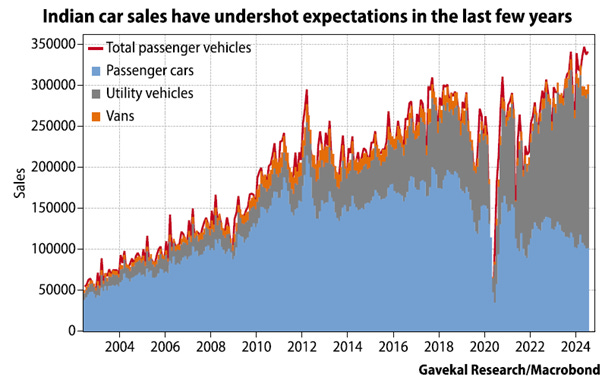
Even so, emerging market oil demand has underwhelmed. Take India as an example: GDP growth has been impressive, outpacing that of any other major economy. The stock market has provided substantial gains for domestic investors, and gold holdings have surged as India’s private sector gold holdings are estimated to be roughly five times the amount of bullion held in Fort Knox. Today, the average Indian is wealthier than ever before, likely even more so than expected five years ago. Yet, Indians are only buying slightly more vehicles than they did in 2019, before COVID struck.
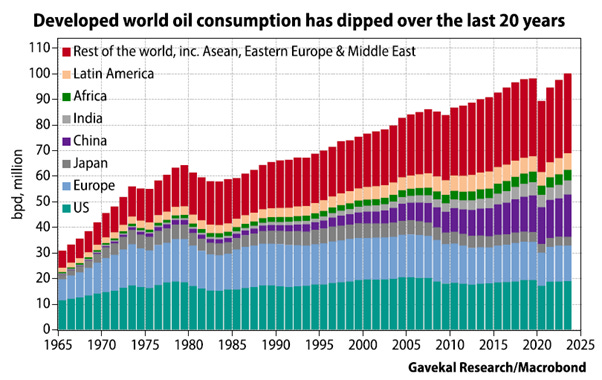
This matters because it has been clear for some time that future oil demand growth will not come from the world’s developed economies. Over the past two decades, oil demand in the US, Europe, and Japan has either flatlined or even shrunk. During this period, the world’s annual demand growth of around 1 million barrels per day has come from China and other emerging markets.
Oil bulls argue that emerging market oil demand will continue to grow by around 1 million barrels per day due to:
Rising disposable incomes.
Increased purchases of energy-intensive goods like refrigerators, air conditioners, and personal computers.
Lower prices for cars and motorbikes as China becomes a major automotive exporter.
Conversely, the oil bears are arguing that:
Rapid improvements in energy efficiency. While electric vehicles are still too costly and unreliable for many consumers, hybrids are advancing quickly. The new BYD Qin, for example, offers a 2,000 km range for about $14,000, which could be a game changer.
Many of the fastest-growing cities are already densely populated, with their futures likely tied more to shared public transport than to automobiles. Among the 100 largest cities, 69 are within a five-hour flight of Hong Kong, with seven of the top ten located in Asia

Indeed, owning a car in these cities doesn’t guarantee quick travel, raising doubts about whether rising GDP per capita will lead to increase per capita energy consumption as it did in developed cities. This seems to be the lesson from India. Emerging economies may shift their energy mix in the coming years due to affordable Chinese solar panels, budget-friendly nuclear power plants, and more efficient electricity grids. This would mean that China would help other countries of the Global South to electrify as quickly as it has.

However, for those promoting greenwashing, the reality is that we still live in a world where hydrocarbon sources account for 82% of all energy produced.

On a side note, those who believe China is pursuing alternative energy sources to appease Greta Thunberg or green activists will be disappointed. The real motivation for China and much of the Global South to go green is to reduce dependence on external energy supplies, primarily controlled by the US and its allies in the Middle East. In an environment where Western plutocrats are weaponizing the economy, China and its allies are actively seeking alternative energy sources to enhance their strategic resilience.
China Oil Import by countries.

Source: Bloomberg.
In a nutshell, with approximately 12.2 million barrels a day of spare capacity from OPEC, the US, and Canada, exceeding China’s imports of around 11.4 million barrels a day, the primary mechanism to address this surplus is likely lower prices. As any savvy investor knows, in commodity markets, the best cure for low prices is, indeed, lower prices.

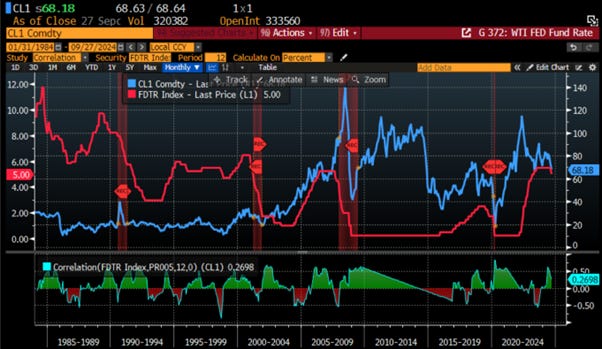
In the meantime, oil bears will also find comfort in the recent 50-basis point rate cut from the FED, as there has been a high correlation between WTI prices and the FED funds rate over the past 40 years. However, if the FED is forced to cut its FED funds rate even further in the next 12 months, this would indicate that the US has already entered a recession, and investors should assume that oil prices will not be the only prices lower than they are today in that case.
WTI Price (blue line); FED Fund Rate (red line); Correlations & US Recessions.
While an interest rate cut cycle and a weaker US economy may appear to pose a headwind for oil prices, investors should consider that speculators betting on significant rate cuts over the next 12 months have also reduced their net long non-commercial futures positions to levels not seen since the onset of the COVID-19 pandemic in Q1 2020. Any investor with common sense will likely recognize that, barring a lockdown of the US economy or the declaration of martial law ahead of the November 5th election to favour the current Vice President and Democratic candidate in the race to the White House, hedge funds' current pessimism regarding oil demand is overblown. As a result, a ‘slingshot’ in oil prices should materialize once the political circus surrounding the White House subsides.
WTI Price (blue line); CFTC NYMEX Non-Commercial Net Positions (red line); Correlation & US Recessions.

The key question on investors' minds is: what is the right price of oil? Experienced investors recognize that, in a world where Washington and Brussels have weaponized the US dollar and where fiat currencies will continue to be debased, pricing oil in USD is increasingly irrelevant. A more reliable gauge has been the Gold-to-Oil ratio, since both commodities are limited in supply and serve as stores of value with gold as a financial hedge, oil as a driver of economic development. You don’t need to be a macroeconomic genius to read the chart of the Gold to Oil ratio and understand that oil is too cheap on that metric. As the Gold-to-Oil ratio is now trading over two standard deviations above its 40-year average, it should be clear to anyone that oil is currently a bargain in gold and USD terms as it has seldom stay at current levels.
Gold to Oil Ratio & US Recessions

At 38.9x, the current Gold-to-Oil ratio mirrors its level at the end of 2016, a time when oil prices collapsed due to a growing supply glut fuelled by booming US shale oil production. Efficiency gains in the sector significantly lowered break-even prices, positioning US shale as the de facto marginal cost producer in the international market.

In this context, while a return to the mean of 18.4 seems premature due to ongoing weakening demand and ample supply, the current Gold-to-Oil ratio is not sustainable in the long term. Assuming gold prices don’t rise in USD (which seems unlikely, as investors recognize gold as the only antifragile asset against reckless government policies, regardless of who occupies the White House), WTI should trade 22% to 50% higher in gold terms, translating to a price range of $87 to $106 in the coming months. Equity investors should note that historically, when the Gold-to-Oil ratio declines, it often precedes sharp corrections in the S&P 500, as significant drops in the ratio have typically been bad news for stocks.
Gold to Oil ratio (blue line); S&P 500 index (red line): US Recessions & correlations.

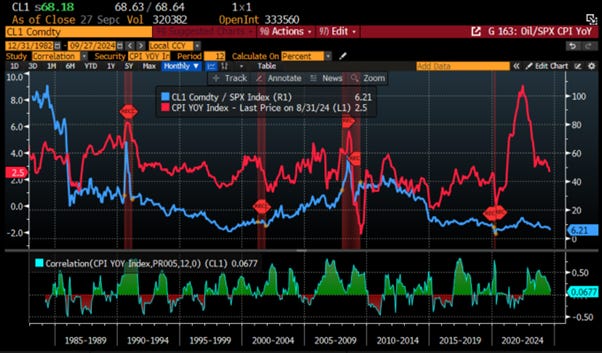
Seasoned investors recognize that oil prices have significant macroeconomic implications, particularly their inflationary or deflationary effects on the economy. Over the past 40+ years, it has been established that a rising oil price relative to the S&P 500 indicates an inflationary trend that often leads to recession, while a declining ratio, like the one observed since June 2022, suggests a disinflationary trend conducive to economic growth. Thus, it is no surprise that candidates seeking election on November 5th have focused on containing oil prices at all costs, while the partisan and political Federal Reserve has been in charge of boosting liquidity to keep financial assets rising.
Relative performance of WTI Price to S&P 500 index (blue line); US CPI YoY Change (red line); US Recessions & Correlations.
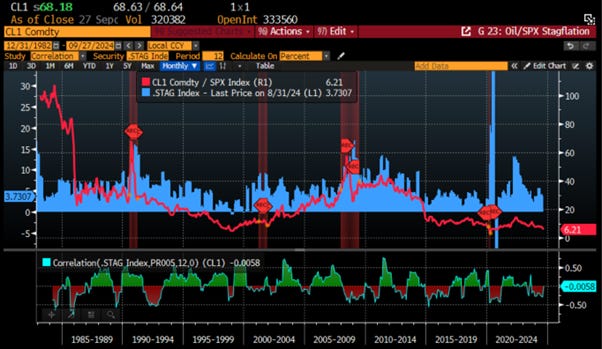
As economic data indicates a significant slowdown, investors should closely monitor the relative performance of oil price to the S&P 500 index in the coming months. This relationship will provide additional signs of whether the US has entered or is entering an inflationary bust, or stagflation. Such a scenario would have critical implications for portfolio allocation across asset classes in the years ahead.
US Stagflation Proxy Indicator (blue histogram); Relative performance of WTI Price to S&P 500 index (red line); US Recessions & Correlations.
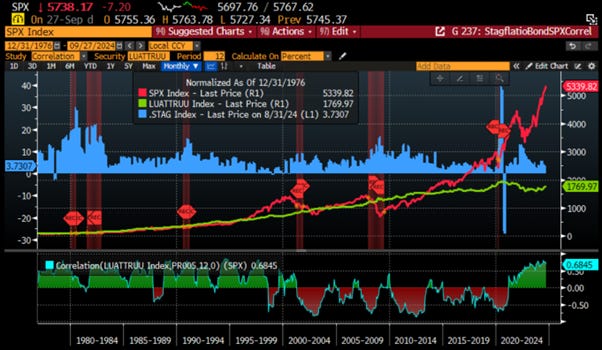
The same seasoned investors know that in an in an inflationary bust environment, diversifying equity positions with government bonds is counterproductive. In such cases, the typical negative correlation between these asset classes vanishes as it has been the case since the Covid pandemic.
US Stagflation Proxy Indicator (blue histogram); S&P 500 Index (red line); Bloomberg US Treasury Total Return Index (green line); Correlations & US Recessions.
For those believing the recent decision by the FED to cut rates makes sense in an environment where the US is likely heading deeper into an inflationary bust, it's important to note that rising stagflationary pressures often lead to the energy sector outperforming. In the meantime, the sector remains unloved and under-owned compared to the IT sector, which is still idolized and over-owned by YOLO investors.
US Stagflation Proxy Indicator (blue histogram); Relative performance of S&P 500 Energy Index to S&P 500 IT index (red line); Correlations & US Recessions.

In this context, while hydrocarbons still account for 80% of global energy, Wall Street's disdain for the energy sector persists. This is fuelled not only by asset managers living luxuriant life thanks to the ‘ESG hot air’ but also by YOLO investors favouring tech over energy. Consequently, hydrocarbon companies make up just 4.2% of the MSCI World Index, reflecting a significant imbalance. Those believing that the energy sector is not worth more than 4.2% of the total market capitalization of the world may ultimately agree with these 3 statements which have no common sense to reflect the reality of 2024.
Energy companies are unable to generate profits for the years to come.
The world truly on the verge of a dramatic energy transition where oil will be irrelevant.
The global economy is poised for an economic Armageddon in the coming year.

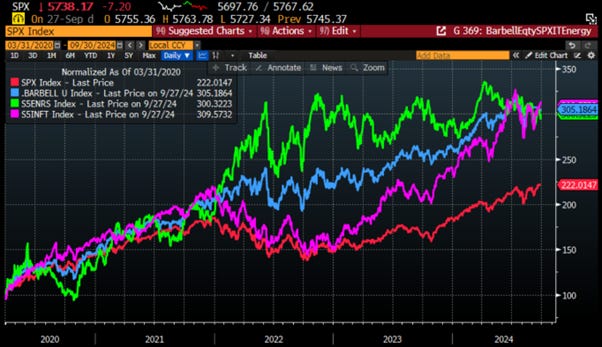
As savvy investors know, one of the best-managed risk equity portfolios since the 2020 COVID crash and the emergence of the multi-polarized world has been a balanced mix of 50% US tech stocks and 50% energy stocks. This portfolio experienced shallow drawdowns and delivered returns that outperformed both its individual components and the S&P 500 overall.
Performance of $100 invested in Barbell Equity Portfolio (50% S&P 500 Energy Index+50% S&P 500 IT Index) (blue line); S&P 500 Index (red line); S&P 500 Energy Index (green line); S&P 500 IT Index (purple line) since March 31st 2020.
In conclusion, the assumptions surrounding the recent oil price decline warrant revaluation. Energy bears should consider the following:
Trump’s Potential Impact: For those who believe a Trump victory will crush oil prices, consider the risks: he may not win, and even if he does, pushing down prices when inventories are low and major suppliers like Iran and Venezuela are maxed out won't be easy. Additionally, convincing US oil executives to increase drilling with prices near break-even costs is unlikely. A more plausible scenario is that Trump would focus on weakening the dollar, which could actually boost energy demand in emerging markets.
Manipulation Concerns: With inventories near historical lows, politicians' ability to drive prices lower is limited. Moreover, potential job losses in the energy sector from further price drops could outweigh any political gains. With the FED cutting rates, the urgency to lower oil prices may have diminished, at least until another escalation in the war cycle.
Excess Supply Factors: While inventories have been depleted and Saudi Arabia has withheld production, they can still ramp up output if needed. At $70/bbl, many capital expenditure programs are on hold, and further price drops could harm marginal producers, setting the stage for a future rebound.
Weak Demand Issues: The current demand weakness raises questions about its cyclical versus structural nature. If demand is structurally weak, significant consolidation in the energy sector could occur. However, essential inputs for the energy transition, like copper, uranium, nickel, and lithium, have performed poorly, suggesting that current demand concerns may be more cyclical than structural. Thus, fears of an accelerating downturn might be overblown.
WHAT’S ON THE AGENDA NEXT WEEK?
The first week of the final quarter of this already eventful year, coinciding with China's Golden Week, will see investors focus once again on forward-looking economic indicators such as the PMI data from China and the US, as well as Japan’s Tankan survey and the ISM manufacturing and non-manufacturing reports. The week will also provide further insight into the health of the US job market, with Friday's release of the Non-Farm Payroll report for September. Additionally, there will be another series of FOMC governor speeches, with the most significant being the FOMC Chairman's address on Monday.
KEY TAKEWAYS.
As the last quarter of the year unfolds, here are the key takeaways:
While probably not enough to Make China Great Again soon, the latest round of monetary and fiscal stimulus in China will add to inflationary pressure in a world that remains driven by supply shortages.
After the 'Powelian' interest rate cut, the flash PMI data provided further signs that the US economy is already in an inflationary bust.
The latest personal income data revealed that American consumers are wiped out, aside from government handouts, which are part of broader Keynesian policies designed to make them more subservient to the plutocrats in power and will keep inflation stickier for much longer.
If the economy is as strong as Wall Street and the plutocrats in power trumpet, investors should question why the consensus still anticipates a phantasmagorical 76 basis points in rate cuts before the year's end.
The reality is that more reckless Keynesian government spending to be implemented, whoever is the next tenant of the White House, will translate into a higher interest burden, pushing toward yield curve control and financial repression. This will harm investors who continue to chase the ‘duration trade’ and believe that the ‘once upon a time risk-free’ US Treasury remains free of risk.
No one needs to be an oil expert to understand that the current oil price is not factoring in any 'geopolitical premium,' despite the escalating war cycle worldwide.
Neither ‘Drill Baby Drill’ nor ‘Kamunism’ can explain how unpleasant this summer has been for energy bulls.
While Iran and Venezuela may front run ‘Tumponomics 2.0’, supply will likely decline after November 5th, regardless of who occupies the White House next.
Current demand weakness may be more cyclical than structural, indicating that fears of an accelerating downturn could be overblown, despite potential consolidation in the energy sector.
With the Gold-to-Oil ratio soaring over two standard deviations above its 40-year average, it's evident that oil is today a bargain in both gold and USD terms.
Despite hydrocarbons powering 80% of global energy, Wall Street’s biases leave the energy sector with only 4.2% of the MSCI World Index, highlighting a stark market imbalance that defies economic reality.
A savvy mix of 50% US tech and 50% energy stocks has proven to be the top-performing risk-managed portfolio since the COVID crash, outperforming both its components and the S&P 500.
As 'Kamunism' rather ‘Trumponomics 2.0’ is taking shape, investors will once again need to focus on the Return OF Capital rather than the Return ON Capital, as stagflation spreads.
To surf ‘Kamunism’, investors should focus even more on companies with low-leveraged balance sheets and strong business moats and avoid direct exposure to the financial sector.
Physical gold remains THE ONLY reliable hedge against reckless and untrustworthy governments and bankers.
Gold remains an insurance to hedge against 'collective stupidity' and government’ hegemony which are in great abundance everywhere in the world.
With continued decline in trust in public institutions, particularly in the Western world, investors are expected to move even more into assets with no counterparty risk which are non-confiscable, like physical Gold and Silver.
Long dated US Treasuries are an ‘un-investable return-less' asset class which have also lost their rationale for being part of a diversified portfolio.
In such an environment, the risky part of the portfolio has moved to fixed income and therefore rather than chasing long-dated government bonds, fixed income investors should focus on USD investment-grade US corporate bonds with a duration not longer than 12 months to manage their cash.
In this context, investors should also be prepared for much higher volatility as well as dull inflation-adjusted returns in the foreseeable future.
HOW TO TRADE IT?
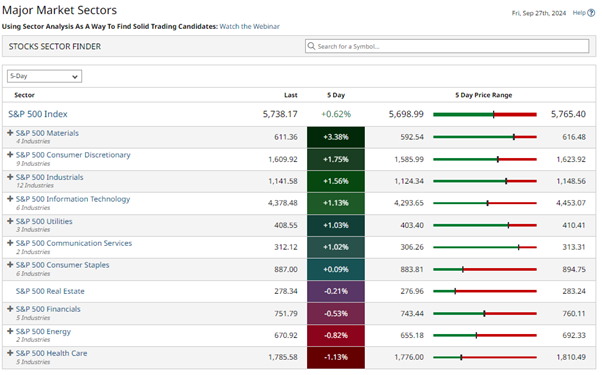
The last full week of September was expected to be much quieter than previous weeks, but that didn't stop US equity indices from reaching new highs, with the S&P 500 and Dow Jones recording three new all-time highs over the past five days. While China was the focus for equity investors last week, in the US, small caps ended the week lower, while the Nasdaq regained its status as an outperformer against the S&P 500 and Dow.
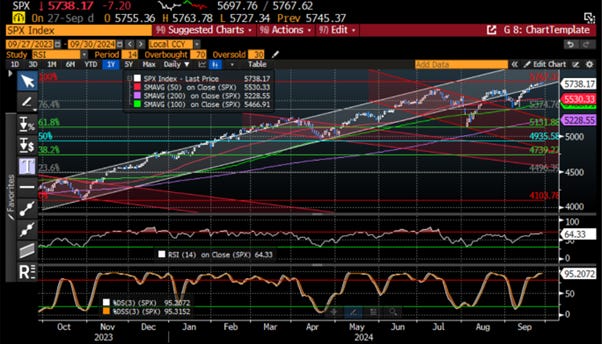
As inflation bottoms out and the US experiences an inflationary bust (i.e., stagflation), with central bank masquerade reaching new heights and global warfare escalating, investors should remain on high alert. As here comes October, they should brace for significant downside moves and increased volatility, which could push equity markets back to their August 5th lows and possibly lower as we near the 'D-Day' of the year of political hell. While the Nasdaq has broken the downtrend initiated in mid-July, it is unlikely to reach its all-time high from July 10th, as stochastic and RSI technical indicators are already signalling a reversal. The same technical patterns apply to the S&P 500 and Dow Jones.
Thanks to the support of the CCP and its attempt to ‘Make China Wealthy Again’, cyclicals sectors such as Materials; Consumer Discretionary and Industrial outperformed over the past week while Financials; Energy and Health Care lagged.
Like gold, silver, and platinum, in an increasingly weaponized world with a heightened war cycle, the best way for investors to benefit from structurally rising oil prices in the coming months would be to store oil in a secure location for future sale or personal use. However, given the challenges of storing oil, this option is impractical for most investors, including high-net-worth individuals who lack significant storage capacity. The second-best option is to invest in the commodity futures market, but this also requires access to the NYMEX or other commodity futures exchanges, typically reserved for sophisticated institutional investors.
While there are ETFs that invest in the oil futures market, their performance can be affected by the need to roll over contracts at the end of each month, which in turn depends on the shape of the oil futures curve. Those with a basic financial understanding know that futures can trade in contango or backwardation, two market conditions that describe the relationship between spot prices and futures prices of a commodity.
Backwardation is a market condition where the spot price of a commodity is higher than the forward price of its futures contract. This occurs when the difference between the spot price and futures price is less than the Cost of Carry (COC). Backwardation is relatively rare and can be influenced by factors such as convenience yield, excessive demand for futures, or an oversupply of futures. In a market characterized by normal backwardation, the forward price curve slopes downward, indicating that immediate availability is more valuable than future delivery.
Contango is a market condition where the spot price of a commodity is lower than the forward price of its futures contract. This situation is common in non-perishable commodities that have a Cost of Carry (COC). Contango occurs when the difference between the futures price and spot price exceeds the COC. In a contango market, the forward price curve slopes upward, indicating that future delivery is more expensive than immediate availability.
A quick glance at the oil futures curve and its shifts over time reveals that investors venturing into commodity ETFs must brace for significant performance divergence from the actual price movements of the underlying commodity.
WTI Nymex Futures Curve as of September 27th 2024 (white line); December 29th 2023 (blue line); March 31st 2020 (orange line).

In this context, investors should not be surprised that the performance of these ETFs diverges significantly from the underlying commodity over time. Those using these ETFs for oil exposure must manage them actively, as a buy-and-hold strategy will not replicate the long-term performance of the underlying futures contracts.
Performance of $100 invested in WTI Active contracts (blue line) and WisdomTree WTI ETF (CRUD LN) (red line) since December 31st 2008.

Ultimately, investors looking to benefit from higher oil prices but lacking the expertise to manage crude oil futures are likely best served by investing in the US energy sector. Like other commodity producers, they will face geopolitical and commercial risks related to extraction. However, most major US oil and gas companies primarily operate in the US and Canada, which are still relatively safe jurisdictions, despite the rising risks of future government actions, such as increased taxes or tighter regulations, as commodity prices climb. Investors must understand that the US energy sector offers valuable diversification, especially since it remains structurally underweight in major US indices like the S&P 500 and Dow Jones and its correlation with other sectors and the major indices like the S&P 500 and the Dow Jones is relatively low on historical basis.
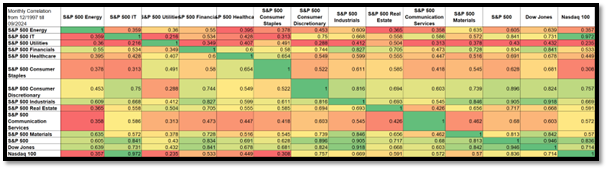
Source: Bloomberg.
In this environment, those investors who are too lazy to do an active asset allocation of their equity portfolios can simply hold a barbell portfolio consisting of 50% Energy Select Sector SPDR Fund ETF (XLE US) and 50% IT Select Sector SPDR Fund ETF (XLK US). As shown above, this combination has not only outperformed the S&P 500 since the onset of the COVID pandemic, but has also experienced much lower drawdowns compared to both the S&P 500 and the two individual components of the strategy.
Ultimately, to navigate increased regulation and the rising risks of social unrest and chaos both domestically and abroad, investors are reminded to hold a significant portion of their wealth in assets with no counterparty risks. This will help preserve their wealth against reckless actions by increasingly tyrannical governments. In this context, owning 20% to 40% of one's portfolio in physical gold, silver, and possibly platinum, stored outside the financial system and in jurisdictions less likely to succumb to the WEF narrative, is the way to navigate the upcoming financial thunderstorms which lie ahead of all of us. Ultimately, nobody should ever forget that the real problem is the government with its reckless spending and that taxes are only there to allow the plutocrats in power to spend more to enrich the kleptocracy (a government ruled by thieves) and the kakistocracy (a government run by unprincipled career politicians, corporations, and thieves that panders to the worst vices in human nature and has little regard for the rights of the citizens) prevailing in those countries who have been rallying to the WEF narrative. As the government is the problem, investors must stay away from government bonds with a maturity of more than 3 months and given the unfolding inflationary bust any bonds with a maturity of more than 12 months. In this context, the best way to manage cash is to own a diversified portfolio of short-dated (not more than 6 to 9 months) IG USD bonds issued by US corporations with a low leverage balance sheet and an economic moat which will preserve their results from the adverse effects of the rising stagflationary vibes in the quarters and years to come the light at the end of the current inflationary bust only materialise after 2028 as the US empire and its chrony vassals have lose their ability to spread their forever bankers’ wars.
In this context, it is crucial for investors to remain humble and nimble. With the forward confusion and illusions spread by Wall Street, it’s important to remember that there are two ways to be fooled in life. One is to believe what is not true (e.g., the illusion of a soft landing and that inflation has been defeated), and the other is to refuse to accept what is true (e.g., the U.S. and the rest of the Western world are already in an inflationary bust, and escalating war cycles along with increased government spending will only worsen the situation).

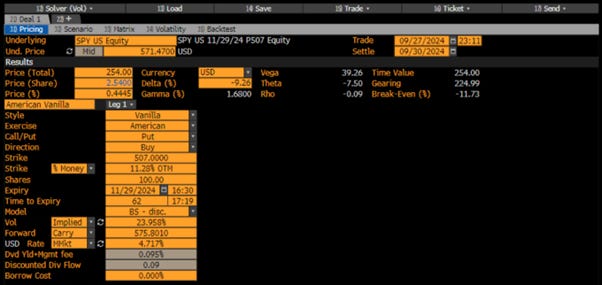
Finally, investors should remember that in this environment volatility can only go one way (UP) and will increase significantly after November 5th, as neither side contesting the White House will ever accept the election results, it is important to stay hedged and prepared for a significant sling shot in the coming weeks. In this context, those who followed the recommendation earlier this month to buy a 507 Put on the S&P 500 ETF (SPY Index) expiring on November 29th can continue to hold this position and may even use the recent weeks’ market rebound to add to the trade, as the premium for protecting against such a downside remains highly attractive.
Readers should always remember that they have to look at their life on different angles and they will always find the right path to a brighter future.

Source: https://short-stories.co/@guydemaupassant/the-necklace-3jglpwo7zdxw
If this report has inspired you to invest in gold and silver, consider Hard Assets Alliance to buy your physical gold:
https://hardassetsalliance.com/?aff=TMB
At The Macro Butler, our mission is to leverage our macro views to provide actionable and investable recommendations to all types of investors. In this regard, we offer two types of portfolios to our paid clients.
The Macro Butler Long/Short Portfolio is a dynamic and trading portfolio designed to invest in individual securities, aligning with our strategic and tactical investment recommendations.
The Macro Butler Strategic Portfolio consists of 20 ETFs (long only) and serves as the foundation for a multi-asset portfolio that reflects our long-term macro views.
Investors interested in obtaining more information about the Macro Butler Long/Short and Strategic portfolios can contact us at info@themacrobutler.com.
Unlock Your Financial Success with the Macro Butler!

If this report has inspired you to invest in gold and silver, consider Hard Assets Alliance to buy your physical gold:
https://hardassetsalliance.com/?aff=TMB
Disclaimer
The content provided in this newsletter is for general information purposes only. No information, materials, services, and other content provided in this post constitute solicitation, recommendation, endorsement or any financial, investment, or other advice.
Seek independent professional consultation in the form of legal, financial, and fiscal advice before making any investment decisions.
Always perform your own due diligence.