


Inflation vs. Recession – Which Way Will the US Coin Toss?


THE WEEK THAT IT WAS...
The second week of a year which has already been eventful in many manners was focussed on inflation; bond auctions and earnings.
Concerning inflation, the US December CPI indicated that the final stretch toward the 2% target may not be achieved, with goods disinflation hitting a pause and services inflation expected to persist due to wage increases and a tight job market. While the CPI came in hotter than expected, the headline PPI actually decline 0.1% MoM (below the +0.1% MoM expected). That is the third straight month of deflation but the core PPI inched +1.0% YoY. Excluding food and energy, the core PPI was unchanged MoM in December, the third month of unchanged in a row, which dragged the Core PPI YoY down to +1.8% (the lowest since December 2020).

For investors, the lesson from the December inflation data is thatthe inflation boomerang is gradually swinging back, as goods inflation has already reaccelerated even before the economy experienced the impact of the recent supply disruptions related to the geopolitical events in the Red Sea. The recent widening between Core CPI and Core PPI has been, outside the inflow of shadow liquidity, the main trigger for the recent valuation expansion of the equity market as US corporations continue to expand margins.
S&P 500 Index Fwd P/E (blue line) & Spread between US Core CPI and US Core PPI (red line).

The oil price has remained relatively weak despite the current geopolitical situation in the Middle East. The prevailing narrative suggests that weak demand and consistent supply have hindered oil prices from capitalizing on the supply chain disruptions in the Red Sea. Analysing the anticipated demand and supply for 2024, the oil market is expected to face a deficit. This deficit, coupled with uncertainties related to the geopolitical situation, poses challenges for the oil market.

To provide context, between 1991 and 2021, investors have navigated a period of low inflation volatility. However, when examining the preceding 30 years or the era of the 1930s-1940s, inflation volatility was notably higher. The concern arises from the fact that many current portfolio managers have only operated within this low-volatility environment. The future is likely to introduce an environment unfamiliar to most investors throughout their careers.
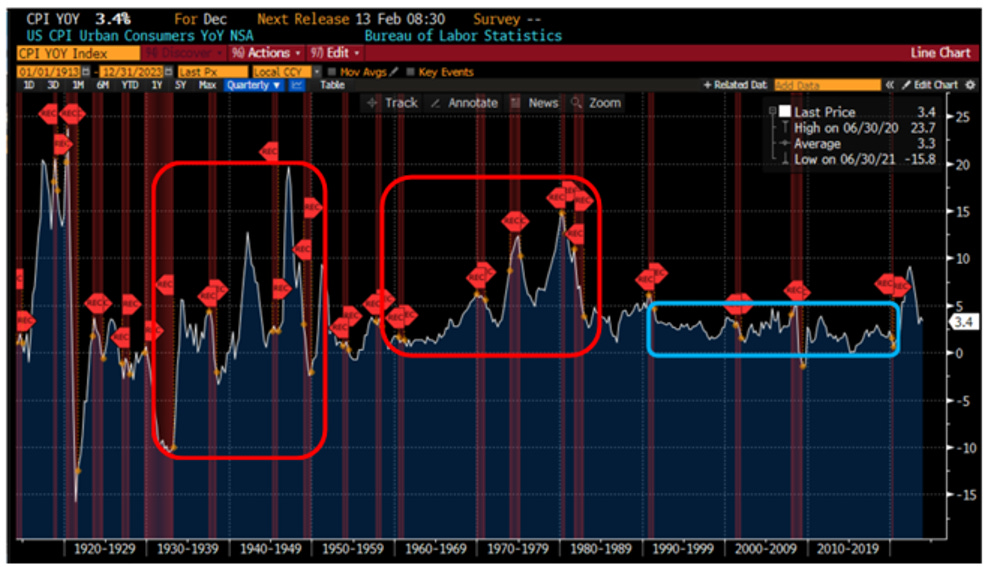
The same is true for the US 10-year yield which has been in a downtrend since the late 1980s while looking back at 1960s and 1970s, not only the US 10-year yield was much higher that it has been over the past 30 years, but it was also much more volatile.

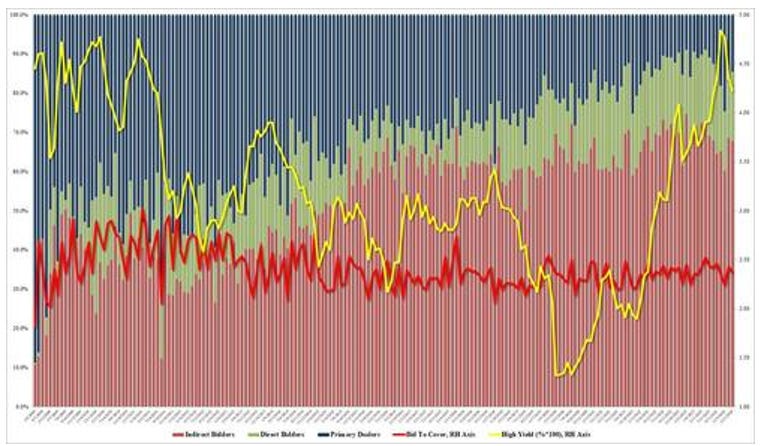
The first 10-year bond auction of 2024 was rather mediocre as it tailed the When Issued 4.019 by 0.5 bps. This marks the fourth consecutive 10-year auction with a tail and the 11th consecutive non-stop-through auction (September was on the screws). Remarkably, there have only been three stop-through 10-year auctions in the past 27 months. The bid-to-cover was better, but internals were average. In summary, it was a mediocre auction that could have been worse. The chronic inability of the benchmark paper to sell without tailing suggests a deeper and concerning demand problem for US paper.
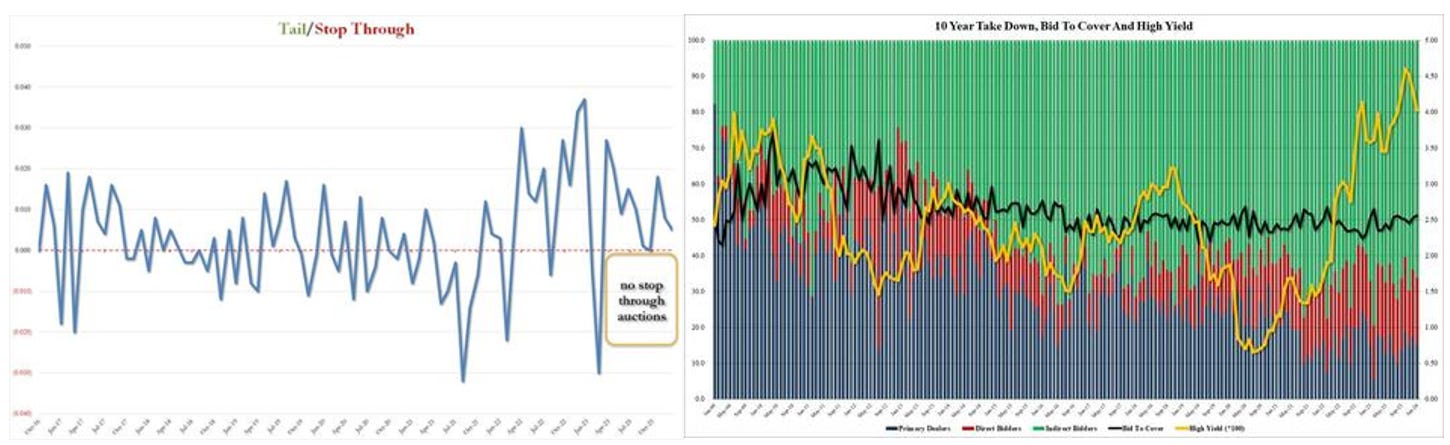
However, following a lukewarm 10-Year auction, the 30-Year Treasury auction proceeded smoothly and yielded positive results. With a high yield of 4.229%, down from December's 4.344% and the lowest since August, the auction demonstrated strength.
Confidence in the expectation that bond yields will be permanently higher than in the 15 years following the 2008 global crisis, likely surpassing the levels seen in the first decade of this century, is based on four arguments:
1) Inflation will remain stuck on a 3% or 4% plateau instead of falling to 2%.
2) The FED’s 2% target, even if it is attained in 2024, will now be a floor for US inflation, not a ceiling as it was from 2009 to 2020, not even an average as it was from 1994 to 2008.
3) Real interest rates will be significantly higher in the years ahead than in the 2000-2020 period, because secular transformations in industrial structures, demographics and geopolitics all imply the end of “secular stagnation,” the era when global underinvestment and excess savings dragged down the neutral interest rates required to balance ex-post savings and investments.
4) The yield-curve inversion that has kept US bond yields far below policy rates, due to unfounded recession fears, will flatten and then normalize into an upward-sloping yield curve.

If 2% is the floor for PCE inflation in the coming years, the average is likely around 2.5%, considering the usual 1pp fluctuation over the economic cycle. Converting PCE inflation to CPI, which influences market pricing for treasury inflation-protected securities (TIPS), shows that, historically, CPI inflation has averaged 0.4% higher than PCE inflation. Thus, a 2.5% average for PCE inflation implies a 2.9% average for CPI, significantly higher than the 2.1% priced for the next five, 10, and 30 years in the TIPS market today.
Adding a baseline inflation of 2.9% and factoring in the long-term real interest rate estimate, which historically averaged around 2.1% before the secular stagnation period (2000-2008), and essentially zero during the stagnation period (2009-2019), suggests an average of 4.9% for US 10-year yields over the cycle. Despite this, the current 10-year yield is only 3.93%, with expectations leaning toward further decrease, influenced by yield-curve inversion driven by recession forecasts. If expectations shift due to a lack of recession and the end of secular stagnation, the yield curve may dis-invert and steepen. Assuming a return to the normal term premium, even with a sharp FED rate cut to 3.8% by the end of 2024, 10-year yields could rise to 4.8%-5.3%. If the Fed is cautious in rate cuts, a term premium of 1-1.5pp could imply 10-year yields around 6%.
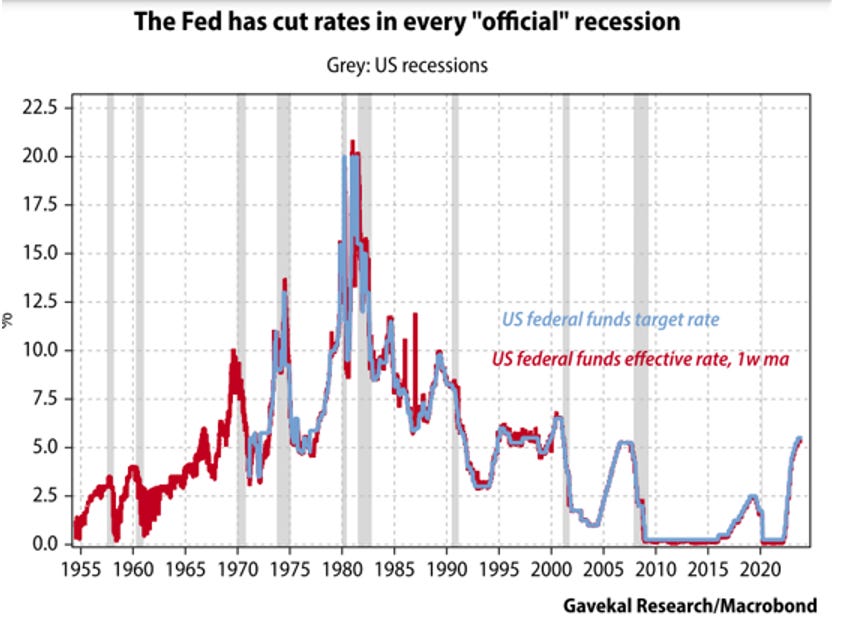
In conclusion, current bond yields seem unusually low given considerations of inflation, real interest rates, and the market's term structure. This anomaly may be explained by two potential scenarios: either investors expect an imminent event confirming a sustained sub-2% inflation environment, or they anticipate a severe recession leading to significant FED rate cuts exceeding 150 basis points this year. Given the unlikelihood of a persistent sub-2% inflation scenario, the current bond yields are more likely justified by expectations of an impending US recession. Historical patterns suggest that in recognized US recessions, the FED typically implements rate cuts of at least 2.4 percentage points. In the current cycle, a genuine recession would imply a FED funds rate of 2.9% or lower, supported by the FED's commitment to preventing substantial job losses, especially during a politically charged election year. Only this scenario, combined with a historical term premium range of 1-1.5%, could keep 10-year yields around the current 3.9% level.
The current pricing of the US bond market suggests a high probability of a recession in 2024, a view not supported by objective indicators pointing to another rebound in the US trampoline landing. Despite positive economic signals, the market seems overly pessimistic, possibly due to the expectation of swift FED intervention in case of any recessionary signs. Investors, initially preparing for a Goldilocks scenario, shifted portfolios toward equities and away from inflation hedges. As the focus shifted to recession risk, long bond positions became popular. However, this shift in strategy might not be justified in 2024, posing a significant asset allocation opportunity for those reassessing their positions.
A shift in perception, with rising concerns about US inflation and reduced worries about a recession, could lead to increased demand for commodities, energy, and gold as hedges, while diminishing the demand for bonds. Even without changes in core portfolios or Goldilocks assumptions, this shift could significantly impact relative asset prices and investment performance. A small reallocation from bonds to inflation hedges like gold, energy, and commodities could have a substantial effect on their prices. Additionally, rising bond yields, coupled with fading recession fears, may drive outperformance in cheap, cyclically sensitive assets such as emerging markets and industrials.
To summarize, cyclical assets are attractive—and bonds very unattractive— merely on the basis of hedging demand, regardless of how 2024 unfolds for the US and world economies. In the case of a US recession does not happen in 2024, as the US government will do whatever it takes to do so, then the 2024’s best investments will be assets most vulnerable to economic downturns: cyclical stocks, commodities, emerging markets that benefit from higher interest rates. If, on the other hand, a US recession does happen, these cyclical asset classes will not be big losers as they are already priced for such a scenario. In a case of a US recession, bonds will not gain much since hedging against recession risks means bonds are already fully priced for a recession. In short, long dated bonds today are the worst kind of investment proposition: “heads I lose; tails I don’t win.” Meanwhile inflation hedges and cyclical assets that have been shunned or ignored by investors may represent the opposite proposition: “heads I win, tails I don’t lose (very much)”.
As regular readers will know, we think that what mostly matters for financial markets it is how the US Treasury will be able to continue to use ‘’shadow liquidity’’ to finance its gargantuan deficits, at least until the November presidential elections. In the past week, the Reverse Repo Program (RRP) decreased by $44.8 billion, reaching just above $1.0 trillion. Simultaneously, the TGA drained $27 billion.
Reverse Repo Program (blue line); US Treasury General Account (TGA) (red line) & FED Balance sheet (green line).
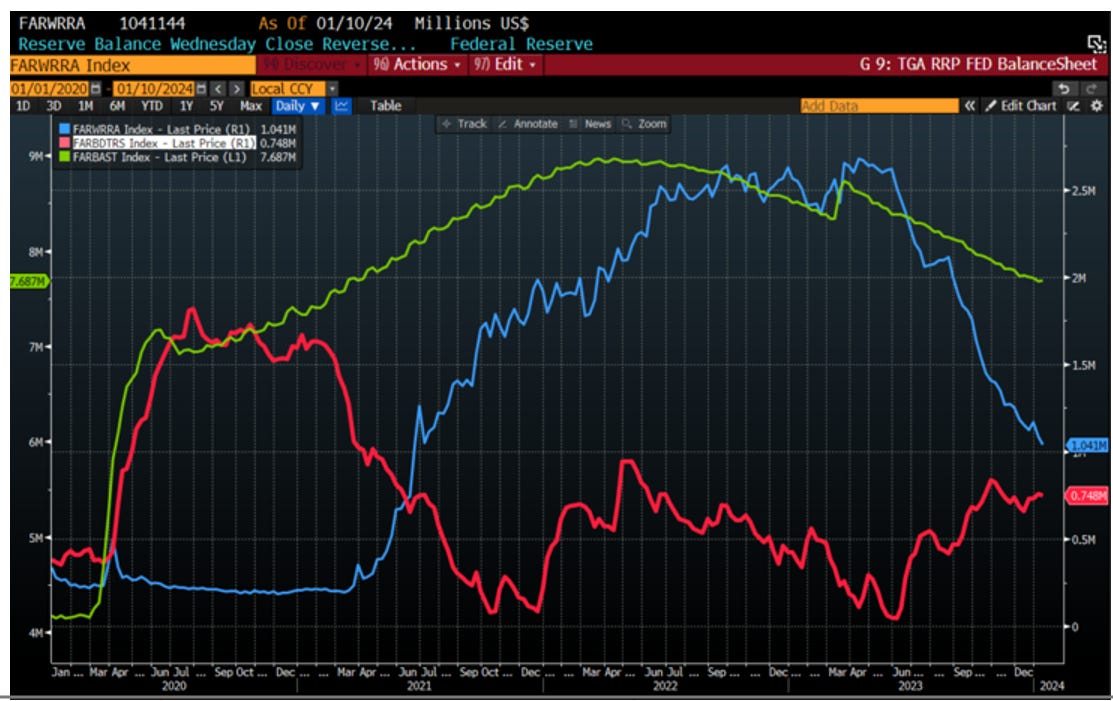
While the FED continues its Quantitative Tightening policy by reducing the size of its balance sheet, thanks to the decline of the Reverse Repo Program, net USD liquidity has been expanding since end of September. This provided additional support to the FED's Halloween sweet treat.
S&P 500 Index (Blue line) Versus USD Liquidity Index (Fed Balance Sheet – TGA - Reverse Repo Account) (Red line)
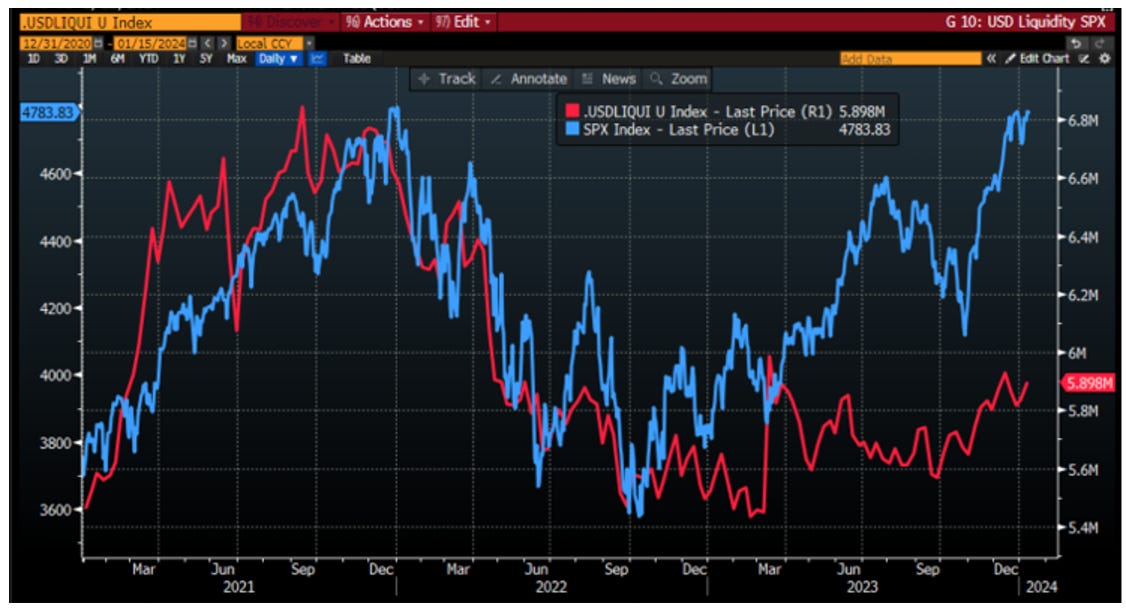
For equity investors, the significance of the Reverse Repo lies in its negative correlation with S&P 500 valuation. The unloved and unexpected 2023 equity bull market, heavily reliant on P/E expansion, coincided with the reduction of liquidity in the RRP and the injection of shadow USD liquidity. Until shadow liquidity can be injected into financial markets by reducing the RRP to 0 and/or using the TGA as of last Spring, equity valuation could continue to expand further. Only when this shadow liquidity injection disappears, equity investors will have to contend with massive headwinds, as earnings revisions are expected to remain lackluster.
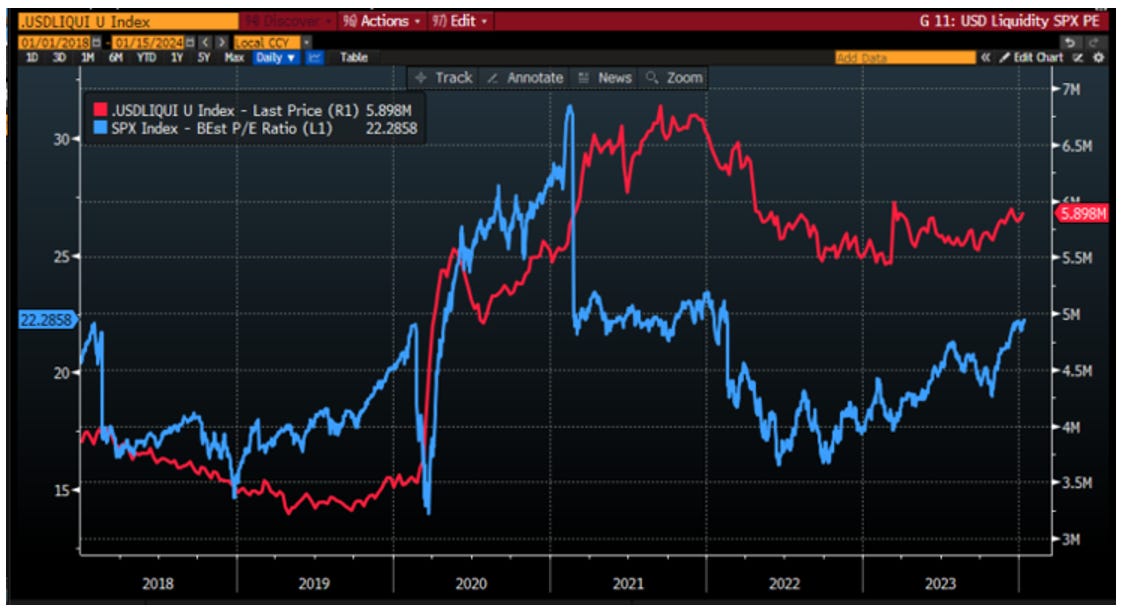
S&P 500 index 12-month forward P/E (blue line); USD Liquidity Index (red line).
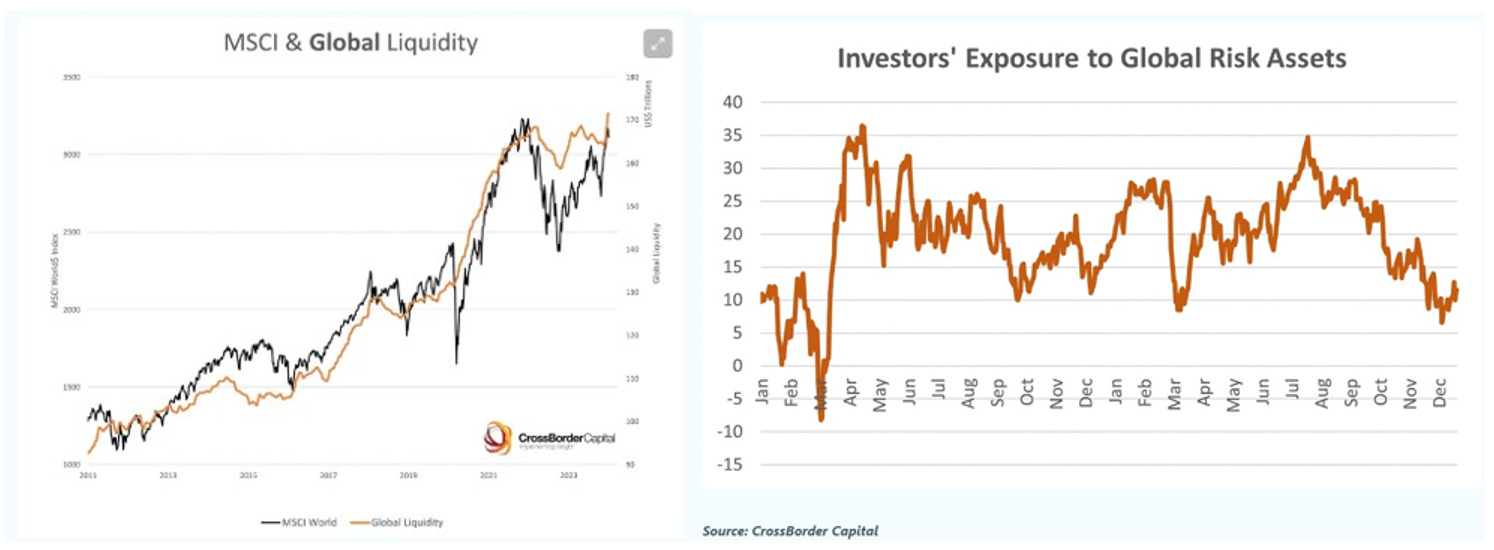
With the PBOC restarting liquidity injections into the Chinese economy, global liquidity levels have reached an all-time high of US$171.5 trillion. The recent +17.4% 3m annualized rate stands out compared to the 4% average recorded throughout 2023. While confirming that QT effectively ended in October 2022, the recovery in liquidity has been modest, with liquidity only 8% higher than the October 2022 low of US$158.8 trillion. Other central banks outside the FED and the PBOC are anticipated to join in as we progress through 2024. Overall, liquidity levels are expected to continue rising before reaching another cyclical peak in late 2025.

During the recent holiday period, collateral values improved, and bond market volatility decreased. This is attributed to enhanced collateral supporting liquidity, along with increased Central Bank liquidity. However, despite these positive factors, volatility remains relatively high, currently measured at 106.5 on the MOVE index. To further alleviate volatility, additional Central Bank liquidity is deemed necessary. The US Federal Reserve and People’s Bank of China are supporting the Shadow Monetary Base (SMB). The SMB's growth mirrors that of last March, when the FED intervened to stabilize financial markets during the SVB collapse. Although the latest nominal data shows a slight retreat of the SMB to US$91 trillion from the previous week's US$93.6 trillion, this can be attributed to the PBoC and seasonality. China’s Central Bank typically slows liquidity injections at the beginning of the year in anticipation of a boost around the Lunar New Year, set for February 10th this year.

The recent recovery in liquidity levels has been the catalyst for an improvement in risk asset values. Despite the improving liquidity backdrop and rising risk asset values, investors’ exposure to risky assets versus safe assets is low compared to the last two years. At current levels, global risk assets are compelling and especially as liquidity levels are rising.
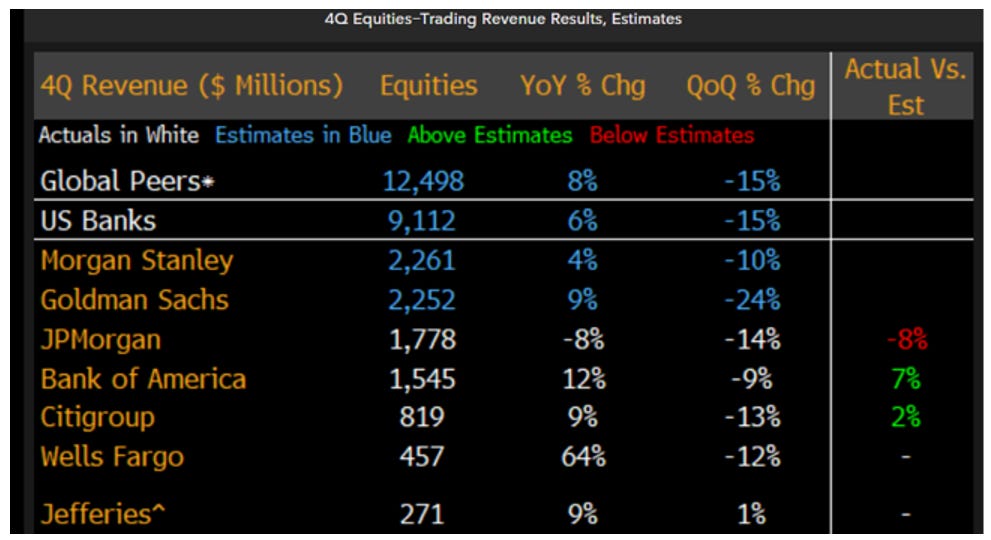
Regarding earnings, the earnings season started on a soft note as big banks like JP Morgan, Bank of America, Citigroup, and Wells Fargo failed to impress, with trading revenue falling short of expectations in Q4 2023. Disappointments also came from airlines, particularly Delta Airlines, which trimmed its full-year adjusted EPS forecast for 2024. The outlook indicates that Delta is not immune to the elevated costs and other challenges plaguing the industry, as supply chain shortages have increased engine repair times and slowed the delivery of some new aircraft.
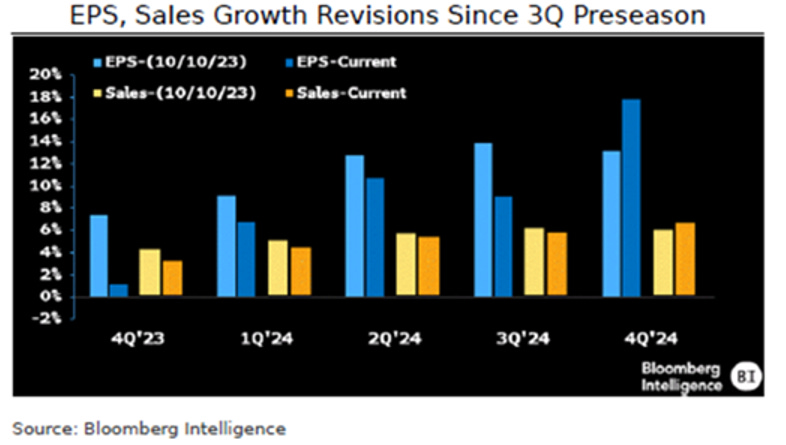
Looking ahead for the earnings’ season, despite better-than-expected results in 3Q, the outlook for 4Q has not improved, with forecasts worsening due to ongoing challenges in energy, health care, and materials sectors. As 3Q earnings unfolded, analysts consistently lowered estimates for the upcoming quarters, extending until at least 3Q24. While 3Q23 growth marked the end of the S&P 500's earnings recession, the forecast for 4Q23 growth is now meager at 1.1%, a decline from 7.4% just 3 months ago. Top-line growth was also revised downward from 3.7% to 2.8%. Among the notable contributors to these revisions are Pfizer, Merck, and Moderna, which have been significant drags on index estimates in the last three months.
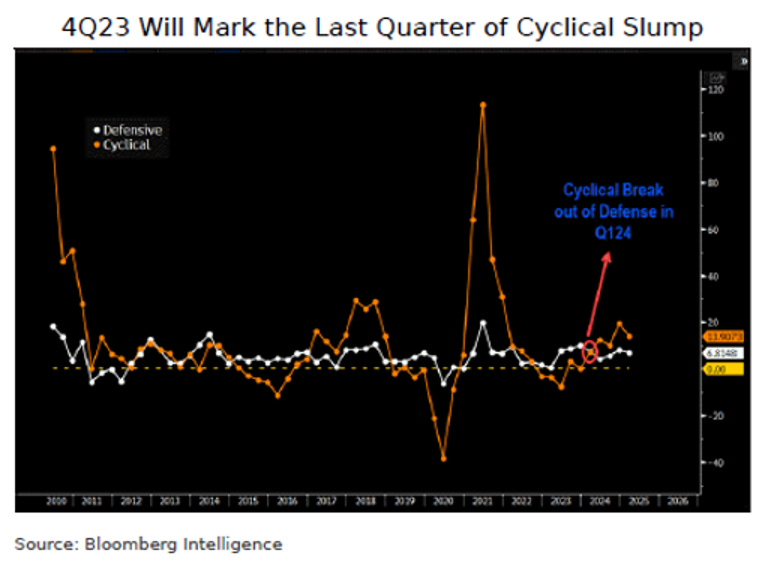
Cyclical sectors face pressure to meet high recovery expectations in the coming year, despite not expecting much in the near term. These sectors have lagged behind defensives in earnings growth for five consecutive quarters and are projected to report minimal YoY growth of 0.1% in 4Q23, compared to 10.1% for defensive sectors. However, by 2Q 2024, cyclical earnings are anticipated to outpace defensives for the first time since late 2022, with a growth rate of 12.3% versus 4.2%. This leadership in cyclical growth is expected to persist through at least 1Q2025, driven by sectors like energy, health care, and real estate experiencing forecasted growth, while consumer staples act as the primary drags on defensives.
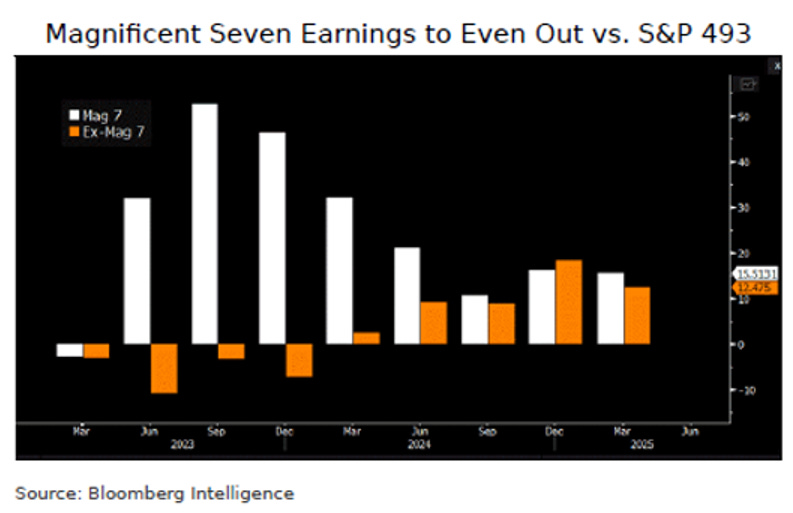
The 493 S&P 500 stocks, excluding the Magnificent Seven, are anticipated to show positive growth in 1Q2024, marking the first quarter of recovery after 4 quarters of shortfall. Earnings improvement is expected to extend to more companies throughout 2024. The Magnificent Seven (Apple, Amazon, Alphabet, Meta, Microsoft, Nvidia, and Tesla) led 2023 earnings growth, but by 2H2024, expectations suggest a more balanced scenario with 14% vs. 13% earnings growth compared to the rest. Earnings breadth has been recovering since 2Q2023, with the number of S&P 500 companies posting EPS growth increasing from 281 in 1Q to 310 in 3Q, and this trend is expected to continue in 2024.
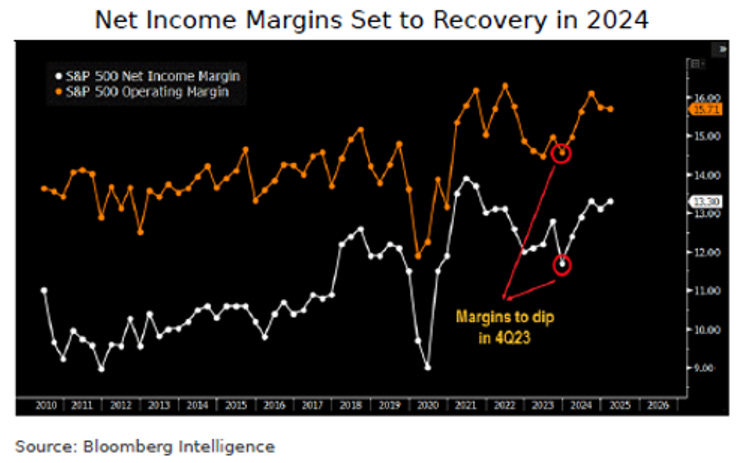
Margin forecasts project a swift turnaround from the challenging 4Q outlook in the coming 12 months. Net income margins, after three quarters of improvement, are anticipated to dip to 11.7%, a new post-Covid low, in 4Q. The operating margin is forecasted at 14.6%, the second-lowest value during this period. While both series are expected to rebound rapidly in 2024, they are unlikely to reach peak levels. In 4Q23, real estate, materials, health care, and consumer staples are expected to report the lowest net income margin post-Covid, with all, except real estate, projected to rebound in 2024. Consumer staples and materials sectors are poised to reach post-pandemic lows in operating margins in 4Q, and, along with health care, are projected to post 2024 average margins below the post-Covid average.
In conclusion, the upcoming earnings reporting season is poised for potential volatility, with outlook commentary serving as a key risk factor due to relatively modest expectations. Beyond the dominant performance of the Magnificent Seven stocks, the remaining S&P 493 are anticipated to witness a positive turnaround in EPS starting in 1Q. Additionally, cyclicals are expected to outpace defensive sector earnings, taking the lead as early as 2Q.
WHAT’S ON THE AGENDA NEXT WEEK?
Next week is expected to be relatively quiet on the macroeconomic front, with only US retail sales, industrial production, and consumer inflation expectations on the agenda during the shortened holiday week as the US markets will be closed on Monday for Martin Luther King Day. In fixed income, investors will keep an eye on a potentially interesting 20-Year Bond auction on Thursday. The earnings season will see the second leg of US banks' earnings releases, along with luxury goods manufacturers like Richemont and Burberry, which issued a dire profit warning for 2024 on Friday.

KEY TAKEWAYS.
As the first month of the year unfolds, the key takeaways can be summarized as follow:
The US CPI indicates the gradual return of the inflation boomerang.
Long-dated bond auctions confirm limited appetite for this asset class ahead of significant incoming supply needed to finance increased government spending before the presidential election.
To justify the current level of the US 10-year yield, the economy would have to experience a severe recession, which is unlikely as another rebound in the trampoline landing has started.
Current valuations of cyclical assets are attractive while those of long dated bonds valuations are not.
Would the economic coins flip to a return of inflation rather than recession, the US 10-Year Yield could move above last year high.
USD liquidity proxy remains a tailwind for more equity valuation expansion in the coming months.
With the PBOC restarting to inject domestic liquidity into markets, unloved risky assets outside the US are expected to outperform safe assets in the medium term.
EPS growth in 2024 is expected to favour the S&P 493 rather than the Magnificent 7 which will still benefit from rising inflows into equity markets.
In a stickier for longer economy, investor are better off holding equity of companies with low financial leverage and the ability to grow EPS and FCF above the inflation rate is the best way to protect their wealth.
Among sectors, the barbell portfolio (a mix of IT and Energy stocks) combined with quality companies benefiting from the reshoring narrative should remain the core of investors’ equity allocation.
In a world of structurally higher inflation, gold, and hard assets in limited supply, NOT government bonds, are expected to be the new 'antifragile assets which are still under owned by the majority of investors.
HOW TO TRADE IT?
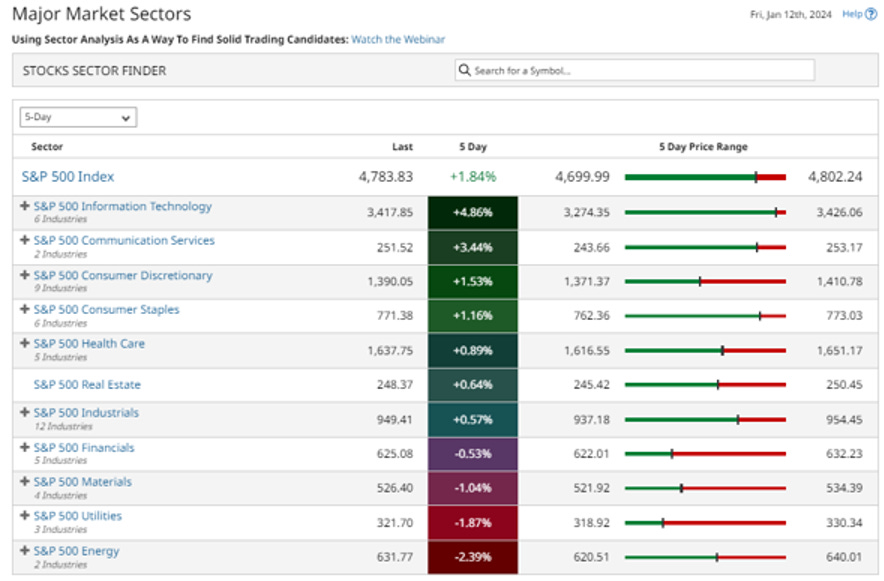
In the second week of the year, a "buy the dip" pattern emerged once again, with Nasdaq outperforming the Dow and the S&P 500. This rebound enabled the S&P 500 to achieve a positive year-to-date performance, while the Nasdaq and Dow are still showing mild negative returns for the year.

In terms of sector performance over the past week, growth sectors such as IT, Communication Services, and Consumer Discretionary regained the lead, while Energy failed to benefit from the deterioration of the geopolitical situation in the Middle East.
To gain exposure to sectors considered as inflation hedges, investors should consider Energy, Materials, and Industrials, which are expected to outperform once the consensus favours inflation over recession in 2024. Emerging markets with attractive valuations, such as Brazil, Mexico, and Indonesia, are also poised to benefit from higher commodity prices and increased liquidity issued by China to support its domestic economy.
At Macro Butler, our mission is to leverage our macro views to provide actionable and investable recommendations to all types of investors. In this regard, we offer two types of portfolios to our paid clients.
The Macro Butler Long/Short Portfolio is a dynamic and trading portfolio designed to invest in individual securities, aligning with our strategic and tactical investment recommendations.
The Macro Butler Strategic Portfolio consists of 20 ETFs (long only) and serves as the foundation for a multi-asset portfolio that reflects our long-term macro views.
Investors interested in obtaining more information about the Macro Butler Long/Short and Strategic portfolios can contact us at info@themacrobutler.com.
Unlock Your Financial Success with the Macro Butler!

Disclaimer
The content provided in this newsletter is for general information purposes only. No information, materials, services, and other content provided in this post constitute solicitation, recommendation, endorsement or any financial, investment, or other advice.
Seek independent professional consultation in the form of legal, financial, and fiscal advice before making any investment decisions.
Always perform your own due diligence.