THE WEEK THAT IT WAS...
As Americans celebrated another trick-or-treat season and Hindus celebrated Diwali, macro and micro investors remained on edge with the release of the October's Non-Farm Payroll report in the US and the PMI indices in the US and China. Investors were also closely watching the Bank of Japan meeting. On the earnings front, 162 companies from the S&P 500 released their quarterly reports, including five of the Magnificent 7 (Alphabet, Microsoft, Meta, Amazon, and Apple).
In China, October’s PMI defied the usual seasonal downturn, with the official PMI rising from 49.8 to 50.1, above the consensus of 49.9 and ending a contractionary stretch that began in May. The non-manufacturing PMI also edged up from 50.0 to 50.2, slightly below expectations of 50.3 but staying above the contraction-expansion line. While this data offers a first positive sign following the fiscal and monetary stimulus unleashed by the government before Golden Week, it is still insufficient to ‘Make China Great Again’ anytime soon.
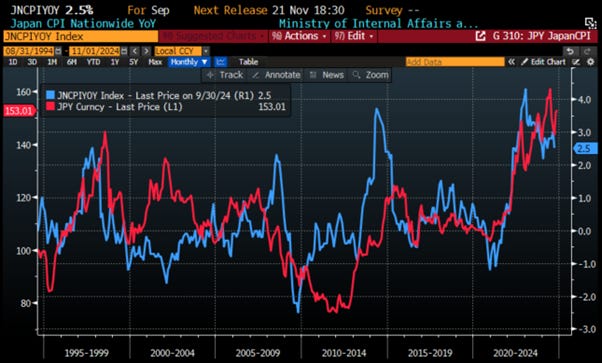
In Japan, as widely expected amid growing political instability, the Bank of Japan left rates unchanged at 0.25%, maintaining its view that it is on track to achieve its inflation target. However, it reiterated that it may need to hike rates, potentially as soon as December 19th, due to the inflationary impact of the weaker yen over the past month.
Japan CPI YoY Change (blue line); JPY/USD FX rate (red line).
In the US, based on the Government Domestic Product released less than a week before the presidential election, the US economy grew by 2.8% in Q3, slightly below the expected 3.0% but matching the Atlanta Fed's estimate. Key highlights include GDP sales growth rising to 3.0%, a jump in consumer spending to 3.7%, a deflator increase of 1.8%, and core PCE prices rising to 2.2%.
As the USA is increasingly rebaptized as the ‘United Socialist America,’ one number stands out: the rising contribution from government spending, which continues to grow as the current administration, like others, uses it to convince voters of their success. The US government has contributed to ‘growth’ for nine consecutive quarters, with Q3 seeing the largest addition in the past year, primarily driven, unsurprisingly, by federal spending.
The Federal Reserve's preferred inflation measure, the Core Personal Consumption Expenditures (PCE) Price Index, rose 2.7% year-over-year in September, matching August's increase and slightly exceeding the anticipated 2.6%. On a month-over-month basis, the Core PCE increased by 0.3%, indicating a slight acceleration in inflation, with notable upticks in durable goods and services costs.
The so-called Super Core PCE (services excluding shelter) rose 0.3% month-over-month, keeping the year-over-year increase steady at +3.2%, still well above the +2.0% year-over-year ceiling previously targeted by the Fed and Wall Street.
Notably, cyclical inflation remains stubbornly high, while the acyclical segment has returned to normal levels.
US San Francisco FED Cyclical Core PCE YoY Change (blue line); US San Francisco FED Acyclical Core PCE YoY Change (red line).
With the election around the corner and uncertainties not only about the country's future but also about upcoming fiscal and economic policies, it should be no surprise that sluggish demand weighed on the ISM Manufacturing index, which hit a 16-month low. The headline ISM Manufacturing PMI fell to 46.5 in October from 47.2 in September, below estimate of a rise to 47.3 and the consensus forecast of 47.6. Meanwhile, the ISM Manufacturing Prices Index spiked in October as both new orders and employment remained in contraction (below 50).
As widely expected by those who understand how the Non-Farm Payroll is calculated by the Bureau of Labor Statistics, October's report came in much lower than anticipated. The survey was conducted during the stormy period of hurricanes Helene and Milton, whose impacts could not be fully quantified by the Bureau. Beyond the hurricane effects, the Boeing strike likely contributed partly to the loss of 46,000 jobs in the manufacturing sector and a decline of 28,000 in private payrolls. In contrast, education and other government-related jobs, which do not directly contribute to wealth creation and for government are related to tightening regulations and reducing the efficiency of the economy, continued to show the most job growth in October.
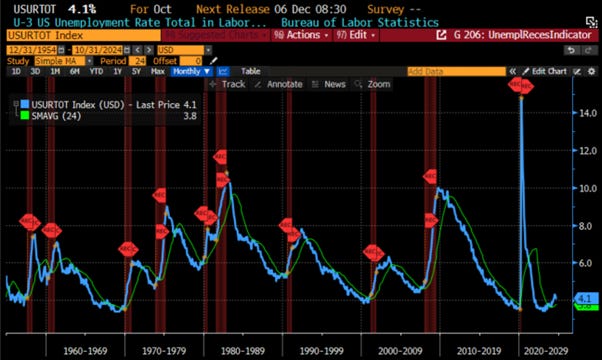
Less affected by Excel adjustments and propagandistic revisions by zealous civil servants, the unemployment rate remained steady in October at 4.1%, in line with expectations and still well above the 2-year moving average. Historically, this level has been a leading indicator that the U.S. economy may be nearing a shift from boom to bust.
US Unemployment Rate (blue line); US Unemployment rate 2-year moving average (green line) & US Recessions.
In this context, Wall Street still has to realize the FED's impotence in an economy driven solely by government spending, which will inevitably harm consumers and investors. Therefore, it is not a surprise that the Wall Street consensus still expect 2 additional FED rate cuts by the end of the year with 82% probability and 5 rate cuts in 2025. Seasoned investors must remember that inflation-driven misery stems not primarily from the FED, but from reckless regulations imposed by politicians pushing to ‘build back better’ for the kleptocrats and kakistocrats of the world. In this context, whether the FED cuts rates remain almost irrelevant; the real issue is stopping those who mismanage the economy under the pretence of climate change and DEI while fuelling forever bankers’ wars to enrich their plutocratic allies. Regardless of who occupies the White House next, Powell and his PhD colleagues know that interest rates always rise during wartime. The misguided Wall Street bankers will once again be wrong in thinking rate cuts will solve economic problems, which will only worsen under ‘Kamunism.’
Unless you’ve been living under a rock or in a cave with no access to the internet or any type of press, even the propagandistic, fake-news mass media that perpetuates the illusion of Western democracy, November 5, 2024, is expected to be the D- day in what has already been a year of political hell. The Western world, governed by a republic system that often serves to enrich plutocrats close to the deep state, is at a critical juncture. Recent data from the betting markets, which remain among the least biased sources since they’re less easily influenced by the propagandistic narratives, offer a clearer view of the political and economic agendas truly at play.
While the probability of a Red Sweep has declined over the past week, the real question is how much of this scenario has already been priced in by markets before things potentially turn contentious after November 5th.
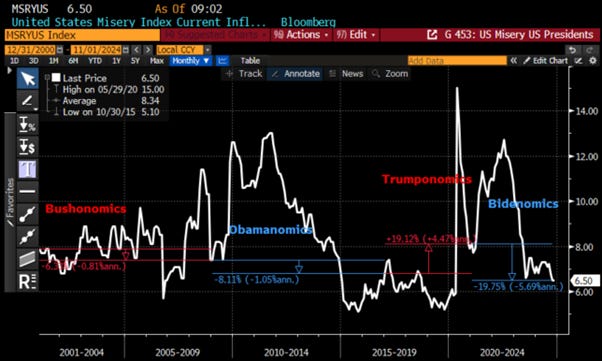
Rather than being swayed by the propagandistic noise from both candidates about their track records in leading, directly or indirectly, over the past eight years, and to avoid the echo of numerous speculations spread by financial media with political and financial interests misaligned with their audiences, a closer look at economic data from the Trump presidency (January 2017 to January 2021) and the Biden presidency (January 2021 to October 2024) offers a clearer picture. Indeed, everyone knows that contrary to politicians and banksters, numbers never lie. Looking at inflation, which affects consumers, voters, and investors alike, is a far better indicator than any political propaganda to look at how the presidents and what we can expect they will do. It doesn’t take a financial expert to see that ‘Bidenomics’ has had a much more painful impact on consumers' wallets than ‘Trumponomics’ 1.0 in terms of inflation, even being proxied by the propagandistic ‘CP-Lie’.
Rather than GDP, most understand that the Misery Index, a combination of the unemployment rate and the year-over-year change in the Consumer Price Index (CPI), provides a better gauge of economic health. Admittedly, while Trump’s term was impacted by the economic fallout of the COVID pandemic, it's true that US misery under Biden has declined since the start of his term. However, this improvement followed a roller coaster of challenging years for US consumers, especially in 2021 and 2022.
Examining inflation-adjusted retail sales, a better indicator of US consumer health since it removes inflation’s impact on nominal retail data, reveals that while consumers experienced a volatile period under Trumponomics 1.0 due to COVID lockdowns, real growth under Bidenomics has been modest. Despite media reports touting the strength of the US consumer, inflation-adjusted retail sales have grown by barely 1.0% under the mandate of the 46th US president.
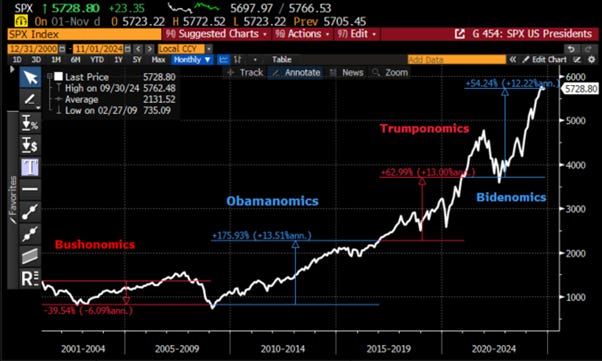
At the end of the day, for investors, the crucial factor isn’t which party dictates the rules of the game, but rather how those rules impact the performance of their financial assets. Notably, despite periodic black swan events, independent of who occupies the White House, the S&P 500 has delivered an impressive average annualized nominal return of 13% over the last three presidencies, regardless of party affiliation.
For fixed income investors, life has been much less favourable under Biden than it was during Trump’s term or even during the Obama presidency.
While the Biden presidency will be remembered in financial history as a period of reckless government spending aimed at addressing the climate change agenda, which was created for geopolitical reasons to please the deep state in its fight against the mercantilist global south, the reality of the mathematics is that, on an annualized percentage rate of change, Bush, Obama, and Trump increased public debt at a much faster rate than Biden.
A quick look at the evolution of the USD under the last 4 US presidents shows that, despite imposing tariffs for the first time since the world became globalized, the last Trump presidency saw a decline of around 9.0% in the USD index. In contrast, the weaponization of USD assets under the Biden administration resulted in an increase of over 15% in the USD index, as investors, despite the ongoing ‘de-dollarization’ environment, continued to allocate assets within the USD system to preserve their wealth from the destruction associated with the wars initiated in Eastern Europe and the Middle East during Biden's tenure. Investors must understand that as the global south begins to trade internally outside the USD system, it reduces the availability of USD to repay its stockpiles of USD-denominated debt. This scarcity of USD relative to other currencies creates a premium for the dollar against other fiat currencies in general. In this case, it is likely that before disappearing as the reserve currency of the world, the USD will make new all-time highs against other fiat currencies.
For commodity investors, examining the performance of crude oil under the last two US presidents reveals key insights. During Trump's presidency, pragmatic geopolitical policies and the impact of COVID-19 on oil demand, severely affecting mobility, resulted in oil prices ending slightly down from where they started, despite high volatility. In contrast, Biden's administration has contributed to rising geopolitical tensions worldwide and implemented more restrictions on shale oil production. Therefore, it should come as no surprise that Biden's tenure is shaping up to be one of the most profitable for oil investors accustomed to wild price swings throughout business cycles. However, in the context of a heating war cycle and rising geopolitical tensions, oil investors should not be concerned by either 'Drill Baby Drill' or 'Kamunism.'
The other commodity that is important not only for commodity investors but also for asset allocators assessing market data to determine the state of the business cycle and how to allocate portfolios appropriately is, of course, gold. Unsurprisingly, since Biden will be remembered for the weaponization of USD assets, he will be remembered in history books as the US president who altered the confidence of people in governments, in the US and abroad. It is therefore no surprise that Bidenomics has been very favourable to those investors who understand that only physical gold stored in a secure private vault is an asset with no counterparty risk and offers a genuine hedge against reckless government behaviour regarding monetary, fiscal, and freedom policies.
By now, investors are certainly aware of the importance of the business cycle on asset allocation and, ultimately, the performance of their portfolios. As we have shown previously, the business cycle, which oscillates between economic boom and bust, as well as between inflation and deflation, can be better understood by looking at simple market indicators such as the S&P 500 to oil ratio and its position relative to its 7-year moving average (to determine if the economy is in a boom or a bust) and the gold to U.S. Treasury ratio and its position relative to its 7-year moving average (to know if the economy is in an inflationary or deflationary phase).
Examining the evolution of the S&P 500 to oil ratio relative to its 7-year moving average during the last 4 US presidencies, we can conclude that the ratio fell below the 7-year moving average at the start of Bush's mandate in February 2002, and the economy remained in a bust mode until February 2013 under Obama, which delivered a booming US economy to Trump. He maintained the US economy in a boom phase throughout his term, despite the wild ride related to the COVID pandemic and its impact on supply chain disruptions. In contrast, the Biden presidency was much more chaotic, as the US economy oscillated between boom from January 2021 to bust in February 2022, moving into a bust between February 2022 and March 2023 before moving back decisively into a boom since November 2023.
Looking at the other ratio that matters for describing the business cycle and how to allocate portfolios, the gold to US Treasury index and its position relative to its 7-year moving average, it is clear that the ratio crossed above its 7-year moving average in October 2003. The US economy remained in an inflationary mode from then until October 2013 under Obama, who delivered a deflationary economy to Trump in early 2017. Trump inflated his way out of this situation in July 2019, and since then, the inflationary environment has only worsened due to reckless government spending under Biden and his Keynesian agenda.
Savvy investors understand that the use of fiat currencies in an inflationary environment can create a monetary illusion. To dispel this illusion, they should monitor the trend in the S&P 500 to gold ratio and its position relative to the 7-year moving average. When the ratio trades below the moving average, it has rarely been a good omen for the economy and financial markets in general. Examining the evolution of this ratio over the last four US presidents reveals that it broke below the 7-year moving average in April 2002 under Bush and remained in this environment until August 2013 under Obama. During ‘Trumponomics 1.0’, the ratio stayed above the 7-year average and was relatively stable, except for the episode of the COVID Crash in Q1 2020. Since then, under ‘Bidenomics’, the ratio rose above its 7-year moving average until it recently fell below it in October 2024, a signal that should keep all investors alert about what is to come, regardless of who occupies the White House next.
In a nutshell, as Americans head to the polls, the US economy is still in an inflationary boom. However, the S&P 500 index to gold ratio has just crossed below its 7-year average, which has seldom been a good omen for the U.S. economy. This trend has historically pushed the economy into a bust, and in the current case, it is almost certain to lead to an inflationary bust.
This upcoming inflationary bust will most likely be triggered by escalating in the war cycle in the Middle East whoever the next tenant of the White House as everyone with a minimum of understanding about how Washington works and who controlled power has too much interest in spreading further the forever bankers’ wars.
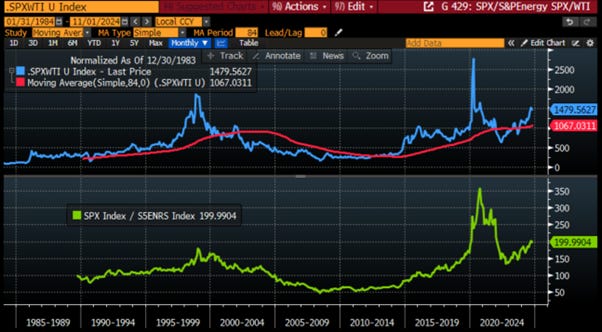
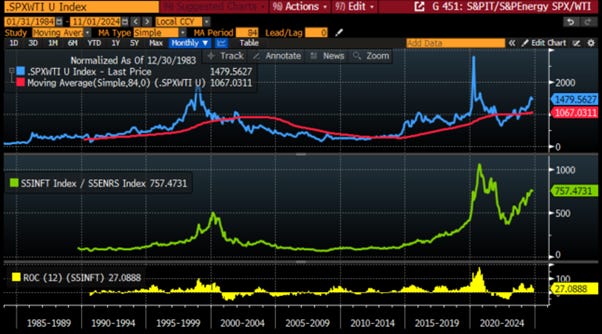
Rather than writing thousands of pages like investment bankers do to explain how the results of the upcoming elections could impact portfolio allocation based on political and partisan views, it is better to look back at history. In this regard, investors must remember that history shows that once the S&P 500/WTI ratio breaks below its 7-year moving average, regardless of who is in charge at the white house and what Wall Street analysts or uninformed Wall Street parrots may claim, the reality is that every equity rally should be sold.
Upper Panel: S&P 500/WTI ratio (green line); 84 months Moving average of the S&P 500/ WTI ratio (red line); Lower Panel: S&P 500 index 12-month Rate of Change (yellow histogram).
Once this happen, and while this will probably be denied by wall street bankers and parrots who are still spreading the climate change scam, Investors should then focus on buying the dips in energy producers while selling the strength in energy consumers.
Upper Panel: S&P 500/WTI ratio (blue line); 84 months Moving average of the S&P 500/ WTI ratio (red line); Lower panel: Relative performance of S&P 500 Index to S&P 500 Energy Index (green line).
Indeed, once again, history shows that if this new environment unfolds, and despite what probably what Wall Street bankers, and their parrots will tell their clients to do, once the S&P 500 to oil ratio breaks below its 7-year moving average, it will mark the end of the outperformance of energy consumers, which can be proxied by the IT sector, and a rotation into energy producers, which can be proxied by the Energy sector. Investors should also note that historically, once the S&P 500 to oil ratio breaks below the 7-year average, the 12-month rolling rate of change of the IT sector peaks and turns negative until the next breakout of the S&P 500 to oil ratio above its 7-year average.
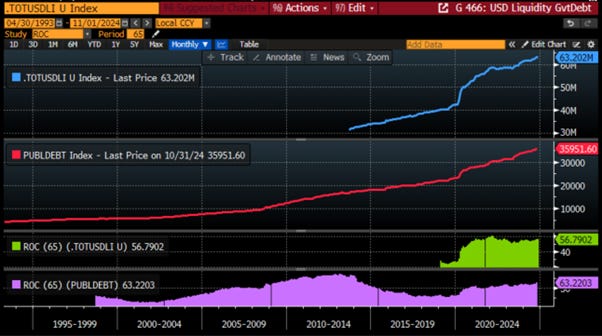
Having said all that, savvy investors also know that beyond the state of the business cycle, the evolution of the liquidity cycle is what also matters. As shown before, regardless of who is the next tenant of the White House, investors should now understand that the liquidity cycle, which historically lasts for 65 months, will peak in late 2025.
The peak of the liquidity tsunami will coincide with a wave of debt refinancing as both candidates, Trump and Harris, agree on one key issue: increasing US government debt. Both favour spending trillions more annually than the federal government collects in taxes to appease certain groups, including the disadvantaged and wealthy bankers. Additionally, they both support military action against countries that pose no threat to US national security, often for reasons that seem domestically popular or financially beneficial and with the ultimate goal to keep the US imperialism imposing its world order to the rest of the world. Both candidates indeed want to spend more on the Pentagon than the next 10 countries combined spend on their militaries.
Ultimately, neither candidate appears to uphold the values enshrined in the US Constitution, with one even proposing amendments to the First Amendment, which guarantees freedom of speech, and the Fifth Amendment, which ensures the right to a fair trial, to allow for corporal punishment by local police and federal agents at crime scenes.
https://constitution.congress.gov/constitution/amendment-1/
This means that regardless of who the next tenant of the White House is, what really matters is how much shadow liquidity is injected into the financial system to address the rising debt refinancing challenges ahead of us.
Proxy of USD Liquidity Index (blue line) & 65-month Rate of Change (green histogram); US Government debt (red line) & 65-months Rate of Change (purple histogram).
Ultimately, the 47th US president should focus on creating a regulatory and social environment that boosts economic growth rather than issuing more debt to finance government spending, which will never yield sustainable growth. This spending will only continue to enrich those plutocrats within the president’s sphere, regardless of party affiliation, as has been the case since September 2015 when US government debt surpassed the total nominal GDP.
US GDP Nominal Dollars (blue line); US Treasury Total Public Debt Outstanding (red line).
Coming back to the election, anyone with a basic understanding of the US election system knows that the road to the White House involves securing more than 270 grand electors, which are distributed across the 50 states of the United States based on population density. It is also well-known that the election battleground can be summarized around seven 'swing states', Nevada, Arizona, Wisconsin, Michigan, Pennsylvania, North Carolina, and Georgia , which will determine who will be the next tenant of the White House.
What investors and voters may overlook is that the probability of neither of the two candidates receiving more than 270 votes in the Electoral College is non-trivial. Despite having campaigned alongside Trump over the past few months, Robert J. Kennedy Jr. remains on the ballots in 17 states and could still play an unintentional role in the election results. If none of the candidates has 270 votes in the Electoral College by January 6th, the election will be called a 'contingent election’.
https://www.newsweek.com/robert-f-kennedy-jr-rfk-ballot-election-1938599
Contingent elections have occurred three times in U.S. history: 1801, 1825, and 1837. The 1800 presidential election saw Democratic-Republicans Thomas Jefferson and Aaron Burr tied with 73 electoral votes each, while Federalist John Adams received 65 votes. Under the original Constitution, each elector cast two votes, leading to the tie because both parties mismanaged their strategies. When the House of Representatives chose the president, neither party had a majority due to split state delegations. Over seven days and 35 ballots, Jefferson received consistent support from eight delegations but fell short of a majority. On the 36th ballot, with Federalists casting blank votes, Maryland and Vermont switched to Jefferson, securing his victory. This election led to the Twelfth Amendment, which established separate elections for president and vice president.
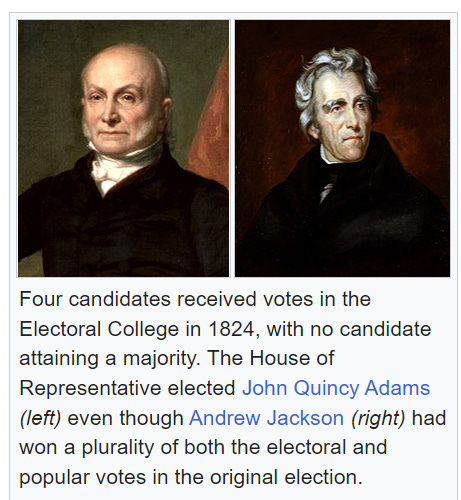
The 1824 presidential election, ending the Era of Good Feelings, featured four Democratic-Republican candidates: Andrew Jackson, John Quincy Adams, William H. Crawford, and Henry Clay. Jackson had the most votes but fell short of the 131 needed for a majority, leading to a contingent election in the House of Representatives. Only the top three candidates, Jackson, Adams, and Crawford, were considered. Clay, the eliminated candidate, supported Adams, who won the presidency on February 9, 1825, with 13 state votes. Jackson, having received a plurality, was outraged. Adams' appointment of Clay as Secretary of State sparked accusations of a "corrupt bargain," which fuelled Jackson's victory in the 1828 rematch against Adams.
In the 1836 presidential election, Democratic candidate Martin Van Buren and his running mate Richard Mentor Johnson secured enough popular votes to gain a majority in the Electoral College. However, Virginia's 23 electors became faithless and did not vote for Johnson, leaving him one vote short of the 148 needed for election. Consequently, a contingent election was held in the Senate to choose between Johnson and Whig candidate Francis Granger. Johnson was elected easily in a single ballot, receiving 33 votes to Granger's 16.
In a nutshell, when a contingent election occurs in the United States, it means that no presidential or vice-presidential candidate has received a majority of the electoral votes (currently 270 out of 538). In such cases, Article Two, Section 1, Clause 3 of the U.S. Constitution, modified by the Twelfth Amendment, outlines the process: the House of Representatives selects the President from the top three presidential candidates, with each state delegation voting as a bloc (one vote per delegation). A candidate must secure a majority of state delegation votes (currently 26) to be elected President. The Senate chooses the Vice President from the top two vice-presidential candidates, with senators voting individually. A majority of the full Senate (currently 51 out of 100) is required for election. On a side note, everyone must remember that as the current sitting Vice-President, Kamala Harris will be the one who will have to certify the results of the November 5th election and as a member of the Senate she could also be the one with the decisive vote in selecting the next US Vice President.
https://constitution.congress.gov/browse/article-2/section-1/
This scenario raises the possibility of the President and Vice President coming from different parties. For example, the 47th US President could be Trump, while the Vice President could be Tim Walz, or vice versa, with Kamala Harris as President and J.D. Vance as Vice President. Such outcomes would inevitably lead to an ungovernable situation, exacerbating divisions between red and blue states and accelerating the disunion of the U.S., which seems already increasingly inevitable.
When he isn’t joking about frying French fries at McDonald’s or driving a garbage truck, Donald Trump occasionally references William McKinley, the 25th U.S. president, known for his commitment to protectionist policies. Serving from 1897 until his assassination in 1901, McKinley championed high tariffs to shield American industries from foreign competition. His support for the Dingley Tariff Act of 1897, which reversed the lowered tariffs of 1894, led to the highest protective tariffs in US history at the time, initially averaging 52%. This act boosted U.S. manufacturing and labour, aligning with McKinley’s vision of economic growth through industrial strength. The Dingley Tariff remained the primary tariff policy until 1909.
Investors and voters who have probably never read the US Constitution must understand that the reality of how the US president is elected is not only dependent on the results of the November 5th election and/or any potential contingent outcomes but also on the decisions made by the current sitting president. Indeed, the 46th US president could declare martial law, as occurred on December 7, 1941, in Hawaii when Governor Poindexter used the aftermath of the Pearl Harbor attack to suspend the writ of habeas corpus and delegated all his powers as governor to the local commanding general of the Army. Based on previous decisions made by the US Supreme Court (i.e., SCOTUS), martial law is not established by any official authority outside of the sitting president. Rather, martial law arises from necessity. In this context, investors, voters, and every citizen must understand that, while highly controversial, Joe Biden could justify a declaration of necessity if Russia, China, North Korea, or Iran were to declare war or attack before the election, or in the ‘lame duck period’ until January 20th. Consequently, the Democrats, under the influence of neocons who are unelected and disregard the constitution, could carry out a coup, suspend the election, and seize control of the country, similar to what Zelensky did in Ukraine under the same rationale. They would need to close all courts, including the Supreme Court, out of necessity, whether real or manufactured. After that, Joe Biden would only need to resign as president on January 20th or before, likely arguing that he is not physically or mentally fit to be a "War President." This would make Kamala Harris the ‘de facto president’ of the US, fulfilling the requirement to transfer power before January 21st of the year following the 4-year election cycle.
While US laws require a lengthy process involving the President, House, and Senate, often needing bipartisan support, presidents can also govern via executive orders, which carry the force of law but only bind the executive branch. These orders allow presidents to direct agencies to advance policy priorities without Congress, though they are subject to judicial review to ensure constitutional authority. For example, Trump’s border-wall order was challenged in court for overstepping spending authority, and Biden later rescinded it. Without a court ruling, only a president can reverse an executive order, though Congress can pass legislation to override it.
If elected, Trump may use executive orders to halt or reshape financial regulations established under the Biden administration, potentially pausing key rules like the Basel III Endgame for major banks or the CFPB’s tech oversight proposal. He could also freeze agency budgets and prompt the Medicare agency to pursue deep drug price cuts within the Inflation Reduction Act framework, while considering reference pricing for Part B drugs to standardize costs based on lower pricing benchmarks.
If re-elected, Trump may issue a second executive order targeting Section 230, the liability shield for internet companies. While a prior 2020 order urged the FCC to limit this shield, the agency took no action. A renewed push could increase litigation costs for Meta, Alphabet, and Snap if more cases proceed to trial. However, unless the FCC takes an assertive stance and withstands expected court challenges, the impact on these companies is likely to be limited.
In a nutshell, 'Trumponomics 2.0' would likely benefit Financials and Healthcare. Even if with potential cooperation from RFK, investors should expect the golden days of Big Pharma to be over. The same could apply to Big Tech and Big Food, though with Elon Musk possibly involved in the administration, ‘Trumponomics 2.0’ may target Big Tech while introducing fiscal measures to support small gig entrepreneurs, helping them reach new growth levels.
If there is one thing that seems clear from here, it is that with the highly uncertain results of the election and the possibility of those results being delayed until January 6th or even later, financial markets have been pricing for a smooth and rosy outcome of the election process. Given the non-trivial probability that the election could be simply cancelled, regardless of whether it is contested or contingent, volatility in financial markets will inevitably rise much higher than its pre-election levels. While equity volatility, as measured by the VIX index, has been relatively stable so far, we have already seen a spike in the bond volatility index (MOVE Index).
ICE BofA Move Index (blue line); Chicago Board Options Exchange Volatility Index (red line) & Spread (lower panel).
This has seldom been a good omen for equity and bond investors. For bond investors, higher volatility in the bond market, likely exacerbated by the increasing ownership of US government debt by hedge funds trading on margin, will inevitably translate into MUCH HIGHER long-dated yields, regardless of the economic data published until investors know who the next tenant of the White House is.
ICE BofA Move Index (blue line); US 10-Year Yield (red line) & Correlations.
For equity investors, higher volatility in the bond market has similarly seldom been a good omen for equity performance in the subsequent 12 months.
S&P 500 index (blue line); ICE BofA Move Index (axis inverted; red line); Correlations (middle panel) & 12-months Rate of Change of the S&P 500 index (lower panel; Yellow histogram).
Circling back to the S&P 500/gold ratio and its evolution around the 7-year moving average, as this ratio serves as a major driver of the business cycle, acting as a leading indicator for the S&P 500 index to oil ratio. When the S&P 500 to gold ratio breaks below its 7-year moving average, as it just did a few weeks ago, it typically signals a period of significantly higher volatility in the bond market. This aligns with the common-sense belief that the bond market is sniffing that the upcoming period of inflationary bust will not be an ideal time to be invested neither in long-dated bonds nor in equities.
S&P 500/Gold ratio (blue line); 84-months moving average of the S&P 500/Gold ratio (red line); ICE BofA Move Index (axis inverted; green line).
In a few words, Wall Street has been pricing in a smooth and rosy outcome for the D-day of the year of political hell. However, the reality is that this outcome has a very low probability of occurring. Anyone with a modicum of common sense would agree that the Washington warmongers, who have been enriching their plutocratic friends over the past four years, and even longer by perpetuating ‘forever banker wars’, are unlikely to relinquish their benefits easily. This means that investors will have to contend with significantly more volatility in the coming months, regardless of who is expected to be the 47th US president.
Moreover, while the US is still in an inflationary boom, the probability of the US economy shifting into an inflationary bust is rising and is slowly becoming the core scenario for 2025 and beyond. In this environment, with institutional investors still fully invested in equities and lacking hedges against the headwinds of the election results, the risk-reward ratio for being long stocks over the next few months appears unattractive. Many investors remain overly complacent about the political, geopolitical, and economic developments that will unfold before the world knows the name of the next U.S. president.
S&P 500 Index (blue line); CFTC S&P500 Institutional Asset Managers Allocation (red line); 12-months Rate of Change of S&P 500 Index (lower panel; yellow histogram).
Finally, while there has been a lot of garbage in this US presidential election, outside any partisan views, as the Media Research Center highlighted, evening news coverage of the presidential race has shown an unprecedented display of biased journalism. Since July, when Joe Biden exited the race, ABC, CBS, and NBC have provided Kamala Harris with 78% positive coverage, compared to only 15% neutral or positive coverage for Donald Trump.
WHAT’S ON THE AGENDA NEXT WEEK?
As U.S. daylight saving time ends, the first full week of November will see investors focusing not only on the US presidential election but also on another FOMC meeting, the release of the ISM Non-Manufacturing Index, and another set of University of Michigan Consumer Inflation Expectations and Consumer Sentiment indicators. This week marks the second and nearly final leg of the 'Super Bowl' of the Q3 2024 earnings season, with 264 companies in the S&P 500 index reporting quarterly results, including Berkshire Hathaway, Palantir, Qualcomm, and Cameco among others.
KEY TAKEWAYS.
As Americans bank their votes to choose their 47th president, here are the key takeaways:
The counter-seasonal rebound in China’s PMI indices, while positive, clearly does not provide enough evidence that the government will ‘Make China Great Again’ anytime soon.
In Japan, the Bank of Japan’s delicate balance between managing political instability and currency debasement aims only to delay, as long as possible, the inevitable financial doom loop that will have repercussions far beyond its shores.
The latest Government Domestic Product index reveals not only how government spending continues to fuel economic growth with borrowed funds but also signals that the US is slowly but inevitably transitioning from an inflationary boom into an inflationary bust.
The November ISM Manufacturing report adds to the growing list of indicators suggesting that the US is gradually shifting from an inflationary boom to an inflationary bust, regardless of who the next occupant of the White House may be.
The November Non-farm payrolls will likely give the FED reason to cut rates once again, though it should be clear that the FED's actions have become increasingly irrelevant, as fiscal rather than monetary policy is now driving the bond market and the economy.
Instead of being distracted by political garbage rhetoric from both candidates, examining economic data from the Trump presidency and the Biden presidency provides a clearer picture of their impacts on inflation and consumer health.
While Trump’s term faced challenges from the COVID pandemic, the Misery Index and inflation-adjusted retail sales suggest that 'Bidenomics' has delivered modest growth for consumers, albeit with the more painful effects of significantly higher inflation compared to 'Trumponomics 1.0'.
For investors, the key focus should be on how policies impact asset performance rather than which party holds power, as shown by the S&P 500's average annualized nominal return of 13% over the last three presidencies, irrespective of party affiliation.
The Biden presidency has been less favourable for fixed-income investors, driven in part by reckless spending on climate change initiatives.
For investors seeking a bipartisan perspective on what's ahead, both U.S. presidential candidates appear poised to increase government debt, one by reducing taxes, the other by further expanding government intervention, edging closer to a ‘United Socialist America’ whoever is the next US president.
In the current intensifying war cycle, oil investors need not be overly concerned with either ‘Drill Baby Drill’ or ‘Kamunism.’
As Americans head to the polls, the US economy remains in an inflationary boom; however, the S&P 500 to gold ratio dropping below its 7-year average historically signals an impending shift toward an inflationary bust.
The impending inflationary bust is likely to be triggered by escalating conflicts in the Middle East, regardless of who occupies the White House, as those familiar with Washington's dynamics recognize the vested interests in perpetuating ongoing ‘forever bankers' wars.’
Given that the result of the election of the 47th president may take days, weeks, or possibly months to be announced, the inevitable winner of this election is volatility, which will rise for both bonds and equities, regardless of who becomes president.
As the US is about to shift from an inflationary boom into an inflationary bust, every equity rally should be sold, and investors should focus on buying the dips in energy producers while selling the strength in energy consumers.
In such environment, investors will once again need to focus on the Return OF Capital rather than the Return ON Capital, as stagflation spreads.
Physical gold remains THE ONLY reliable hedge against reckless and untrustworthy governments and bankers.
Gold remains an insurance to hedge against 'collective stupidity' and government’ hegemony which are in great abundance everywhere in the world.
With continued decline in trust in public institutions, particularly in the Western world, investors are expected to move even more into assets with no counterparty risk which are non-confiscable, like physical Gold and Silver.
Long dated US Treasuries are an ‘un-investable return-less' asset class which have also lost their rationale for being part of a diversified portfolio.
Unequivocally, the risky part of the portfolio has moved to fixed income and therefore rather than chasing long-dated government bonds, fixed income investors should focus on USD investment-grade US corporate bonds with a duration not longer than 12 months to manage their cash.
In this context, investors should also be prepared for much higher volatility as well as dull inflation-adjusted returns in the foreseeable future.
HOW TO TRADE IT?
With only two trading days left before this year’s ‘political hell’ D-Day, the story of the past week was one of stock and bond market chaos. With a much weaker, largely weather-related Non-Farm Payroll, three of the "Magnificent 7" disappointed on guidance, prompting all three major equity indices to retest their respective 50-day moving averages over the past five days. Unsurprisingly, the Nasdaq, which appears to have printed a double top last week, underperformed the S&P 500 and the Dow Jones. As Americans head to the ballot box, it’s worth noting that all three major US equity indices confirmed a bearish reversal last week, a pattern that held at the close of the week despite a technical rebound in the final hour.
With media attention on the war cycle receding, a false sense of calm continues to lure institutional and retail investors into equities. However, the upcoming November 5th election should make everyone being on their toes. The prospect of a ‘buy the rumor, sell the news’ event is looming, especially if post-election surprises bring harsh economic policies under a "Kamunism" era for the next four years or if election results are delayed to January 6th or beyond instead of being announced on election night. In this environment, investors should brace for heightened volatility in the equity and bond markets that could drive equity markets back to, or even below, their August 5th lows post-election.
While any investor with common sense should prepare for reflation and an inevitable sector rotation in the coming months, last week's performance highlights once again the outperformance of growth sectors such as Communication Services and Consumer Discretionary. Meanwhile, IT underperformed with Real Estate and Utilities.
After November 5th, American voters can be sure of one thing: public debt will continue to increase whoever is chose as the 47th president of the country.
While anyone with a modicum of common sense knows that more government debt and spending has never been a way for an economy to avoid an economic bust, since governments are by nature inefficient, wasting resources due to their lack of accountability to voters and absence of shareholders, ‘Kamunism’ preaches that increased government regulations and spending will solve the problems of the US middle class while ‘Trumponomics’ claims that ‘tariffs’ will solve everything in American every day’s life.
Reading the words of the only economist who truly understood how the world works, Milton Friedman once said, ‘If you put the government in charge of the Sahara Desert, in five years there would be a shortage of sand.’
On the other hand, as Milton Friedman also pointed out, ‘there has never been a tax cut that consumers and investors did not appreciate’; furthermore, ‘if a tax cut leads to increased government revenues, it indicates that the taxes were not cut enough.’
However, if a tax cut is financed by higher tariffs as it seems it would be under ‘Trumponomics 2.0’, everyone must remember that while ‘the benefits of tariffs are visible, the harm they cause is often invisible, as many people may lose their jobs due to tariffs without realizing it.’
To cut a long political story short, regardless of who becomes the next US president, it is evident that as the world faces a liquidity tsunami hitting the Great Wall of Debt, inflation will become increasingly entrenched and investors will have to deal with much higher levels of volatility in the bond and equity markets as it should be clear to anyone with a modicum of common sense that a smooth and rosy outcome from the 47th US presidential election is highly unlikely given the deep divisions between the red and blue candidates.
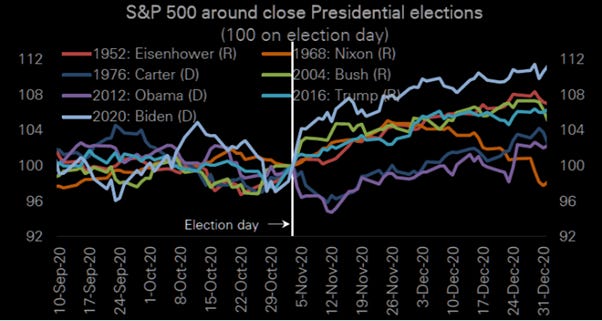
For those investors who tend to look at the past and expect that it will replicate again and again. For those who believe in this market patterns, the ‘election playbook’ has been a pullback into election day a rally after election day regardless of the outcome.
However, with the US presidential election just days away—investors continue to climb the White House wall of worry. Since late September, financial markets have faced a dystopian paradox: rising volatility alongside rising share prices.
S&P 500 index (blue line); CBOE Volatility Index (VIX Index) (axis inverted; red line); Correlations.
If investors haven't yet recognized that recent equity gains are largely due to monetary illusion and currency debasement rather than economic strength, they should note a critical signal: every time the S&P 500/XAU ratio drops below its 7-year moving average, volatility spikes much higher. Since this pattern in the S&P 500 versus gold ratio has consistently been a bad omen for the economy and, ultimately, for equity investors, this should not come as a major surprise to anyone.
S&P 500 index /Gold price ratio (blue line); 84 months moving average of the S&P 500 index/Gold price ratio (red line); CBOE Volatility Index (VIX Index) (axis inverted; green line).
The recent trend in the S&P 500 adjusted for the volatility index shows that, while still above its 5-year average, this ratio has been declining since late August. Historical patterns also suggest that once this ratio falls below the 5-year average, the 30-day rate of change for equities turns negative and therefore this seems the obvious alarm bell to monitor to time when the wall of worry will become insurmountable for equity investors.
S&P 500 index/ VIX Index (rebased at 100 as of 31st October 2019) (blue line); 30 days rate of change in S&P 500 index (lower panel; yellow histogram).
In this context, portfolios must be structurally allocated to deal with the new trend in monetary inflation and the upcoming increase in volatility for financial assets, meaning that portfolios must have a significant allocation to assets that benefit from this monetary inflation, such as those available in limited quantities like physical gold, silver, and other commodities. At the end of the day, physical gold, by definition, is the only asset with more than two millennia of history demonstrating its ability to hedge government risks which will inevitably keep rising.
Outside of precious metals and other commodities available in limited supply, prime residential real estate can be considered a scarce asset, as there will always be a premium for real estate in prime locations, provided that the governments ruling these areas do not become extremely rogue in their treatment of asset owners and that conflict does not destroy the value of this prime residential real estate. Investors looking at real estate must also remember that interest rate will be structurally much higher in a wartime and therefore investors must own these assets free of debts or with a fixed rate over a tenure which allow them to reimburse their mortgage as soon as possible based on their financial wealth.
In addition to real assets, equities of companies with an economic moat and a low-leveraged balance sheet are also ways for investors to hedge against rising monetary inflation. However, when investing in these stocks, investors must remember that equity markets have been in a bull market for two years, and historically, at this stage of the bull market, markets have recorded more than 80% of their ultimate gains on average, indicating that most of the gains from this equity bull market could already be behind us. With many uncertainties, including geopolitics and the outcome of the US presidential election, investors should be prepared for a choppy end to 2024 and a turbulent year in 2025 and beyond.
Investors must also remember that the current favoured method of equity ownership—indexing—means that they are inherently betting against a significant rise in fossil fuel prices. As the war cycle intensifies, which has historically been favourable for gold and commodities like oil, it is prudent for anyone with a basic understanding of financial history to favour energy producers rather than energy consumers in their equity allocation, without neglecting the quality of their investments. In fact, most energy producers that have had their capital expenditures constrained by tighter regulations related to the climate change scam, have strengthened their balance sheets and improved their ability to generate positive free cash flow across the commodity cycle, placing them in an enviable position for the upcoming increase in oil and other commodity prices. Therefore, in addition to holding more than the recommended 25% allocation to gold in the Browne Portfolio, the equity allocation should be tilted toward these energy producers with strong balance sheets and the ability to generate positive free cash flow throughout the commodity cycle. On the contract side of the Browne Portfolio (cash and bonds), allocations should be kept minimal and invested only in short-dated (not exceeding 12 months) investment-grade corporate paper of companies with low leveraged balance sheets and which can be described as servicing the US economy's strategic needs.
Finally, recalling what Trump wrote in The Art of the Deal, he mentions that he negotiates by throwing hand grenades into a room and then closing the door. Therefore, if he is allowed to be in power in 2025, investors can expect some hand grenades to be thrown into the world economy. This should serve as one of the best reasons to be cautious in the short to medium term and to hold a substantial portion of the portfolio in cash, which rather than sitting on a bank account must be managed using a portfolio of investment-grade short-dated USD bonds (with maturities of no more than 12 months).
In the meantime, investors must understand that on November 6, 2024, no matter who claims victory, they should get ready for the fight of their lives! If Trump wins, the Democrats will explode and retaliate; if Harris wins (after probably cheating), then patriots will act! Either way, a civil war is coming for the US, and investors should cherish what is most precious on earth, their loved ones, while spreading the love across their communities as most politicians and plutocrats have neglected to do so over the years, leading to this situation.
While everyone can hope for the best and prepare for the worst, we must all understand that the financial impact of the 47th U.S. presidential election and what follows will be felt through 2028 and beyond.
If this report has inspired you to invest in gold and silver, consider Hard Assets Alliance to buy your physical gold:
https://hardassetsalliance.com/?aff=TMB
At The Macro Butler, our mission is to leverage our macro views to provide actionable and investable recommendations to all types of investors. In this regard, we offer two types of portfolios to our paid clients.
The Macro Butler Long/Short Portfolio is a dynamic and trading portfolio designed to invest in individual securities, aligning with our strategic and tactical investment recommendations.
The Macro Butler Strategic Portfolio consists of 20 ETFs (long only) and serves as the foundation for a multi-asset portfolio that reflects our long-term macro views.
Investors interested in obtaining more information about the Macro Butler Long/Short and Strategic portfolios can contact us at info@themacrobutler.com.
Unlock Your Financial Success with the Macro Butler!
If this report has inspired you to invest in gold and silver, consider Hard Assets Alliance to buy your physical gold:
https://hardassetsalliance.com/?aff=TMB
Disclaimer
The content provided in this newsletter is for general information purposes only. No information, materials, services, and other content provided in this post constitute solicitation, recommendation, endorsement or any financial, investment, or other advice.
Seek independent professional consultation in the form of legal, financial, and fiscal advice before making any investment decisions.
Always perform your own due diligence.

















So while the s&p:gold ratio to it's average has already flipped to the-ve, the s&p:wti to it's average still looks fine, ie oil has not gone up yet wrt s&p.
Is your belief that it will is due to middle east eascalations, or does the s&p :gold behaviour lead it.
From a retail investor trying to figure things out
I am quite stunned by this. Thanks