


The Week That It Was…
As the U.S. celebrated Juneteenth and enjoyed a holiday-shortened week, investors had just enough time between barbecues and beach trips to pretend they cared about retail sales—the week’s only real headliner outside of FOMC déjà vu. Oh, and let’s not forget the final six S&P 500 stragglers reporting Q1 results—fashionably late, as always.
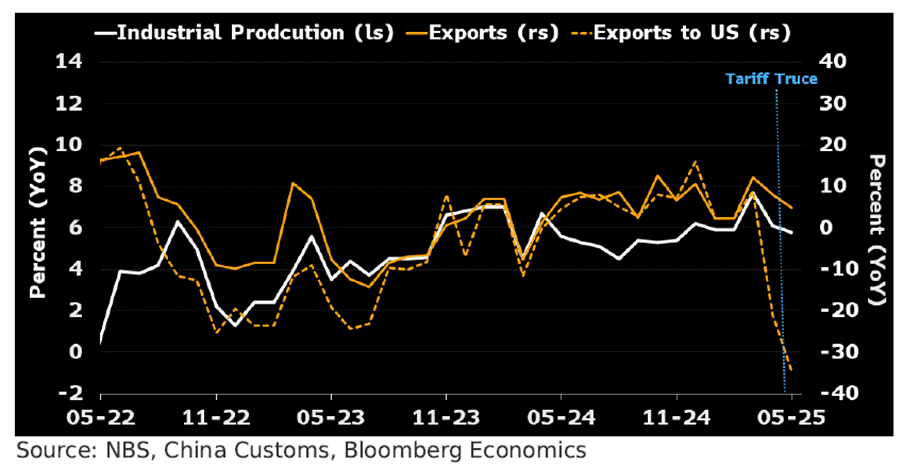
China’s retail sales growth suddenly decided to speed up in May, despite riding the wild tariff rollercoaster—giving Beijing a bit of a confidence boost while staring down the ever-looming US trade war. Retail sales jumped 6.4%, beating all expectations.

This took place just as industrial output slowed to 5.8%, thanks to Trump’s tariffs cramping demand from the world’s biggest economy. The mid-May tariff truce offered a brief breather, and an early-start shopping festival (hello, JD.com’s 618 sale) likely gave consumer spending a turbocharge. But don’t pop the champagne just yet as this bounce might be more flash than substance, especially with weak housing data and shrinking subsidy effects lurking in the background.
US May retail sales hit reverse, down 0.9%, mostly because Americans finally decided their old car will indeed last a little longer. Big-ticket items like vehicles, gas, and building supplies took the biggest hit—because apparently, no one wants to fill up the tank, build a deck, or buy a new SUV in a tariff minefield. Meanwhile, spending on sporting goods, furniture, and online shopping crept up—because we still need hobbies, comfy chairs, and packages on the porch to stay sane. The takeaway? Retail’s looking shaky. Consumers are price-conscious, selective, and increasingly allergic to anything with a tariff markup. This summer, expect more budget buys and fewer splurges—unless someone’s handing out stimulus checks with the sunscreen.

Retail sales may look fine on the surface, but they’re nominal—blind to inflation. Adjust for that, and we’re still below the April 2022 peak, with May barely above last September. That’s more than a hiccup: historically, real retail sales peaks often align with tops in the S&P 500-to-Oil ratio and hint at a drop below its 7-year average. Translation? A recession may be closer than Wall Street’s rose-colored filters admit.
US Retail Sales Adjusted to inflation (i.e. CPI) (blue line); S&P 500 to WTI ratio (green line); 7-Year Moving Average of the S&P 500 to WTI ratio (red line).

As expected, the Fed kept rates steady at 4.25%–4.5% for the fourth meeting, opting for wait-and-see mode while chaos from war and tariffs builds. The latest projections quietly flirt with stagflation: 2025 growth cut to 1.4%, core inflation up to 3.1%, and rising unemployment. But no worries—Powell’s team still thinks inflation will magically drift to 2.1% by 2027. Lower growth, higher prices, and more job losses—wrapped in a surprisingly upbeat PowerPoint.

The Fed’s latest dot plot still clings to its fairy tale of two rate cuts in 2025—same as March—proving once again that hope is a monetary policy strategy.

In the never-ending soap opera of rate-cut wishcasting, Wall Street’s eternal optimists—also known as traders—have dialled down their hopes to a modestly delusional 81% chance of a September cut after Jackson Hole. Yet somehow, they’re still pricing in two cuts by year-end, clutching the soft-landing fantasy like it’s a security blanket stitched by Jerome Powell himself.

Cycles are the natural rhythms that govern everything from the cosmos to economies. In finance, the business cycle—comprising periods of expansion, peak, contraction, and trough—shapes everything from interest rates to employment. Driven by human behaviour, credit dynamics, and policy responses, it reflects the collective boom-bust psychology. But behind this economic heartbeat lies a deeper, often overlooked rhythm: the solar cycle.
The solar cycle is the Sun’s version of a mood swing—flipping between quiet and wild about every 11 years. It’s all thanks to its ever-twisting magnetic field, which gives us everything from calm sunny days to explosive tantrums like solar flares and coronal mass ejections (a.k.a. giant plasma burps).
The Sun’s activity can be tracked by counting sunspots—those dark patches on its surface caused by magnetic mayhem that cool things down just enough to look like acne. When the Sun's covered in them, it's called solar maximum; when it’s nearly spotless, we call it solar minimum (and maybe suggest it take a nap).
Since 1755, numbering of these cycles like have been recorded as solar seasons. Right now, we’re in cycle 25, which kicked off in December 2019. It hit its dramatic peak around October 2024 and is now settling down again by 2030. So far, cycle 25 has been fierier than forecasted, but still not quite as wild as the Sun’s greatest hits from the 20th century.

Solar Cycle 25 showed up to the party with more energy than expected—but it’s still not quite the rockstar some of its 20th-century ancestors were. Early forecasts, courtesy of a tag team from NOAA, NASA, and the International Space Environmental Services (yes, that’s a thing), predicted it would be a repeat of the last snoozefest, Cycle 24—the weakest in nearly a century.
Back in 2019, the official Solar Cycle Prediction Panel confidently called for a peak sunspot number of 115 (using the 13-month smoothed average) around July 2025. That’s nearly identical to Cycle 24’s yawn-worthy peak of 116.4 in April 2014. So far, Cycle 25 has outpaced those expectations—but it’s still far from breaking records. Think: surprising underdog, not solar heavyweight champ.

In the 19th century, British economist William Stanley Jevons took one look at sunspots and decided they were behind the ups and downs of the economy. Not bankers, the Sun. He noticed that “commercial crises” (what we now call recessions) seemed to happen every 10–11 years, just like the solar cycle. Jevons called it a “beautiful coincidence,” which, of course, is how all serious science begins. Naturally, the reason is that solar flares are wrecking harvests, which in turn crashed markets. Econometrics, meet astrology.

But Jevons was a minimalist compared to Russian scientist Alexander Chizhevsky, who looked at the Sun and saw the entire arc of human history. He claimed that revolutions, wars, and general mayhem peaked right around solar maximums. He even charted centuries of upheaval—from 500 B.C. to 1922—against sunspot records, finding a suspicious number of uprisings when the Sun was feeling particularly blotchy. Chizhevsky split the solar cycle into four phases, starting with sleepy authoritarianism, followed by political organizing, then full-blown revolutions, and finally burnout and apathy. Basically, humanity on an 11-year caffeine binge.

In a nuthshell, the Sun has been moonlighting as an economic hitman.
From 1901 to 2008, every time sunspots peaked, the U.S. economy got the cosmic flu. Out of ten solar cycles (cycles 14–23), eleven recessions broke out within a cozy two-year window surrounding the solar maximum—either just before or not long after. Statistically, the odds of this being pure coincidence are less than 0.1%. That’s right: the same probability as a Fed chair admitting they’re just winging it. But wait—it gets weirder. Since 1933, the relationship gets even tighter: 8 out of 13 post-Depression recessions hit during this same solar sweet spot. Before that? The 19th century was a bit more... freestyle. Recessions popped up all over the cycle, with no regard for solar etiquette.
Why the shift after the 1930s? Blame it on the Great Depression. That cataclysm scared policymakers straight. Recessions became shorter, less frequent, probably thanks to government intervention (read: stimulus cocktails). Random shocks like bank runs stopped triggering full-blown economic meltdowns—unless the Sun demanded it. And it’s not just about recession starts. Between 1933 and 2008, the economy spent a third of its time in a downturn within the three years after a solar maximum. At the peak of this trend—about 18 months after sunspot highs—recessions were more common than not. The correlation between solar activity and economic misery even reached 0.21 (which is high for this sort of celestial fortune-telling). Of course, once you extend the analysis to include the more chaotic 19th century, all the solar-economy love disappears. Turns out, sunspot cycles only got their economic act together once the U.S. did. Coincidence? Maybe. But if Wall Street ever starts trading solar flares, you’ll know why.

Nobody knows exactly why, but it turns out the Sun might have a side gig as a recession DJ—dropping economic downturns every time it hits peak activity. For over a century, nearly every solar maximum synced suspiciously well with a U.S. recession. That cosmic streak held strong until 2014, when the Sun's weak solar cycle 24 peaked... and the U.S. economy yawned and kept going. Past research suggests the U.S. is most recession-prone within a two-year window around these solar highs. The rest of the G7 is just as sun-sensitive—Canada, France, Germany, Italy, Japan, and the UK have also shown a knack for stumbling into recessions within three years of solar peaks. Even worse, when their recessions overlap, it can trigger a full-on global slowdown.

Once we accept that recessions tend to cluster around solar maximums, it’s logical to expect that other business cycle indicators would also show signs of strain during those periods. And that’s exactly what the data says.
Take the OECD’s Composite Leading Indicators (CLIs), built specifically to anticipate economic turning points. For the U.S., during solar cycles 19 through 23 (1955–2008), the CLI consistently dropped in the three years surrounding solar peaks—bottoming out roughly 2.5 years after. Statistically, the CLI had a notable negative correlation (-0.15) with sunspot activity, lagging by 24 months. This wasn’t just a U.S. quirk—similar patterns were found across all G7 countries (except Japan), and even across broader OECD and BRICS-type economies.
The trend continues with the Aruoba-Diebold-Scotti (ADS) business conditions index, which blends various high- and low-frequency U.S. data. From 1964 to 2008, the ADS index showed clearly weaker-than-average conditions in the three years following solar maximums, with a statistically significant negative correlation to sunspot activity. Even more striking is the unemployment data. From 1948 to 2014, every U.S. solar maximum lined up closely with a low in the unemployment rate—followed by a sharp upward turn peaking 2–3 years later. In short, sunspot highs seem to precede job market lows. Canada mirrored the U.S., while Japan’s historically stable unemployment rate showed less connection—likely due to its unique labor market dynamics. European G7 countries showed a weaker relationship, partly due to inconsistent long-term data. As you'd expect, GDP growth also lags behind the Sun. U.S. GDP growth rates weakened consistently in the three years after solar peaks between 1954 and 2008. The same pattern shows up in aggregated G7 GDP, broader advanced economies, and even global GDP growth.
In sum: the Sun may not be managing your portfolio, but it does seem to cast a shadow over global business cycles—often dimming growth, employment, and confidence in the years after it reaches its fiery peak.

Anyone with a functioning brainstem and Econ 101 under their belt knows that thriving economies run on cheap and abundant supply of energy and food. Unfortunately, the climate change crowd—especially in Europe and California—missed the memo. They're busy banning cows and gas stoves while Mother Nature is quietly prepping for her next plot twist: a Solar Minimum.
As of July 2025, the planet earth is in Solar Cycle 25—the sun’s version of a Netflix-and-chill phase. It kicked off in December 2019 and might run till 2030, with forecasts ranging from “meh” to “Maunder Minimum” (a.k.a. Little Ice Age 2.0). When the sun gets quiet, weird things happen—like massive volcanic eruptions, planetary cooling, crop failures, and people discovering what rationing tastes like.
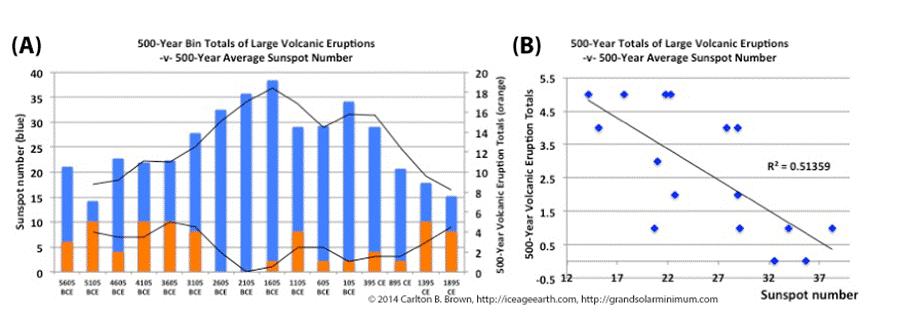
Here's the kicker: over the past 8,000 years, there’s been a strong inverse relationship between sunspot activity and major volcanic eruptions (R = -0.72, for the stats nerds). Fewer sunspots? Boom—more magma. It's not magic; it's magnetized solar wind mucking about with Earth’s geology. And yes, the green zealots will figure this out thanks to tree rings and radioactive carbon (science!). The last 2,500 years have seen a drop in sunspot averages—and surprise!—volcanic mayhem picked up. Some data even suggest a tipping point: if sunspot averages dip below 17, the Earth gets a fireworks show from beneath. Just one giant eruption could choke the skies, crash crops, and make the next supply chain crisis look like a picnic. As solar activity declines (blue line), volcanic activity (red line) appears to rise—adding some historical weight to the idea that fewer sunspots might mean more eruptions, more cooling, and possibly more chaos.

While the 47th US president has been keen to ditch the climate Kool-Aid and embrace energy independence, reality might hit harder than any policy shift. If the sun keeps dozing off, the real "climate emergency" may involve parkas, panic buying, and food riots—not rising seas. So forget carbon credits. You might want to invest in greenhouses, wool socks, and maybe a few cans of beans.
Research indicates a correlation between the solar cycle—particularly periods of low solar activity known as solar minimum—and increased volcanic activity. During solar minima, reduced sunspot activity allows for greater penetration of cosmic rays into the Earth's atmosphere, which may influence cloud nucleation, atmospheric pressure patterns, and ultimately seismic activity. Some studies suggest that decreased solar irradiance can affect the Earth's magnetosphere and stratospheric temperatures, potentially contributing to tectonic instability. Historical data reveal that major volcanic eruptions, such as the 1815 eruption of Mount Tambora during the Dalton Minimum, often coincide with prolonged solar minima, implying a possible link between reduced solar activity and heightened volcanism. Although causality remains a subject of ongoing research, the relationship between solar variability and volcanic activity is increasingly recognized as a significant factor in long-term climate variability. Volcanic eruptions inject substantial amounts of aerosols and gases into the stratosphere, which can reduce solar irradiance reaching the Earth's surface and result in measurable surface cooling lasting one to three years.

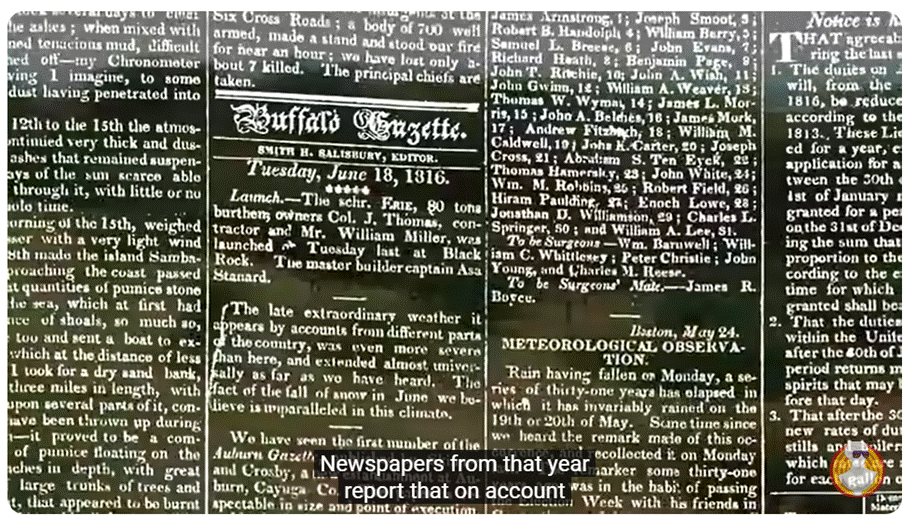
Back in 1815, Mount Tambora decided to throw the biggest volcanic tantrum in recorded history—blasting out enough rock and ash to cover the atmosphere and silence nearby villages for good. With a VEI of 7, it was loud enough to be heard hundreds of miles away and deadly enough to wipe out at least 10,000 islanders and 35,000 homes.

https://www.dw.com/en/the-historic-tambora-eruption-a-devastating-volcanic-event/video-69529475
The fallout? The infamous “Year Without a Summer” in 1816, when global temps took a nosedive, crops failed, and famine spread like wildfire. Oh, and it also kickstarted the first global cholera pandemic and an economic slump in the U.S.—talk about aftershocks.
Scientists think this volcanic drama was linked to the Dalton Minimum, a solar chill-out period that boosted cosmic rays, possibly nudging volcanoes into action. Others say solar flares might even mess with Earth’s spin, triggering mini earthquakes that can either unleash or delay volcanic blowups. Either way, Mother Nature showed she has a flair for dramatic sequels.
By now everyone’s should know that the solar cycle and volcanic eruptions mess with Earth’s climate. During a solar minimum, when the sun decides to take a little nap, things get chillier up here. Add to that a massive volcanic tantrum like Mount Tambora’s in 1815, which spewed enough ash and sulfur dioxide to put a giant shade over the planet, and voilà—you get the delightful “Volcanic Winter” of 1816, or as it’s lovingly called, the “Year Without a Summer.” The solar minimum also loves to throw a wrench into the Atlantic Meridional Overturning Circulation—the fancy name for the Gulf Stream’s slow-mo performance—meaning less warm water heading to Europe and North America, making things even chillier. So, when solar slumps, volcanoes blow, and ocean currents dawdle, we get a cocktail of climatic chaos that’s as subtle as a sledgehammer.

Some crops didn’t even wait for the volcanic winter to start throwing a tantrum. While the world is still busy arguing if climate change means sweating buckets, Japan is already living the future—welcome to the Rice Apocalypse. Who needs a volcanic winter or a solar minimum when you can just pay double for your daily bowl of rice? What was a humble ¥2,168 for 5 kg back in January 2024 has blossomed into a fancy ¥4,200 by spring 2025. That’s right, rice has officially earned its spot in the luxury goods hall of fame. Bon appétit, served with a generous side of inflation!

Japan’s rice shelves are so bare the government’s had to heroically raid its “emergency stash” for the third time in 3 months, dropping another 200,000 metric tons into the wild. That’s on top of the 600,000+ tons already unleashed since March—because who doesn’t love a good rationing drama? Minister Koizumi assures us they’re “responding without slowing down,” which apparently means keeping the economy stable by handing out 3-year-old rice and blaming it for wage stagnation. Meanwhile, the ruling LDP, in power since 1955, faces a July Upper House election with all the charm of soggy sushi. To add insult to injury, the next rice harvest isn’t until August—and it’s shaping up to be a historic disaster, with the smallest planted area since 1900. Farmers, understandably fed up, are protesting a government that pays billions to not grow food instead of subsidizing actual harvests. Now the Ministry of Agriculture is begging them to go back to rice farming, but convincing a younger generation stuck with low pay and heavy regulation? Good luck with that. And just when you think things couldn’t get messier—Japan’s flirting with a sovereign debt crisis. But for now, it’s the empty rice bowls reminding everyone that the real shortage is in competent leadership.

https://www.theguardian.com/world/2025/may/21/japan-farm-minister-resigns-rice-price
Outside of politics, no need of a PhD in finance to figure out that rising food and agricultural commodity prices push inflation up the ladder. So it’s no shocker that the Bloomberg Agriculture Commodity Index climbing is one of the many sparks that pushed the Gold to US Treasury Ratio above its 7-year moving average—the rare indicator that’s refreshingly free from any propaganda spin, quietly signaling that, yes, the US economy is very much swimming in an inflationary sea.
Gold to US Treasury Ratio (blue line); 7-Year Moving Average of Gold to US Treasury Ratio (red line); Bloomberg Agriculture Commodity Index (green line).

As anyone with even a pinch of common sense knows, scarcity pushes food prices up, and when food gets more expensive, consumers end up paying more for less on their plates. So it shouldn’t surprise anyone that a rise in the Bloomberg Agriculture Commodity Index has also been, among other things, a leading indicator for the S&P 500 to Oil ratio — the only truly unbiased gauge telling us whether the US economy is cruising in a boom or heading for a bust, depending on where it sits relative to its 7-year moving average.
S&P 500 Index to Oil Ratio (blue line); 7-Year Moving Average of S&P 500 Index to Oil (red line); Bloomberg Agriculture Commodity Index (axis inverted; green line).

As the solar minimum ushers in yet another volcanic winter which will bring economic crisis but also wars, chaos and regime changes, investors would do well to remember that since the Manipulator in Chief took office, the S&P 500-to-gold ratio has stubbornly stayed below its 7-year moving average—a subtle but serious alarm for anyone actually paying attention to cycles. With the war cycle turning up the heat, it’s time to stop pretending we can bend the business cycle to our will. Instead, savvy investors need to adapt—shifting their mindset from chasing Return ON Capital to prioritizing Return OF Capital.
The antidote? Real assets. Physical gold and silver remain the only truly antifragile stores of value—no counterparty, no nonsense, no digital surveillance. Broader commodity exposure is also essential to survive the storm stirred by the Commodity Leviathan.
Active cash management is equally vital: stick to short-dated, IG USD bonds (<12 months) and T-bills (<3 months) to generate income and preserve flexibility. In equities, favor lean, low-leverage businesses with strong EPS and free cash flow—especially those that actually pay taxes and are set to benefit from the trade war and the reindustrialization of America. Prioritize energy and commodity producers to consumers. In short: farewell, Goldilocks. Say hello to Gold-In-Lots.
What’s On The Agenda Next Week?
The final full week of Q2 in this Jubilee Year won’t exactly be a thriller—unless you find joy in flash PMIs, Core PCE data, and the ever-optimistic guesses of the University of Michigan’s sentiment and inflation surveys. Meanwhile, the Fed’s very own Eyes Wide Shut chairman will appear before Congress for a testimony expected to be just as enlightening as his last press conference—meaning, not at all. On the earnings front, 14 S&P 500 companies will report, but only FedEx, Micron, and Nike might offer enough caffeine to keep investors from dozing off before we close the first half of the year with a shrug.

KEY TAKEWAYS.
As solar minimums become a reality and a volcanic winter loom on the horizon, the key takeaways are:
China’s retail sales sprinted past expectations in May thanks to a tariff truce and early shopping sprees—but don’t count on it to ‘Make China Great Again’ anytime soon.
US Retail sales are stuck in 2022, inflation’s still biting, and stagflation signals are flashing Wall Street just doesn’t want to look.
The ‘Eyes Wide Shut’ Fed held rates steady while forecasting lower growth, higher inflation, and rising joblessness—yet still clings to its favourite policy tool: wishful thinking.
Cycles rule everything—from the Sun’s fiery mood swings to the boom-and-bust rhythms of economies
Sunspots—not bankers—drive economic boom and busts, with humanity’s revolutions and wars riding the Sun’s 11-year chaos cycle.
Since 1901, nearly every solar maximum has been the Sun’s cue to drop a recession beat, with U.S. economic downturns—and those of major global players—regularly syncing up within a few years of peak sunspot activity, turning the Sun into an unexpected DJ of the business cycle.
While green zealots debate cows and gas stoves, Mother Nature’s low-sunspot Netflix binge is quietly brewing volcanic chaos and crop crashes—reminding us that when the Sun naps, winter and rationing RSVP to the party.
When the Sun takes a nap during solar minimums, volcanic tantrums erupt and ocean currents stall, brewing a perfect storm of climate chaos—think “Year Without a Summer” but on repeat.
Rising food prices fuel inflation—and with the Agriculture Commodity Index climbing, even the no-spin Gold-to-Treasury and S&P 500-to-Oil ratios are flashing red, signalling the US economy’s walk into the ‘Trump Stagflation’.
As the US economy shifts into an inflationary bust, investors will once again need to focus on the Return OF Capital rather than the Return ON Capital, as stagflation spreads.
Physical gold and silver remain THE ONLY reliable hedges against reckless and untrustworthy governments and bankers.
Gold and silver are eternal hedge against "collective stupidity" and government hegemony, both of which are abundant worldwide.
With continued decline in trust in public institutions, particularly in the Western world, investors are expected to move even more into assets with no counterparty risk which are non-confiscable, like physical Gold and Silver.
Long dated US Treasuries and Bonds are an ‘un-investable return-less' asset class which have also lost their rationale for being part of a diversified portfolio.
Unequivocally, the risky part of the portfolio has moved to fixed income and therefore rather than chasing long-dated government bonds, fixed income investors should focus on USD investment-grade US corporate bonds with a duration not longer than 12 months to manage their cash.
In this context, investors should also be prepared for much higher volatility as well as dull inflation-adjusted returns in the foreseeable future.
HOW TO TRADE IT?
The shortened Juneteenth holiday week will be remembered as the moment when the world held its breath for a possible escalation in the Middle East’s already wide-open geopolitical Pandora’s box. While the week was expected to be uneventful for investors, it didn’t disappoint—marking the second consecutive weekly decline for U.S. equity indices, something we hadn't seen since the early April weeks of the “Tariff Tantrum.”
While the clueless financial mass media is quick to blame geopolitics for the downturn, those who follow market cycles and technicals knew the warning signs were already flashing. All major U.S. equity indices had been losing steam before the first bombs flew, with momentum and stochastics indicators flashing exhaustion at short-term overbought levels. The S&P 500 and the Dow Jones have already broken the uptrend that began on the infamous “Liberation Day” and the flip-flops that followed in late April and early May, while the Nasdaq 100—still buoyed by inflows from YOLO retail investors suffering from FOMO—is clinging to the lower bound of that same uptrend channel.
Investors should therefore be prepared for further pullbacks in the coming weeks. This could bring the Nasdaq 100 and S&P 500 down first to their respective 76.4% Fibonacci retracement levels (20,882 and 5,837), while the Dow Jones and the Magnificent 7 may retrace to their 61.8% levels (41,841 and 24,199), suggesting broader market headwinds persist.
With greed still prevailing over fear and short-term technical indicators rolling over and still overbought, investors should brace for a potential correction over the summer. A retest of the 50% Fibonacci retracement levels—Nasdaq 100: 19,382; S&P 500: 5,491; Magnificent 7: 23,089; Dow: 40,842—could trigger another round of bearish panic. However, if these support levels hold, it may offer the last tactical buying opportunity of the year.
Since the “tariff tantrum” faded on April 21, all major U.S. equity indices have been forming higher lows—suggesting that the year’s bottom may already be in. While geopolitical shocks—not economic data—will likely drive higher volatility, long-term investors should remain focused and avoid being swayed by doom-and-gloom headlines. These higher lows could be laying the groundwork for new all-time highs, particularly for the Dow in the second half of the year. With all major indices showing daily bullish reversals since April 25, the April 8 lows (S&P 500: 4,982; Nasdaq 100: 17,090; Dow Jones: 37,645) may well have marked the bottom for 2025. Smart money will be buying the next dip—regardless of the noise from Wall Street pundits.

As of June 20th , 2025, the US remains in an inflationary boom, but with the S&P 500 to Gold ratio now below its year below its 7-year moving average for exactly 5 months, an inflationary bust will materialize much sooner than Wall Street pundits and their parrots are eager to tell their clients. In this context, investors should stay calm, disciplined, and use market data tools to anticipate changes in the business cycle, rather than fall into the forward confusion and illusion spread by Wall Street.

When the storm of World War III finally breaks—a conflict now inevitable as the geopolitical powder kegs of the Middle East and Eastern Europe —the time for urban comforts and global dependencies will be definitively over. Survival will belong to those with the foresight and means to secure farmland in law-abiding, far-flung corners of the world—well outside the blast radius of civilization’s collapse.
The top priority? Escape the cities. These concrete jungles, already stripped of self-sufficiency, will become both targets and traps. In contrast, even a modest garden in your backyard—tucked away in the quiet countryside—will be worth more than gold when the supply chains snap and store shelves go dark. For those unable to grow their own food, salvation lies in strong, self-reliant communities—tight-knit networks where each member has a role, a skill, and a purpose. Only through mutual resilience will these enclaves withstand what’s coming: a world plunged into chaos, conflict, and even a volcanic winter.
Savvy investors know commodities are the most treacherous asset class—wildly volatile, weather-driven, geopolitically sensitive, and riddled with supply-demand shocks. Unlike stocks or bonds, they carry real-world headaches: storage, transport, and the steep learning curve of futures contracts that expire whether you're ready or not.
Owning the physical commodity—like wheat, corn, or soybeans—offers the purest exposure, but few can afford to store metric tons of grain. Futures trading is another route, but it demands deep expertise, risk tolerance, and capital, especially given the complexities of contango and backwardation across different maturities.
Enter ETFs—an easier way to gain exposure, but not without caveats. Passive commodity ETFs often track indexes via futures, and that brings its own set of risks: roll yield losses, tracking error, and most crucially, counterparty exposure. If you’re trusting an ETF, make sure its issuer isn’t just another paper pusher. For those focused on agriculture, WisdomTree’s Agriculture ETF (AIGA LN) offers exposure to the Bloomberg Agriculture Index—no futures roll management required, but it’s listed on the London Stock Exchange, making it vulnerable to capital controls as Europe, including the UK, marches toward geopolitical chaos under WEF-aligned leadership. U.S.-listed alternatives include Teucrium Agricultural Strategy ETF (TILL US), managed by Teucrium Trading LLC, and Invesco DB Agriculture ETF (DBA US), which tracks the DBIQ Diversified Agriculture Index. Both provide diversified exposure to soft commodities without direct futures trading—but again, choose your counterparty wisely.

Source: Bloomberg.
In an era of food inflation, scarcity, and systemic shocks, agriculture is no longer just an asset—it's lifeline insurance.
Agriculture companies may offer promise, but they come with landmines—especially in unstable jurisdictions where property rights evaporate the moment commodity prices spike. Even in so-called "stable" countries, governments won't hesitate to squeeze agribusinesses when food inflation stirs unrest. History is clear: soaring food prices toppled monarchs in 1789 and dictators during the Arab Spring. Now, with the Earth flirting with a volcanic winter and a Trump-era stagflation looming, investors must pivot—ditch paper promises like bonds and cash, and move into hard assets: stocks, gold, and land. In an inflationary bust, producers beat consumers. That includes not just oil and gas, but miners and giants linked to agribusiness which are poised to thrive as war and scarcity reshape the global economy. The MVIS Global Agribusiness Index tracks these titans. And when the Bloomberg Agriculture Commodity Index rises, history shows one thing: agribusiness stocks follow. The smart money knows—own the shovel, not the starving crowd.
Bloomberg Agriculture Commodity Index (blue line); MVIS Global Agribusiness Index (red line).

The VanEck Agribusiness ETF (MOO) is a direct play on the MVIS Global Agribusiness Index, capturing the upside of global food inflation without parking an excavator in your garage.

You don’t need to be a Midwest rancher or tend crops on the Argentine pampas to know that fertilizers are the backbone of global food production—and they'll become even more critical as a volcanic winter slashes sunlight and crop yields. For investors seeking exposure, Mosaic (MOS US) stands out as a global leader in phosphate, potash, and crop nutrients, with key operations in the U.S. and Brazil.

https://mosaicco.com/Our-Business
As volcanic winter looms and war-fueled shortages grow, don’t expect inflation to cool—tariffs, devalued dollars against real assets, and endless crises are here to stay. Smart investors will keep ditching bonds, and loading up on physical gold—the chaos-proof, counterparty-free asset that’s outlasted every empire. Beyond gold, stocking 12 to 24 months of food is no longer paranoid—it's prudent. Even rural sanctuaries won’t escape the bite of crop failures and rising prices.
In an era where volatility is the norm and trust in institutions evaporates, only real assets matter. Forget Bitcoin and hope—pack gold and canned food.
In a world racing toward digital control and fiat decay, smart investors are stacking physical gold, silver, platinum, and palladium—preferably in private vaults rather than government- or bank-controlled ones—from hefty 1kg bars to old-school numismatic coins like pre-1965 Silver Eagles, not for nostalgia, but for real autonomy. Unlike Bitcoin or Tether, these tangible assets come with no compliance traps, no digital IDs, and no counterparty roulette. As the world stumbles from inflationary boom to bust, gold won’t just survive—it’ll outshine bonds, dodge bureaucrats, and flex like it’s 480 BC all over again.
So yeah, gold matters—yesterday, today, and especially tomorrow.
Those who recognize the challenges ahead—war, shortages, and disease—won’t just endure them; they’ll be well-positioned to thrive when the world emerges stronger and more resilient on the other side, stepping into a new era of opportunity by the next decade when the light appears at the end of the tunnel.

If this research has inspired you to invest in gold and silver, consider GoldSilver.com to buy your physical gold:
https://goldsilver.com/?aff=TMB

Disclaimer
The content provided in this newsletter is for general information purposes only. No information, materials, services, and other content provided in this post constitute solicitation, recommendation, endorsement or any financial, investment, or other advice.
Seek independent professional consultation in the form of legal, financial, and fiscal advice before making any investment decisions.
Always perform your own due diligence.

Share this post