Japan's Doom Loop
THE WEEK THAT IT WAS...
Once again, the Buddha's birthday week revolved around discussions of inflation in the US and the health of both the US and Chinese consumers. This was highlighted by the release of the US April CPI and PPI data, as well as the April retail sales figures for both the US and China. Following up on his 'MayDay' call, FED Chairman Powell addressed a Central Bankers meeting in the Netherlands, while major retailers like Walmart and Home Depot nearly almost concluded the Q1 2024 earnings season in the US.
In China, retail sales and industrial production data reveal ongoing supply-demand imbalances, casting doubt on a steady recovery in the coming months unless the government implements further policy changes. While retail sales weakened more than expected in April, industrial production accelerated beyond expectations during the same period.
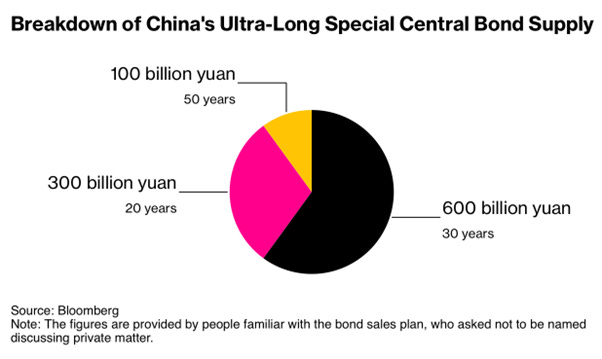
In a policy change that could potentially be a significant game-changer for the Chinese economy, China sold 1.0 trillion Yuan ($138 billion) in ultra-long-term bonds to stimulate economic growth. While this move may exert some pressure on the Yuan, it could also indicate that a major shift in economic policies will be announced at the upcoming Politburo congress in July.
The news coincided with the announcement that Total Social Financing came in at negative 200 billion Yuan. This marks the first contraction since January 2002, indicating a clear lack of consumer willingness to spend. Interestingly, the net government debt issuance declined over the same period.
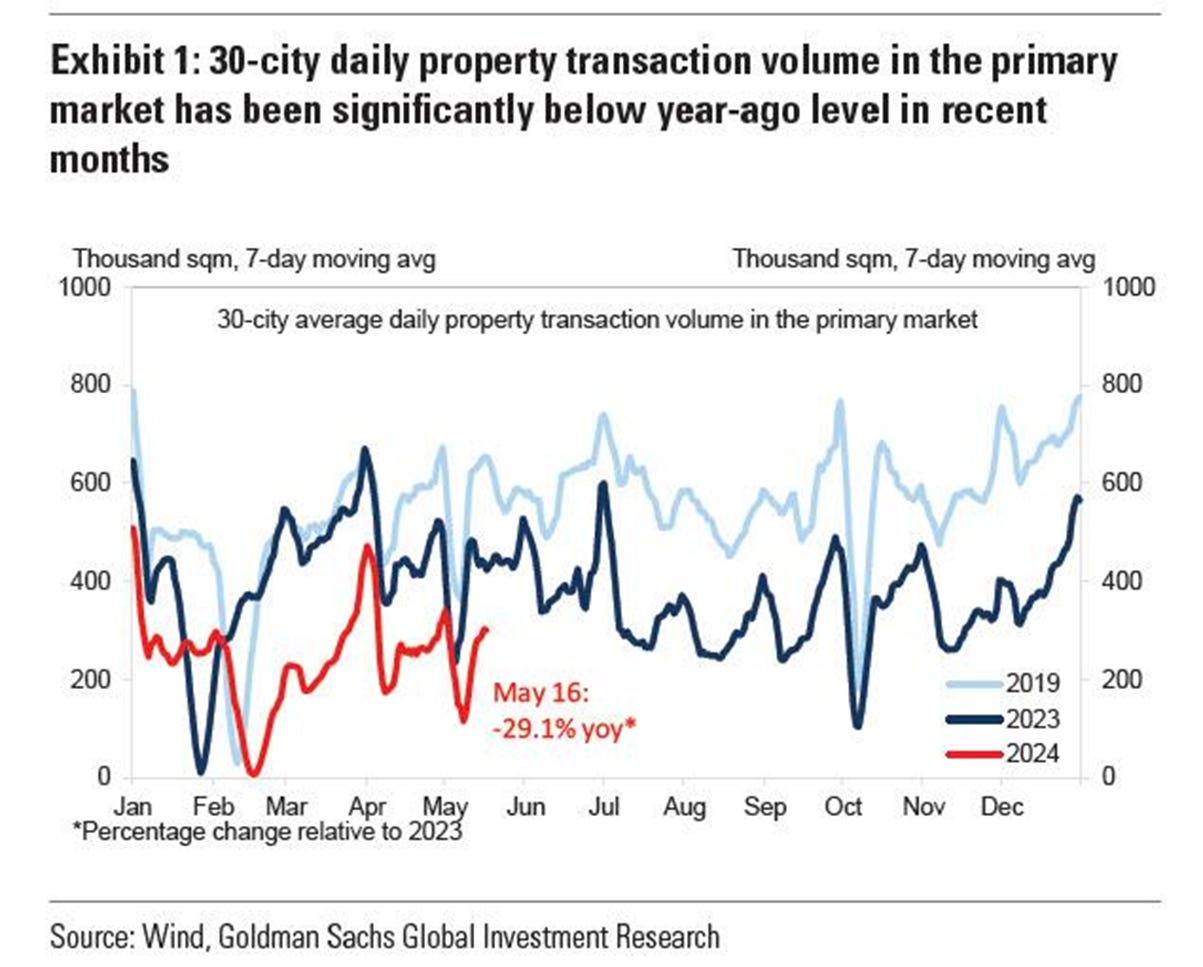
Also, likely related to the new government bond issuance, the Chinese government is considering a plan to purchase millions of unsold homes to clear the excess supply. Under this plan, local state-owned enterprises would be asked to help purchase unsold homes from distressed developers at steep discounts using loans provided by state banks and local governments. Many of the properties would then be converted into public housing. Officials are still debating the details of the plan and its feasibility, as it could take months to be finalized if China's leaders decide to proceed. There is an estimated CNY30 trillion (around USD4.0 trillion) in residential inventory by the end of 2023. If fully developed, this would be about 10 times what the market sold in 2023, or one-quarter of the total housing stock as of the end of 2023. The required capital investment for completing such inventory could be five times the construction CAPEX in 2023.
As an appetizer of what the Chinese government could do to settle the property crisis, the PBOC governor announced on Friday after markets closed in Asia that the PBOC will launch a CNY300 billion (~$41.5 billion) nationwide program of cheap funding to allow state-owned companies to purchase unsold homes and convert them into public housing (“保障性住房再贷款”). The funding will be directed at 21 providers, including policy banks, state-owned commercial lenders, and joint-stock banks. A rate of 1.75% will be offered. The low-cost loans have a one-year term and can be rolled over four times.
In the US, retail sales suggested that a consumption recession is underway. Headline retail sales were flat in April compared to a downwardly revised 0.6% in the prior month. This was lower than consensus expectations for 0.4%. Many categories saw declines on the month, and if not for the 3.1% increase in gas station sales, the reading would have been even worse. Online sales declined by 1.2% compared to 2.5% growth in the prior period. Since consumers typically shop online to find deals, a decline in those sales suggests that shoppers are not only price conscious but may also be pulling back on spending.
Walmart and Home Depot results showed that US consumers are less and less keen to invest in their homes in the current environment while becoming increasingly price-sensitive in an even higher for even longer interest-rate environment.
12-month Fwd EPS for Walmart (white line) & Home Depot (orange line).
The PPI, which was exceptionally released before the CPI, showed that the April Producer Price Index rose by 0.5% month-on-month, above the expected +0.3%, and the year-on-year reading increased to 2.2%, surpassing March's +2.1% and aligning with estimates. This marks the highest YoY reading since April 2023 and represents the fourth consecutive hotter-than-expected headline PPI print. Services costs soared, dominating April's PPI gains, with energy being the second most important factor. Interestingly, food prices actually declined on a month-on-month basis. Core PPI was even worse, rising by 0.5% month-on-month (more than double the expected +0.2% month-on-month increase), pushing the Core PPI YoY up to +2.4%.
The US CPI, while cooler than expected, will not quell the return of the inflation’s boomerang as a simple math for what lies for the balance of the year show leads to three simple conclusions:
A return to 2.0% is almost impossible in 2024. Even if the CPI prints a 0.0% MoM for the rest of the year, the YoY change will end at 2.22%.
If a 0.3% MoM change becomes the new normal for the rest of the year, the CPI YoY change will end 2024 at 4.70%, just 80 bps below the current FED Fund Rate, leaving the FED with no margin to maneuver to implement even one interest rate cut this year.
If the MoM change sees a 0.4% or higher change, which could be the case if the rebound in oil and commodity prices continues, the YoY change will end the year at 5.53% or perhaps above 6.0%, meaning that the FED will have to raise rates, even maybe before the November election.
Looking at the spread between core CPI and PPI for the US, the contraction experienced over since the start of the year is likely to pressure Corporate America margins and the recent valuation expansion seen for the S&P 500.
S&P 500 12-months forward P/E (blue line); Spread between US Core CPI & PPI (red line) & correlation.
Taking a longer-term view on inflation, investors should be aware that structurally higher inflation and a plutocratic political regime have historically led to civilizational collapse. Looking back to the Roman Empire in the 3rd century, it began to buckle under the weight of unsustainable state spending as it frantically printed money until things went horribly wrong. When Augustus slowed the expansion of the empire, wealth stopped flowing from conquered lands into the treasury, making it increasingly difficult to manage expenditures on construction, armies, and bureaucracy. Whenever costs exceeded tax income, emperors minted new coins to cover them, leading to an increase in the supply of gold and silver coinage through mining precious metals.
The army constituted an immense burden, consuming 70% of the entire budget by the mid-2nd century, with half a million soldiers on the payroll. However, crisis struck in the 3rd century as frontiers across the empire came under attack, causing military expenses to soar as entire provinces were abandoned and their tax yields lost, compounded by the drying up of the mines.
When soldiers' wages could no longer be paid, ‘debasing’ the currency became the only option. Emperors issued new denarius (the silver coin troops were paid in) with less and less silver content, thereby further increasing the money supply. Nero had already begun clipping coins and diluting silver purity in 64 AD. The state soon became addicted to this method of problem-solving, which also lined the pockets of political insiders. By 268 AD, the denarius contained only 0.5% silver, and a bag full of coins replicated the silver content of a single coin from a century earlier. By 300 AD, soldiers were paid 8 times more in denarius compared to a century ago, while wheat prices surged by 200 times.
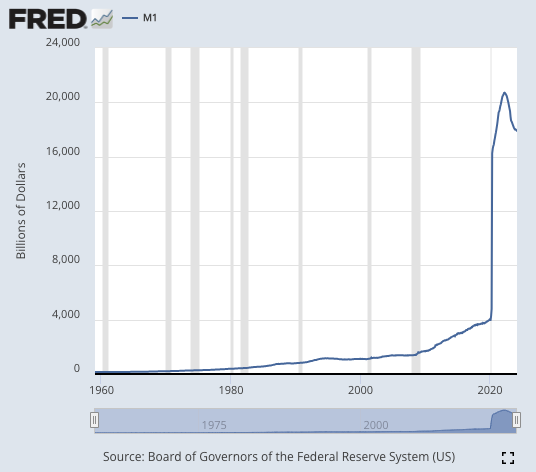
Unanchored inflation rates forced people to pay with their freedom. The currency became so worthless that the state resorted to forced labour rather than accepting its own coins as tax payment. Merchants were compelled to provide goods directly to the state and army, and leaving their trade was outlawed. By the time the 5th century barbarians arrived, belief in the system had vanished, and the invaders were seen as liberators. The empire could no longer afford the problem of its own existence. Does this brief flashback along the memory lane of history sound familiar? It is probably because 80% of all US Dollars in circulation today have been printed since Covid.
In a nutshell, the exploitation of the silver-to-gold ratio drained Roman silver reserves as the creditor oligarchy exported coinage to India and the East, where the ratio was as low as 4:1, compared to 12:1 in Rome. European gold and silver stores were depleted by 26 BC, leaving little plunder available. Debt played a monumental role in Rome's rise and fall, with an aggressive creditor oligarchy seizing land as collateral for unpaid debts, leading to widespread suffering described as ‘hell on earth.’ Both the church and the state exacerbated Rome's decline by seeking tribute and taxes, epitomized by Emperor Severus's directive to ‘enrich the men, scorn all others.’ Replace the emperor by the current political leaders in power in the so-called developed world and smart investors will find that the US empire will end like the Roman empire: bankrupted by its own plutocrats.
Coming back to 2024, in his speech in Amsterdam, the politically correct Jerome Powell, who still cannot see neither ‘the -stag’ nor 'the -flation', reiterated his broken record ‘Forward Confusion’ message of his 'strong commitment to restore price stability and providing full employment. However, he added that his ‘confidence is not as high as it was’ that inflation is cooling after seeing data from Q1 this year. As the world moves into a period of shortages driven by irresponsible policies linked to the Climate Change scam narrative and rising geopolitical tensions, cooling inflation will only be achieved by reducing drastically demand and therefore with higher, not lower, interest rates.
For the time being, the FED is attempting to smooth over the data, using language such as the economy presenting a ‘softer tone.’ Federal Reserve Bank of New York President John Williams believes monetary policy is ‘in a good place’ albeit ‘restrictive.’ Williams, like Chair Powell, stated that there are no indicators suggesting a need to lower interest rates. ‘I don’t expect to get that greater confidence that we need to see on the inflation progress towards a 2% goal in the very near term.’ Meanwhile, the myopic Wall Street still dreams of a FED pivot, with an 82% probability of a 25-bps cut by September. For now, the FED is caught between a rock and a paradox.
With more data pointing to an inflationary bust, while the bear steepener has been hit by foolish investors over the past weeks, the most likely outcome is an interest rate hike rather than after the November election and the un-inversion of the yield curve by the long end.
Over the past quarters, the investor recency bias has been that a weaker Japanese Yen is here to stay, and the Bank of Japan will continue to drag its feet in raising rates, while at the same time other DM central banks, led by the ECB and BOE and ultimately the FED, will pivot in their monetary policies.
Investors should be cautious about what they wish for the Yen in the coming quarters, as a weaker Yen presents both opportunities and challenges for Japan. For years, Japan has aimed for sustainable inflation around 2%. With the onset of the pandemic, a surge in energy prices, and one of the most extensive and enduring loose monetary policies witnessed in the history of global central banking, it may have finally reached this target. However, controlling inflation at the desired level is akin to manoeuvring a cargo ship: decisions must be made well in advance. Headline inflation in Japan is easing from recent peaks, aided by subdued oil prices over the past few months. Yet, the so-called core-core CPI (excluding fresh food and energy) remains stubbornly close to its all-time highs, with a mere ~0.5% difference. There are further indications of inflation taking root, as the percentage of inputs to the CPI basket (which boasts over 650 components, reflecting a complex level of detail) has surged to its highest level outside of a consumption tax hike and remains elevated.
Rising inflation poses a significant challenge for a nation with a large population of retired citizens reliant on pension schemes that aren't indexed to inflation. Although Japan is renowned for its social cohesion, the scenario of inflation spiralling out of control due to a structurally weaker Yen could potentially fuel social discontent, thus evolving into a political concern for the current government. In this context, it comes as no surprise that BOJ Governor Kazuo Ueda has been notably vocal in recent weeks, emphasizing the crucial role of foreign exchange in influencing inflation. His stance is justified. The recent weakening of the yen is poised to exert upward pressure on the Consumer Price Index once more.
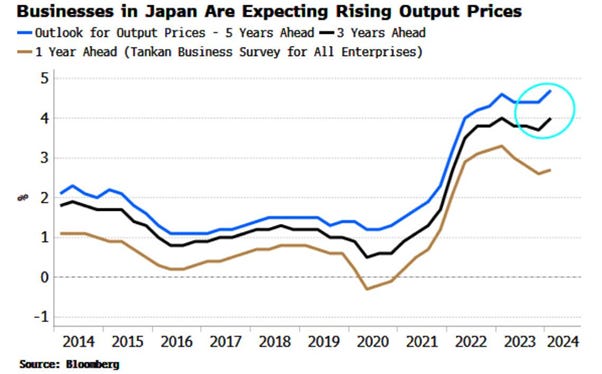
At the same time, longer-term inflation expectations are rising, as indicated by the Tankan survey of businesses on output prices, while long-term household expectations of inflation remain sticky and near series highs.
Japan has not had to deal with persistently high inflation expectations almost within living memory. Ueda also highlighted the negative effects on the economy from an abrupt, one-sided weak Yen. More pernicious is likely to be the further rousing of inflation that’s already looking like it’s going to be the gift to the BOJ that gives too much.
Japan CPI Nationwide YoY.
For equity investors, similar to Europe, the weakening of the currency is increasingly seen as a curse. While the Yen's decline has bolstered profits for exporters, historically driving Japanese stocks, the negative currency impact is becoming a liability for domestic consumer spending, akin to Europe's situation. It's important to note that with Xi Jinping aiming to 'Make China Great Again', a devaluation of the Yuan is highly improbable in the foreseeable future. This serves as another reason why investors seeking diversification outside US equities should consider ‘under-owned and unloved’ Chinese equities, rather than overcrowded Japanese and European equities, which are poised to struggle in the impending debt trap and have already underperformed their Chinese peers in USD terms year-to-date.
To grasp Japan's current economic state, let's look back at the past 70 years of history. Following the devastation of World War II, Japan embarked on extensive reconstruction efforts and transitioned to a democratic governance model, fostering societal stability conducive to investment. The post-war economic boom was propelled by prudent financial regulations, including controlled interest rates, and successful economic reforms. Notably, the Ministry of Finance imposed ceilings on both lending and deposit rates, catalysing a significant investment surge. Over subsequent decades, Japan's export sector experienced remarkable growth, transitioning from traditional goods like toys and textiles to more advanced products such as automobiles and electronics. In the early 1980s, amidst a global trend of financial deregulation, Japan began to liberalize its financial sector. Additionally, in the mid-1980s, the Bank of Japan aggressively intervened to prevent excessive Yen appreciation, which could harm the country's trade surplus, by implementing interest rate cuts. These measures led to a rapid expansion of money and credit supplies, fuelling a significant financial boom. This policy was part of what history books remember as The Plaza Accord.
The credit expansion fuelled significant growth in real estate and stock markets, leading to massive bubbles by the late 1980s. Residential real estate prices in Japan's six largest cities surged 58-fold since 1955, with a six-fold increase in the 1980s alone. At its peak, Japanese real estate values doubled those in the US, with anecdotes suggesting Tokyo's Imperial Palace grounds were worth more than all of California's real estate combined.
The Nikkei stock market index skyrocketed by 40,000% from early 1949 to late 1989, peaking in the late 1980s when Japanese equities' market value surpassed that of the US. The real estate and stock market booms were intertwined, with many listed firms on the Tokyo Stock Exchange being real estate companies heavily invested in major city properties. Construction boomed due to rising real estate prices and financial deregulation, with banks holding large real estate and stock portfolios. Rising collateral values allowed banks to expand loan portfolios, while industrial firms found real estate investments more profitable than traditional manufacturing. However, the bubble burst when the Bank of Japan raised interest rates in mid-1989 to deflate asset bubbles, resulting in a 38% stock market decline in 1990. Real estate prices fell more gradually but extensively, eventually bottoming out in spring 2003, with the Nikkei index hitting its peak on December 29, 1989, and breaking its previous record on February 22 of the following year before plummeting nearly 80%.
Nikkei Index (blue line); BOJ Unsecured Overnight Call Rate (axis inverted; red line) from 1969 to 1999.
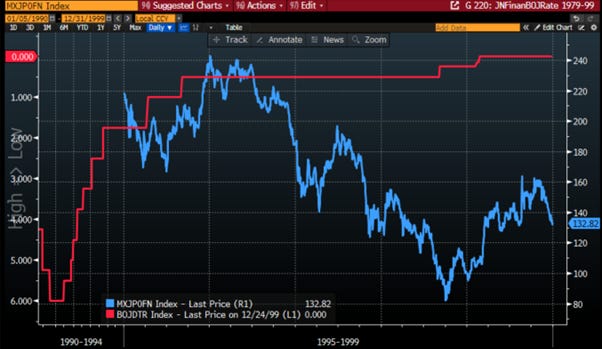
The banking sector's heavy reliance on real estate collateral led to a collapse in its value when the market crashed. Many industrial firms faced significant losses from their real estate investments. The combined impact of collapsing stock markets and real estate wiped out a substantial portion of banks' capital, pushing the banking sector toward insolvency. Credit creation halted, precipitating an economic downturn and financial crisis. Following the real estate crash, most major Japanese banks remained bankrupt throughout the 1990s. Japan's tradition of socializing banking sector losses and regulatory hesitance to close insolvent banks exacerbated the situation. While initially slow to respond, the Bank of Japan began lowering its target interest rate in 1991, eventually reaching zero by early 1999. As the crisis worsened, the BoJ assumed the role of lender of last resort, a crucial function in times of crisis. Additionally, it bailed out several financial institutions by providing funds to various entities. Such interventions were highly unusual, as central banks typically provide only liquidity, not capital, to banks, let alone private financial entities.
MSCI Japan Financials Index (blue line); BOJ Unsecured Overnight Call Rate (axis inverted; red line) from 1990 to 1999.
Amid public backlash against bank bailouts early in the crisis, the government permitted and sometimes encouraged banks to extend loans to struggling businesses. Accounting loopholes, coupled with limited transparency, enabled banks to downplay loan losses and inflate capital. While these measures salvaged the financial sector, they came at a steep cost. Without restructuring, bank lending plummeted and flowed disproportionately to unprofitable firms to mitigate further losses from bankruptcies. Post-bubble, the domestic non-traded goods sector harboured a significant share of the zombie firms, leading banks to sustain them to avert losses, thereby 'zombifying' the Japanese economy. Although government policies restored some trust in the financial sector, they allowed "zombie" banks to persist without recapitalization or clearing their books. Government subsidies and 'zombie-lending' perpetuated the operation of unprofitable firms while impeding the emergence of new enterprises. This stifled innovation, productivity, and investment, plunging the Japanese economy into a prolonged stagnation characterized by massive credit misallocation and declining productivity.
Japan GDP seasonally adjusted
When the private sector becomes overrun with so-called zombie companies reliant on easy credit, it severely hampers economic growth. This is evident in Japan's Total Factor Productivity (TFP) growth, which saw a marked decline from around 1992 to 2012. In 2018, TFP growth turned negative again, spiking in 2023. Comparing with the US series provides context. TFP reflects productivity at work. Increasing productivity typically leads to higher income and improved living standards. Conversely, stagnant or declining productivity reduces income and living standards unless supported by borrowing. If borrowed funds aren't directed into productive investments, the cycle of debt deepens without enhancing future income streams. Japan's prolonged productivity decline necessitated massive government borrowing and monetary stimulus to sustain living standards and the economy.
Consequently, Japan became the most-indebted major economy in the world. After the crisis of early 1990's, the leaders of Japan decided not to let the economy to crash, because of cultural issues. In Japan, bankruptcies are considered highly shameful often leading to suicides. While the bailout of the Japanese economy was understandable culturally, the fact is that the restructuring of the Japanese economy after the financial crisis was an utter failure. Today its government debt burden is worth around 250% of GDP compared to 125% for the US.
This explains why the BoJ has been reluctant to significantly raise rates, as Japan has limited room for manoeuvre in this regard. Japan needs to keep its budget deficit in line while achieving economic growth, as it can run a primary deficit without increasing government debt to GDP as long as its growth rate exceeds the interest it pays on its debt. Interest costs remain very low. In March, the Bank of Japan ended its policy of negative benchmark interest rates with its first hike in almost 17 years. Japan faces 27 trillion yen ($173 billion) in debt servicing costs this year, of which $62 billion is interest, according to the 2024 budget.
Currency and debt crises are closely intertwined due to the foreign exchange value of a currency reflecting international trust in the government. A currency crisis occurs when there's an ‘attack’ on the currency's exchange value in markets. If the exchange rate is fixed or pegged, this tests central bank commitment to the peg. Speculators focus on economic conditions relative to external factors like a stable exchange rate. If these are incompatible, such as with an unsustainable debt burden, authorities face a trade-off between external and domestic goals. In these scenarios, random shocks in foreign exchange markets, called sunspots, can trigger a currency attack, eroding investor trust and causing the currency's value to drop suddenly or crash. A crashing currency can raise the value of external debt, risking defaults by private entities and governments. Typically, a currency crash prompts central banks to raise interest rates to defend the exchange rate. However, if a government holds significant debt, like in the case of Japan, higher rates could lead to unsustainable debt service burdens and eventual sovereign default. Rising rates would further erode investor trust in the currency, creating a dilemma for central banks like the Bank of Japan, where raising rates could render the government's debt service unmanageable. The bailout of the Japanese economy in the early 1990s, which led to a slump in productivity and the subsequent high indebtedness of the Japanese government, is the main culprit behind the crash of the Japanese Yen. History has indeed shown that the USD/JPY exchange rate doesn’t necessarily follow central bank policies.
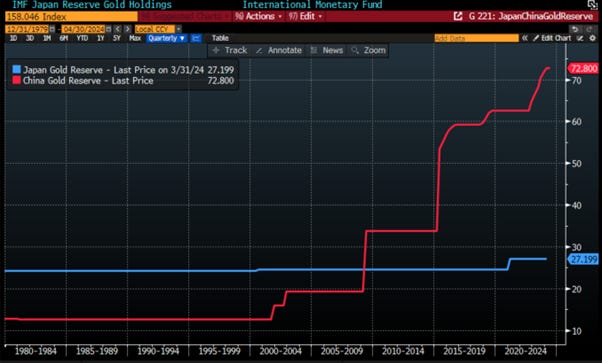
Perhaps one of the most intriguing aspects of Japan's economy is its reliance on US treasuries for almost its entire foreign reserves, with minimal holdings in gold. Indeed, gold comprises only 4.3% of Japan’s FX reserves, like China.
However contrary to China, Japan has not been buying gold since 2021 and its gold reserve has been mostly unchanged since 1980.
Japan Gold Reserve in million troy ounces (blue line); China Gold Reserve in million troy ounces (red line).
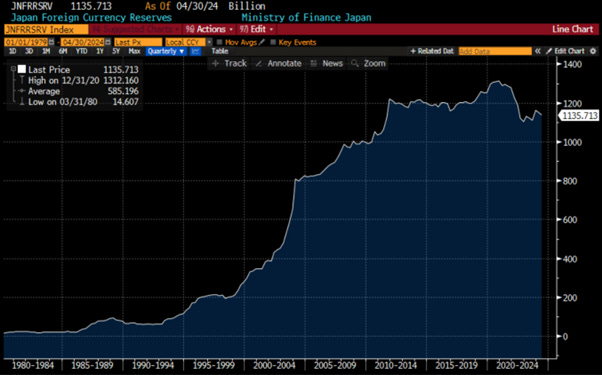
While China currently holds larger foreign reserves than Japan, it's noteworthy that Japan essentially pioneered the concept of sovereign bonds as foreign exchange reserves. During the gold standard era, if a country like the US wished to consume more than it produced, it would be required to transfer gold overseas, which was constrained by limited gold supply. Transitioning to a treasury-based financial system effectively removed this limitation, with the only concern being whether other governments would accept treasuries as reserves.
Japan Foreign Currency Reserves.
The question that should concern all investors is why Japan began to emerge as one of the largest holders of US treasuries. The answer is straightforward: when the Japanese bubble burst in the 1990s and the BOJ slashed rates to near zero, Japan remained a major trade partner of the US. Consequently, Japanese entities had significant USD to recycle from their trade relationship with the US. With rates at zero domestically, US treasuries became the obvious investment choice for Japanese companies and individuals.
Spread between US 10-Year Yield & Japanese 10-Year Yield (blue line); Japan Foreign Currency Reserves (red line).
In a nutshell, when a government favours capital interests, it aims to devalue its currency to lower worker wages, fostering a trade surplus. This typically leads to currency appreciation, but if the government seeks to maintain a competitive exchange rate (keeping real wages low), it must acquire more treasuries. What's unusual is that despite the BOJ's sluggish monetary policy response, Japan's Ministry of Finance has begun using foreign reserves to bolster the Yen. This entails Japan intervening in currency markets to strengthen the Yen by selling US treasuries, highlighting the significance of Japanese doom loop for US and global investors. Another challenge Japan faces in the current environment is the absence of the structural trade surplus it enjoyed from 1980 to 2010. This shift is attributed to the structural increasing cost of energy in Yen and heightened competition in international trade, particularly from China and other countries in the Global South. These competitors have gained market share in sectors like automotive and technology, which were previously dominated by Japan in the 1990s.
Japan Trade Balance (blue line); WTI price in JPY (axis inverted, red line).
With falling foreign exchange reserves, a trade deficit, and the anticipated rise in defence spending prompted by rising geopolitical tensions around the South China Sea, BOJ policy appears increasingly misguided. Market sentiment aligns with this view, as evidenced by 10-year JGB yields reaching 13-year highs and a rising yield curve since the beginning of the year.
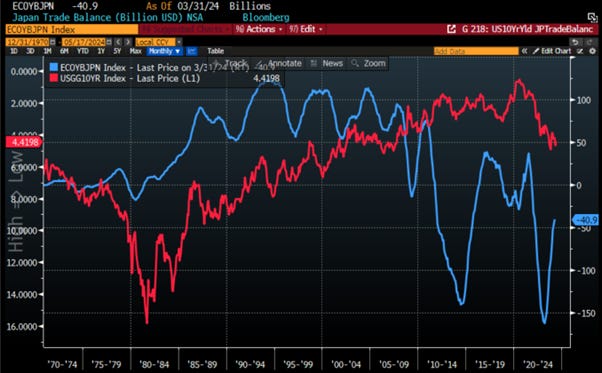
In this scenario, Japan is, slowly but surely, caught in a financial doom loop regardless of who occupies the White House and what the FED does next. Japan will need to sell more foreign reserves to support its currency, leading to higher US yields. This, in turn, could further weaken the Yen, perpetuating the cycle. Unless the BOJ adopts a more assertive stance, Treasuries may see a shift from being systematically bought to being systematically sold by Japanese investors. As countries in the Global South are likely to sell treasuries and buy gold for political and strategic motives, Japan will have to sell treasuries for economic reasons.
Japan Trade Balance (blue line); US 10-Year Yield (axis inverted, red line).
So while Japan was the key to understanding why treasuries did so well from 1980 to 2020, it will also be the key to why treasuries are likely to perform poorly from 2020 onwards. Therefore, long-dated US government bonds, once upon a time considered THE ‘risk-free asset’, will no longer be ‘Free of risk’.
WHAT’S ON THE AGENDA NEXT WEEK?
As we move into the week of Pentecost and Vesak days in 2024, investors will need to focus on multiple FED speeches, particularly Jerome Powell's on Monday, which is likely to attract the most attention. The US economy will be gauged by the Manufacturing & Services Flash PMI data on Thursday, and the week will conclude with the University of Michigan Inflation Expectations and Consumer Sentiment Surveys. Internationally, the Japan CPI will be a key point of interest. In terms of earnings, the Q1 2024 season wraps up with Palo Alto Networks reporting on Monday and Nvidia on Wednesday. Fixed income investors will be closely watching the US 20-Year Bond Auction on Wednesday.
KEY TAKEWAYS.
As the world prepares for another week rich in macroeconomic news flow, here are the key takeaways:
The China Retail Sales and Industrial Production data showed an increasing divergence between supply and demand in the economy, which the government needs to address at its next congress meeting in July.
· The Chinese government’s decision to ‘nationalize’ unsold properties built during the last property bubble is a first step toward normalizing the property market, which will require additional measures to address what remains a major headwind to Make China Great Again.
The latest US Retail sales suggest that a consumption recession is underway.
The US PPI, exceptionally released before the CPI, shows that more input prices pressures related to energy and services will flow through the economy later this year.
The latest US CPI, while cooler than expected will not quell the ‘Inflation Boomerang's Return’.
Jerome Powell's recent comment confirmed that the FED is caught between a rock and a paradox.
History repeats because human nature never changes and that’s why like the Roman Empire, the US empire is set to collapse in the next decade.
Weaker Yen is a threat to reignite higher inflation in the country of the rising sun.
The post WW2 economic history which was sprinkled by boom and bust for Japan and led to Japan being the most indebted country among the G10.
Weaker Yen leading to higher import prices put an additional pressure on Japan trade balance which is negatively impacted by rising competition with the global south.
Whatever the FED does next, Japan has just entered a financial doom loop which will contribute to structurally higher US Treasury Yields.
Japan was the key to understanding why treasuries did so well from 1980 to 2020, it will also be the key to why treasuries are likely to perform poorly from 2020 onwards. In this context, long-dated US government bonds, once upon a time considered THE ‘risk-free assets’, will no longer be ‘Free of risk’.
Rather than chasing the Nikkei long crowded trade, long-term equity investors looking to diversify from US equities are better off investing in Chinese equities as Xi is on the path to ‘Make China Great Again’.
In this context, trust in western public institutions will continue to decline, leading investors to move even more into assets with no counterparty risk and which are non-confiscatable, like physical gold.
For fixed income investors who are still chasing the long duration trade in US government bonds, more pain awaits as long-dated yields must reflect the new stagflation reality.
In a stagflation, the best way to protect wealth is still to own the equity barbell portfolio made of Tech and Energy and Physical Gold and avoid long dated bonds.
As stagflation rather than recession materializes as the economy is increasingly weaponized, investors should prepare their portfolios for HIGHER volatility.
In this context, investors should also remain prepared for dull inflation-adjusted returns in the foreseeable future.
HOW TO TRADE IT?
After last week's dismal economic data, which prompted a run to record highs in major US indices, with the Dow Jones crossing above the symbolic 40,000 level, investors should remain 'strategically patient.' Rising volatility, driven by renewed geopolitical tensions, could push equity indices back to key support levels in the coming weeks, providing an attractive buying opportunity for those sitting on the sidelines with cash.
With investor sentiment shifting back to euphoria and the return of the ‘meme stocks’ mania, it's no surprise that the rally was dominated by growth sectors like IT and Communication Services, while Real Estate benefited from renewed hopes for a still illusory FED pivot. In contrast, Materials, Consumer Discretionary, and Industrials suffered from increasing signs of an impending recession, which is likely to evolve into stagflation in the coming months.
Investors looking to benefit from the impact of the Japan Doom Loop on US Treasury yields might consider the ProShares UltraShort 20+ Year Treasury (TBT US), which seeks to deliver twice the inverse of the daily performance of the ICE US Treasury 20+ Year Bond Index.
Investors can look at a retracement to the 38.2% Fibonacci Retracement (USD34.5) as an attractive entry point.
At The Macro Butler, our mission is to leverage our macro views to provide actionable and investable recommendations to all types of investors. In this regard, we offer two types of portfolios to our paid clients.
The Macro Butler Long/Short Portfolio is a dynamic and trading portfolio designed to invest in individual securities, aligning with our strategic and tactical investment recommendations.
The Macro Butler Strategic Portfolio consists of 20 ETFs (long only) and serves as the foundation for a multi-asset portfolio that reflects our long-term macro views.
Investors interested in obtaining more information about the Macro Butler Long/Short and Strategic portfolios can contact us at info@themacrobutler.com.
Unlock Your Financial Success with the Macro Butler!
Disclaimer
The content provided in this newsletter is for general information purposes only. No information, materials, services, and other content provided in this post constitute solicitation, recommendation, endorsement or any financial, investment, or other advice.
Seek independent professional consultation in the form of legal, financial, and fiscal advice before making any investment decisions.
Always perform your own due diligence.


