Gold-Fever
THE WEEK THAT IT WAS...
The week of Pentecost and Vesak was all about another set of soft data, including flash PMI data, consumer sentiment, inflation expectations in the US, and US bond auctions. Outside the US, the focus was on Japan's CPI.
In Japan, while the CPI cooled to 2.2% year-on-year at the core level, in line with estimates, this likely reflects companies restraining price hikes in response to sluggish consumer demand. With the core gauge still above the Bank of Japan’s 2% target, this data is unlikely to deter the central bank from further normalizing its policy by the summer.
In the US, the Flash PMI data pointed to another potential rebound in the economy, with the flash US services business activity at a 12-month high and the US manufacturing PMI at a 2-month high. To rub more salt into the wounds of those thinking that inflation is a thing of the past, factory input prices advanced at the fastest rate since November 2022, and the prices paid and received metrics for service providers also picked up.
The final print of the University of Michigan inflation expectations actually rose MoM from 2.9% to 3.2% for the next 12 months, although this is down from the preliminary 3.5% reading. While the final May consumer sentiment index improved from the preliminary reading, it still registered a notable 8.1-point decrease from April, standing at a six-month low of 69.1.
Confirming that the US economy is slowing down further, sales of US existing home unexpectedly fell for a second month in a row in April. At the same time, the median selling price reached a new all-time high for any April data back to 1999. Unlike in the new-home market, where rising inventories and the prevalence of incentives by builders pushed prices down on a yearly basis, the US home resale market is experiencing rising YoY price growth.
The earnings season experienced its ‘grand finale’, concluding with another Nvidia firework. Taking a broader perspective, earnings growth has been the highest in the past year, but sales growth has been the weakest since Q3 2023.
However, market reactions have been mixed due to weaker guidance.
This translated into almost unchanged earnings revisions for the S&P 500. The IT sector led the trend higher, while healthcare and industrials recorded the most negative EPS revisions since the start of the second quarter.
Last week saw a flood of FED talk that offered something for everyone: rates could fall by the end of the year, or they might not, it all depends on the data. Additionally, the neutral rate could be where the FED thinks it is, or it might be higher. Paul Krugman himself admitted to being ‘fanatically confused’ about what will happen with rates going forward.
Even Jamie Dimon added his pinch of salt about the current monetary policy and inflation outlook, highlighting his "cautiously pessimistic" view on the impact of quantitative tightening. He pointed out that inflation at 4%, rather than the target of 2%, now poses a significant risk.
The minutes of the ‘MayDay’ FOMC meeting highlighted that ‘Various participants mentioned a willingness to tighten policy further should risks to inflation materialize in a way that such an action became appropriate.’
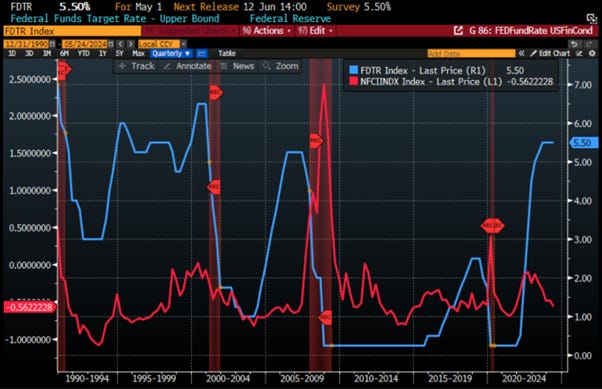
On financial conditions, ‘A number of participants noted uncertainty regarding the degree of restrictiveness of current financial conditions and the associated risk that such conditions were insufficiently restrictive on aggregate demand and inflation. Although monetary policy was seen as restrictive, many participants commented on their uncertainty about the degree of restrictiveness.’ This comes at a time when financial conditions have returned to the same level they were at before the current interest rate hike cycle began.
FED Fund Rate (blue line); Chicago FED US Financial Conditions Index (red line)
So, the FED is still attempting to smooth over the data, entertaining the myopic Wall Street dreams of a FED pivot, with an 54% probability of a 25-bps cut by September. In a nutshell, the FED remains caught between a rock and a paradox.
With more data pointing to an inflationary bust, the bear steepener made a shy return over the past week. In this context, the most likely outcome is an interest rate hike after the November election and the un-inversion of the yield curve by the long end.
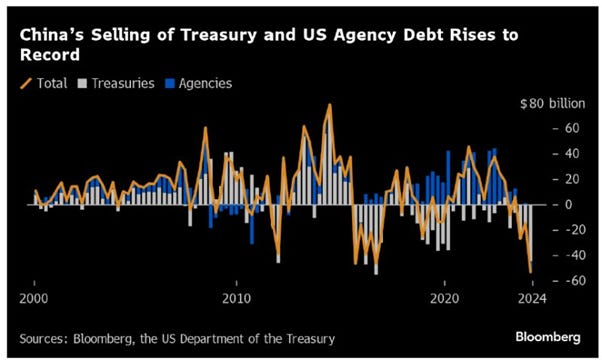
As the economy is increasingly weaponized and the world moves toward WW3, driven by the warmongers in Washington and Brussels, it is no surprise that China announced that it sold a record amount of US Treasury and agency bonds in Q1 2024. Beijing offloaded a total of $53.3 billion of Treasuries and agency bonds combined. Belgium, often seen as a custodian of China’s holdings, disposed of $22 billion of Treasuries during the period.
While China selling dollar assets, its holdings of gold have risen in the nation’s official reserves. The share of the precious metal in the reserves climbed to 4.9% in April, the highest level recorded since central bank data collection began in 2015.
China Gold holding (blue line); China holding in US Treasury.
China would be stupid if they did not start to dump every penny of US debt because when the Washington and Brussels’ warmonger start a new war, they will default on all debt held by foreign enemies, which they define as anyone who opposes their Malthusian agenda.
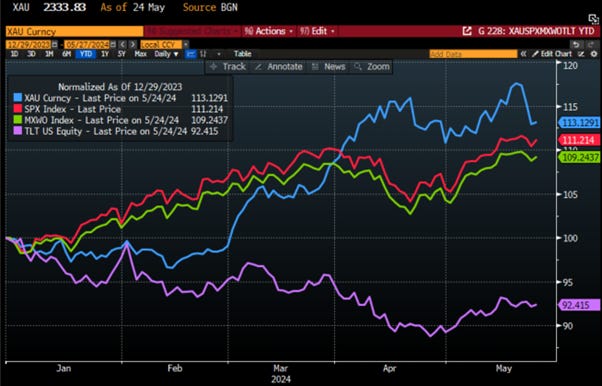
Since the start of the year, gold is up by some 13% in US dollar terms. Everyone’s favorite “pet rock” is thus outperforming the S&P 500 by roughly 2%, the MSCI World Index by 4%, and long-dated US treasuries (TLT US ETF) by an outstanding 20%. This is unusual, as it is rare for gold to outperform both bonds and equities by such amounts in a such short period of time. Success has many fathers, and several factors can be found to explain the rally of gold (and that of silver).
100$ invested on December 31st 2023 in Gold (blue line); S&P 500 index (red line); MSCI World index (green line); iShares 20+Year Treasury Bond ETF (purple line).
Since the start of the conflict between Ukraine and Russia and the subsequent weaponization of USD assets, investors have rediscovered the need to hedge their risk against government. This has led to a renewed interest in the "barbaric relic" (i.e., physical gold) among investors who are not naive enough to believe in Wall Street's ‘Forward Confusion.'
There are numerous factors that drive the price of gold, but the dilution of ‘fiat or paper currencies’ is one of the most significant. Over the past five decades, all of the world’s major currencies have been downgraded to mere ‘paper’ currencies, unbacked by gold. This shift has predictably led to an explosion in the global money supply and the ensuing erosion of these currencies’ purchasing power. To put it in layman’s terms, a rising money supply harms the value of currencies and contribute to inflation or higher living costs. When the costs of housing, groceries, car insurance, healthcare, and college education all rise together, one can attribute this to the debasement of paper money and shortages in the supply of physical goods. When currencies were backed by gold, it was impossible to dilute them as paper currencies are diluted today because every currency unit required a certain amount of gold backing it, and it was impossible to print or conjure gold out of thin air. For that same reason, people turn to the safety of gold when paper money is being diluted by lower confidence in public institutions to solve the economical and societal issues which are contributing to a higher cost of living. Indeed, the US M2 money supply, which measures broadly all the USD cash available, has more than quadrupled since the early 2000s, one of the major factors behind gold’s long-term uptrend that began at that time.
Though paper money typically dilutes over time, this process accelerated dramatically after the 2007-2008 Global Financial Crisis due to government bailouts, fiscal and monetary stimulus, and quantitative easing. The 2020 COVID-19 pandemic caused an even more drastic increase in money supply as central banks, including the US Federal Reserve, injected trillions of dollars in stimulus to prop up economies and financial markets during lockdowns at a time where there were shortages of goods and services.
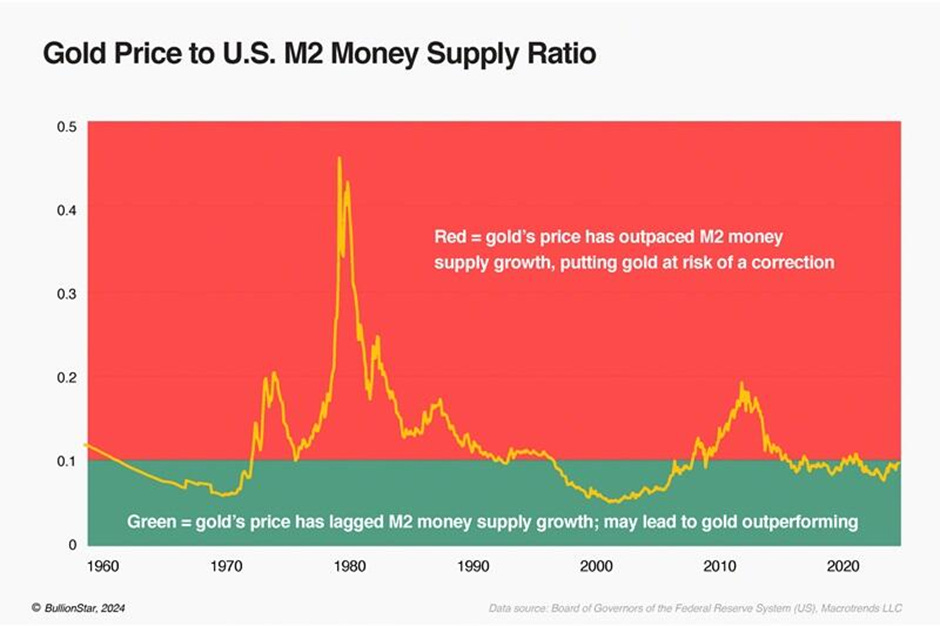
Examining the ratio of gold’s price to the M2 money supply helps determine if gold is keeping up with, outpacing, or lagging behind money supply growth. If gold’s price greatly outpaces money supply growth (red zone in the chart), a strong correction is likely. If it lags behind (green zone), gold may soon strengthen. Since the mid-2010s, gold has slightly lagged behind M2 money supply growth, indicating a potential period of strength ahead which will be emphasized by additional factors.
Nobel Prize-winning economist Milton Friedman succinctly described the process of how the money supply erodes the purchasing power of a paper currency: ‘Inflation is always and everywhere a monetary phenomenon.’ Since 2000, the US dollar has lost nearly half of its purchasing power, largely due to the reckless monetary policies of the Federal Reserve, which is supposed to be a good steward of America’s currency but has proven to be the exact opposite. Investors have also to understand that inflation is also the equivalent of an implicit default on sovereign debt as it is the manifestation of a lack of solvency and credibility of the currency issuer.
Governments mask fiscal imbalances by gradually reducing currency purchasing power, achieving two goals: Inflation serves as a hidden tax, transferring wealth from savers and wages to the government, while also expropriating wealth from the private sector. The financial system falsely assumes sovereign bonds as the lowest-risk asset, incentivizing banks to hold them. This regulation promotes state intervention and crowds out the private sector, hampering economic potential. When fiscal space is depleted, government crowding out of credit and rising taxation cripple the productive economy, favouring government liabilities. In this context, as inflation is a policy and an implicit default, traditional portfolios that use government debt rather than physical gold as an antifragile asset may fail.
US public debt to GDP (blue line); Inflation adjusted return of Physical Gold (red line) and Bloomberg US Agg Fixed Income Index (green line) rebased at 100 as of December 31st 1992.
Using the US 5-year CDS spread as a proxy for fears of shocks to US sovereign debt or to the broader global financial dollar system, it has also shown a high correlation with the price of gold.
US 5-Year CDS (blue line); Gold price in USD (red line) & Correlation.
To summarize, it is not a surprise that gold began a powerful uptrend in the early 2000s when governments and central banks started to debase ‘paper currency’ to finance reckless government spendings. Over the next decade and beyond, the western world will witness a staggering increase in debt and the money supply, leading to severe inflation.
One reason investors should consider gold rather than fixed income to hedge their exposure to equities is that not only should investors expect further weaponization of the economy in an increasingly bipolarized world, but also because in a persistently inflationary environment, as has been the case since the start of the Covid pandemic, gold will continue to provide the necessary hedge as government bonds lose value on an inflation-adjusted basis.
Inflation adjusted return of $100 invested in the Bloomberg US Agg Index (blue line); S&P 500 index (red line); Gold (green line) since December 31st 2019.
Indeed, while the FED chairman still cannot see either 'the stag' or ‘the flation’, the US economy is heading into stagflation. It's important to remember what stagflation is. Stagflation occurs when the economy experiences inflation alongside low GDP growth and high unemployment. For investors, the last time the US had to deal with stagflation was in the 1970s.
While the incoming stagflation may not be as severe as the one experienced in the US over the late 1970s and early 1980s, both gold and the USD index rise at the same time as the US 10-year yield, rendering government bonds useless as an alternative to equities in a diversified portfolio.
Stagflation proxy index (histogram); Gold price in USD (red line); USD Index (DXY Index) (green line); US 10-Year Yield (purple line).
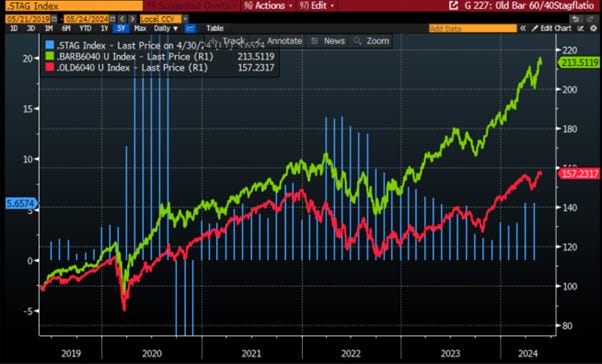
This renders the traditional 60/40 portfolio, which has been promoted by Wall Street over the past years, obsolete. Instead, a barbell 60/40 portfolio consisting of 30% IT stocks, 30% energy stocks, and 40% physical gold emerges as the obvious choice for investors, as has been the case since the start of the Covid Pandemic.
Stagflation proxy index (histogram); Evolution of $100 invested in Old 60/40 Portfolio (red line); Barbell 60/40 portfolio (green line) as of December 31st 2019.
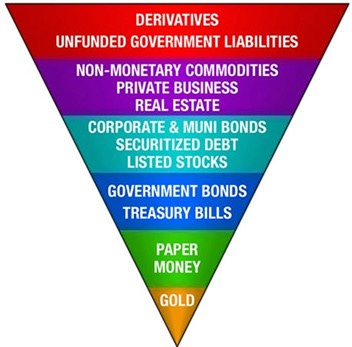
Another catalyst for gold to shine further is the weaponization of the economy, which has prompted investors to reassess their investments in terms of counterparty risk. John Exter's Inverted Pyramid of Risk, introduced in the 1970s, provides insight into America's vulnerabilities, especially amid an impending credit crisis centred around the USD. The pyramid organizes assets from highest to lowest risk, highlighting the interconnectedness where the removal of lower-risk assets can lead to a collapse of higher-risk ones, akin to a Jenga tower. The famous quote of John Pierpont Morgan ‘Gold is Money; Everything else is Credit’ is a good summary of the principle exposed in the Exter’s inverted pyramid of risk.
As we explained previously, during credit expansions, capital moves up the inverted pyramid toward higher-risk, lower-liquidity assets, reflecting investors' willingness to take on greater risks for higher returns. As the pyramid broadens, capital is reused as collateral multiple times, amplifying theoretical contracted capital on higher layers, such as the derivative layer. In a crisis, capital is moving down the pyramid towards lower-risk assets like bonds, cash, and gold, illustrating a return to stability. The insight from John Exter's pyramid underscores the unseen layers of risk in financial flows, urging a broader consideration beyond balance sheets in investment decisions. Amidst flaws in the financial system, gold offers liberation from credit and government risks and currency devaluation. As sovereign debt defaults loom and trust in public institutions to solve economic and societal issues shrinks, investors will more and more focus on asset with no counterparty risks like gold which is emerging as the only antifragile asset.
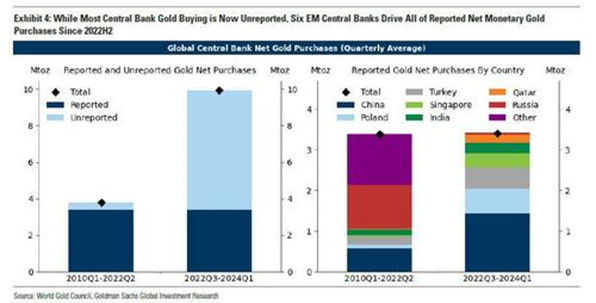
In the context of the weaponization of USD assets, it's not only the Chinese central bank driving demand for physical gold over dollars (i.e., US Treasuries) since mid-2022. New geopolitical and financial shocks have also pushed gold prices higher. Central banks, especially those in Emerging Markets, have been key drivers of the gold rush. Global central bank gold purchases have tripled since Russia’s invasion of Ukraine. Six EM central banks: China, Poland, Turkey, Singapore, India, and Qatar account for all reported net monetary buying since mid-2022. However, most central bank gold buying remains unreported. Geopolitical and financial shocks drive central bank demand, with fears of such shocks explaining gold buying well. The tripling in central bank gold purchases to about 10 million Troy ounces (Mtoz) per quarter since mid-2022 is a key feature of the new ‘unshakeable bull gold market.’
A closer examination of the increase in unreported purchases fully explains the tripling in global central bank gold purchases since mid-2022, relative to the period of 2010-2022 H1, while reported purchases have remained stable. Despite the significant increase, EM official gold holdings likely have further room to grow as their 6% average share of official reserves remains about 50% lower than the 12% share in DMs.
In a 2023 World Gold Council survey, 37 EM responding central banks cited financial and geopolitical factors as key influences on their gold holding decisions. The most cited relevant factors for holding gold are 'inflation hedging', 'performance during times of crisis', and 'no default risk' on the financial front, and 'geopolitical diversification', 'no political risk', and 'sanctions concerns' on the geopolitical front. However, the most likely reason behind the flood of EM gold purchases is also the simplest one: as the Russian example vividly showed, if ‘your’ money is held by some other banks or is contained in the Dollar payment system (SWIFT), it is not really your money. As such, gold, which is the only counterpart and liability-free currency (as J.P. Morgan himself testified before Congress in 1912, ‘Money is gold, and nothing else’) has quickly emerged as the preferred form of reserve storage.
History also suggests that financial and geopolitical shocks drive EM central bank gold purchases. For example, in 2009, the Chinese Prime Minister expressed concerns about China’s US investments, leading to a proposal by the PBoC head to shift from the dollar as a reserve currency. Official Chinese gold reserves have more than tripled since then. On the geopolitical front, sanctions and freezing of central bank assets have often coincided with gold price spikes. The first round of sanctions on Russia in 2014 prompted a gold reserve buildup by the Central Bank of Russia, anticipating scenarios similar to those in Libya and Iran. The 2022 freezing of Russia’s Central Bank assets prompted many central banks, including Poland’s, to reassess what they consider counterparty-free.
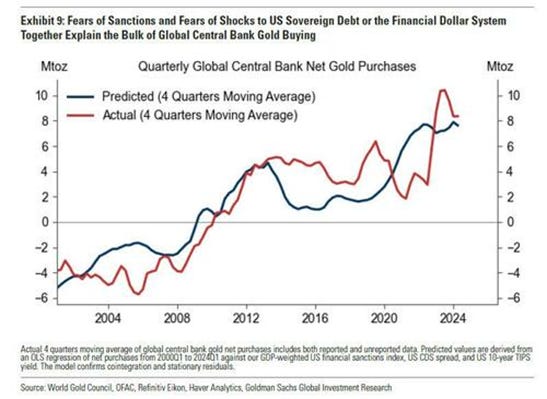
To quantify geopolitical shocks, Goldman Sachs has constructed a US financial sanctions index in two steps. First, it identified financial executive orders from the US Office of Foreign Assets Control (OFAC) by targeted country. Second, it weighed each US financial sanction based on the target country’s share in global GDP to capture the greater impact when larger economies are sanctioned. As no surprise, the US financial sanctions index has risen sharply since 2016 with new sanctions on Russia, Venezuela, and China.
Over the past 20 years, there has been significantly positive effect of the ‘sanctions index’, the proxy for geopolitical fears, on global central bank gold purchases. This clearly underscores the hedging value of gold against an adverse geopolitical scenario, in which equity-bond portfolios would likely suffer.
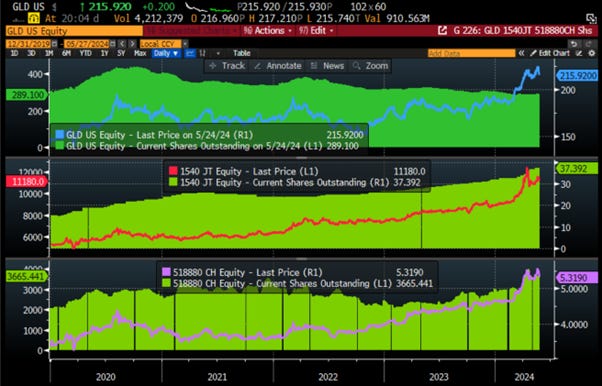
For the time being, almost all physical buying of gold emanates from emerging economies, with some 30% of global purchases made in greater China, another 25% in greater India, 20% in the broader Middle East, and around 10% in Russia and countries in the Commonwealth of Independent States. This demand might result from cultural biases or rich people in EMs not trusting their governments, the local rule of law, or even the solidity of domestic financial intermediaries. This makes gold a natural destination for savings in such economies. It explains why gold tends to be bid up when emerging markets do well (2001-11) and why it is sold when EM entrepreneurs struggle. In a nutshell, for over 20 years, gold has also been a ‘low beta’ way to play EM growth. To gauge the interest of retail investors in the recent gold bull run, a look at the number of shares outstanding in various listed physical gold ETFs is probably the best way to capture that trend. As most investors would have expected US retail investors, many of whom are YOLO and have been influenced by the 'Forward confusion' narrative, to pour into US long-dated government bonds and Bitcoin ETFs rather than the barbaric relic, have not participated in this latest gold rally. On the other hand, Chinese retail investors, who have a long tradition of holding gold as a way to transfer wealth to their heirs, and even recently Japanese investors, who have likely started to feel that their country is in a financial doom loop, have been following EM central banks into buying gold.
Current share outstanding (histogram) in SPDR Gold Shares ETF (GLD US) and price (blue line) (panel 1); MUFG Japan Physical Gold ETF (1540 JT) and price (red line) (panel 2); Huaan Yifu Gold ETF (518880 CH) and price (purple line) (panel 3).
Investors must remember that Physical Gold is the ONLY hedge against government risk. Despite being scorned in the Western world by Wall Street and the mass media, which propagate the government's ‘Forward Confusion’ narrative, the current bull market in Gold is likely still in its infancy as investors and citizens are losing more and more trust into public institutions to solve economic and societal issues of the post-Covid world.
The last question investors should ask themselves is how the current valuation of gold looks in such environment. In capitalist economies, the promise of the future lies within the productive sector and can be captured by investors through holding equities. Therefore, today’s debt-wary investor faces a dilemma that boils down to a simple expression: gold or equities? Past or future? Since 1954, the ratio between the S&P 500 and gold has averaged around 70 times, with mean reversion occurring six times, three times from gold being overvalued (fear) and three times from the stock market being overvalued (greed).
Gold to S&P 500 ratio (rebased at 100 as of 31st December 1953).
The comparison between current efficiency levels in the economy’s wealth-generating ‘productive sector’ and those of the past can be observed by measuring the S&P’s annual earnings in gold-equivalent terms. Increasing earnings signal a brighter future than the past, and vice versa. This is evidenced by the evolution of S&P 500 earnings expressed in grams of gold over a span of more than 50 years, along with oscillations in their annual trends.
Interestingly, these fluctuations reveal a periodicity of four years, even if one observes phase shifts during financial crises. This confirms the political nature of the gold cycle, probably linked to US presidential elections.
From a more general point of view, if an economy can be reduced to the concept of being ‘energy transformed’, gold can be considered as past excess savings invested in a generally accepted reserve of value. Hence, gold can be transformed into energy by exchanging it for oil, allowing the seller to participate in the current economy. The S&P 500 itself represents the most efficient use of energy, but its value could change abruptly if the price of energy were to suddenly rise or fall. Therefore, it is extremely fragile, as any change in the price of oil could have a massive impact on its valuation. In contrast, gold is antifragile because it tends to maintain a relatively fixed value versus oil, typically around 18 barrels per ounce. On that matter, oil looks particularly cheap versus gold for the time being.
Gold Oil ratio.
Over time, there should be periodic convergences of the S&P 500, the gold price, and the oil price. In fact, since 1972, they have converged three times, with the last one occurring in 2015. Since then, they have diverged, following their regular pattern. They will likely converge again, probably sooner rather than later. If anyone can work out that timeline, they will have no problem investing their capital.
For now, gold looks particularly undervalued compared to the S&P 500 when we look at the long trend, especially looking at the historical trend of retained earnings. At the same time, oil looks also undervalued compared to gold.
At the end of the day, investors must weigh between owning future dividends through the S&P 500 and past income through physical gold. Hence, at this point, the preference, based on the relative position of the two reserve assets, is to favour gold, followed by equities and avoid government bonds. For the time being, investors have favoured energy consumers as expressed in the S&P 500 rather than the inventory of past energy usage, as reflected in the gold price. At the same time, very few people seem to expect a structural rise in the price of oil. The same people do not expect a sustained rise in the inflation rate caused by a deficit in the production of primary energy and the adoption of regulation pushing to more shortages. Those who do expect a new rise in inflation and further geopolitical and social unrests have already bought gold. Many people lost buckets of money investing in bonds between 1972 and 1982. Today, the markets are where they were in 1970: massively short of energy, short of gold, and very long government bonds. It was not a good idea then and it is unlikely to be a great idea for the incoming decade.
Considering all this, gold is not expensive at all; it is exceedingly cheap. Central banks and policymakers understand that there will be two ways to square the public accounts with trillions of dollars of unfunded liabilities: repay those obligations with a worthless currency or default under the pretext of war. In this context, staying in cash is dangerous, accumulating government bonds is reckless, but rejecting gold is denying the reality of money.
WHAT’S ON THE AGENDA NEXT WEEK?
As we move into the last week of the second month of the second quarter of the year, the news flow is expected to lighten as the UK and the US start the week with a long weekend. Aside from another flood of FED speakers dominated by Governor Williams, the most important macroeconomic data will be the US Core PCE index, to be published on Friday. Outside the US, the focus will be on the Euro-zone CPI index on Thursday and the China Manufacturing and Non-Manufacturing PMI. The final leg of the Q1 earnings season will see Salesforce, Rolls Royce, and Costco publishing their results on Wednesday and Thursday, respectively.
KEY TAKEWAYS.
As the world prepares for the end of another month, here are the key takeaways:
A cooler CPI in Japan won't stop the Bank of Japan from continuing to normalize its monetary policy by summer, as the country enters its financial doom loop.
The US flash PMI indices add to the pain for those still believing the FED will pivot later this year.
US inflation expectations, while cooler than expected like the April CPI, will not quell the return of the inflation boomerang.
The minutes from the ‘MayDay’ FOMC meeting confirmed that the FED’s ‘Forward Confusion’ narrative is caught between a rock and a paradox.
One of the reasons to own Gold is that since the dawn of time, Gold has been nobody’s debt as ‘Gold is Money. Everything else is Credit.’
Debts live or die, whether repaid or not, according to political, economic, and social circumstances. Gold, however, does not die.
Gold is still a low beta play on EM with a call option on Western financial chaos.
The Gold price remains exceedingly cheap compared to corporate America’s profitability and even cheaper ahead of a sovereign debt crisis.
With continued decline in trust in public institutions, particularly in the Western world, investors are expected to move even more into assets with no counterparty risk which are non-confiscatable, like physical gold.
For fixed income investors who are still chasing the long duration trade in US government bonds, more pain awaits as long-dated yields must reflect the new stagflation reality.
In a stagflation, the best way to protect wealth is still to own the equity barbell portfolio made of Tech and Energy and Physical Gold and avoid long dated bonds.
As stagflation rather than recession materializes as the economy is increasingly weaponized, investors should prepare their portfolios for HIGHER volatility.
In this context, investors should also remain prepared for dull inflation-adjusted returns in the foreseeable future.
HOW TO TRADE IT?
After six straight weeks of weakness, US Macro Surprise data surged higher this past week. While this was initially seen as bad news by equity markets, Nvidia once again saved the day, allowing the Nasdaq to outperform and the S&P 500 which ended the week in the green for the fifth straight week. Small caps and the Dow both ended the week notably down, hit by the hawkish FED minutes which, as expected, reduced hope for a rate cut later this year. In this context, investors should remain 'strategically patient.' Rising volatility, driven by renewed geopolitical tensions, could push equity indices back to key support levels in the coming weeks, providing an attractive buying opportunity for those sitting on the sidelines with cash.
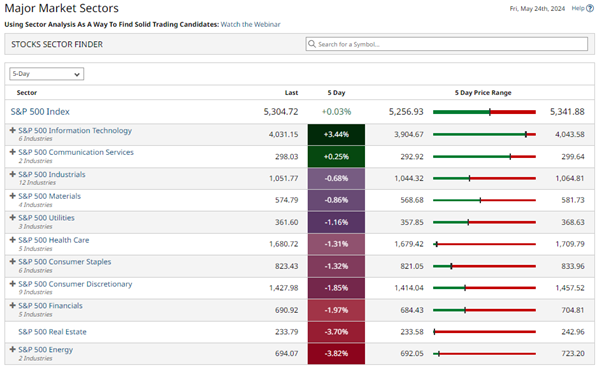
In this context, it's no surprise that the rally was dominated by growth sectors like IT and Communication Services, while Real Estate and Energy lagged behind.
The best way to express the need to own gold in a diversified portfolio is to own the metal outright physically and to store it in a private and secured vault outside the banking system. This is simple, clean, liquid, and likely holds few negative surprises. An alternative is to trade a Physical Gold ETF, but this removes the decentralized nature of physical gold as these ETFs are subject to the rules governing stock exchanges.
Investors who are more adventurous can buy gold royalty companies. The issue is that most tend to offer a lower beta to changes in the gold price, while trading at fairly rich valuations.
Another option is to buy precious metal miners. After a long decade of underperformance, most stocks are both attractively valued and under-owned, if not loathed. The problem is that such miners have spent billions in the past decade looking for gold but not found that much. Another issue is that gold mining is an energy-intensive business, and rising energy prices may dent earnings. Additionally, a lot of gold mining takes place in areas of the world where property rights can be ‘flexible,’ and as the gold price rises, the temptation for governments in places like Mali or the Democratic Republic of the Congo to nationalize mines can be strong.
A final option is to buy brokers and money managers specialized in precious metals. Such names tend to make money on rising volumes more than rising prices, although in a normal bull market, volumes tend to follow prices higher. So far, across developed markets (excluding Japan), we have seen rising gold prices, but not yet rising volumes. If this is the next step of the gold bull market, this part of the market may well thrive.
At The Macro Butler, our mission is to leverage our macro views to provide actionable and investable recommendations to all types of investors. In this regard, we offer two types of portfolios to our paid clients.
The Macro Butler Long/Short Portfolio is a dynamic and trading portfolio designed to invest in individual securities, aligning with our strategic and tactical investment recommendations.
The Macro Butler Strategic Portfolio consists of 20 ETFs (long only) and serves as the foundation for a multi-asset portfolio that reflects our long-term macro views.
Investors interested in obtaining more information about the Macro Butler Long/Short and Strategic portfolios can contact us at info@themacrobutler.com.
Unlock Your Financial Success with the Macro Butler!
Disclaimer
The content provided in this newsletter is for general information purposes only. No information, materials, services, and other content provided in this post constitute solicitation, recommendation, endorsement or any financial, investment, or other advice.
Seek independent professional consultation in the form of legal, financial, and fiscal advice before making any investment decisions.
Always perform your own due diligence.


